CF Methylation Pilot Analysis
Jovana Maksimovic
12/17/2018
Last updated: 2020-03-16
Checks: 7 0
Knit directory: paed-cf-methylation/
This reproducible R Markdown analysis was created with workflowr (version 1.6.1). The Checks tab describes the reproducibility checks that were applied when the results were created. The Past versions tab lists the development history.
Great! Since the R Markdown file has been committed to the Git repository, you know the exact version of the code that produced these results.
Great job! The global environment was empty. Objects defined in the global environment can affect the analysis in your R Markdown file in unknown ways. For reproduciblity it’s best to always run the code in an empty environment.
The command set.seed(20200224) was run prior to running the code in the R Markdown file. Setting a seed ensures that any results that rely on randomness, e.g. subsampling or permutations, are reproducible.
Great job! Recording the operating system, R version, and package versions is critical for reproducibility.
Nice! There were no cached chunks for this analysis, so you can be confident that you successfully produced the results during this run.
Great job! Using relative paths to the files within your workflowr project makes it easier to run your code on other machines.
Great! You are using Git for version control. Tracking code development and connecting the code version to the results is critical for reproducibility.
The results in this page were generated with repository version b268666. See the Past versions tab to see a history of the changes made to the R Markdown and HTML files.
Note that you need to be careful to ensure that all relevant files for the analysis have been committed to Git prior to generating the results (you can use wflow_publish or wflow_git_commit). workflowr only checks the R Markdown file, but you know if there are other scripts or data files that it depends on. Below is the status of the Git repository when the results were generated:
Ignored files:
    Ignored:    .Rhistory
    Ignored:    .Rproj.user/
    Ignored:    code/DNAm-based-age-predictor/
    Ignored:    data/CFGeneModifiers.csv
    Ignored:    data/Horvath-27k-probes.csv
    Ignored:    data/Horvath-coefficients.csv
    Ignored:    data/Horvath-methylation-data.csv
    Ignored:    data/Horvath-mini-annotation.csv
    Ignored:    data/Horvath-sample-data.csv
    Ignored:    data/ageFile-final.txt
    Ignored:    data/idat/
    Ignored:    data/processedData.RData
    Ignored:    data/rawPatientBetas.rds
    Ignored:    output/Horvath-output.csv
    Ignored:    output/Horvath-output2.csv
    Ignored:    output/age.pred
    Ignored:    output/stderr.txt
    Ignored:    output/stdout.txt
Note that any generated files, e.g. HTML, png, CSS, etc., are not included in this status report because it is ok for generated content to have uncommitted changes.
These are the previous versions of the repository in which changes were made to the R Markdown (analysis/dataExplore.Rmd) and HTML (docs/dataExplore.html) files. If you’ve configured a remote Git repository (see ?wflow_git_remote), click on the hyperlinks in the table below to view the files as they were in that past version.
| File | Version | Author | Date | Message |
|---|---|---|---|---|
| html | 02bf97c | Jovana Maksimovic | 2020-03-16 | Build site. |
| Rmd | 58398ed | Jovana Maksimovic | 2020-03-16 | wflow_publish(“analysis/dataExplore.Rmd”) |
Exploratory analysis of lavage methylation data
Data import
Load all the packages required for analysis.
library(here)
library(workflowr)
#Load Packages Required for Analysis
library(limma)
library(minfi)
library(RColorBrewer)
library(missMethyl)
library(matrixStats)
library(minfiData)
library(Gviz)
library(DMRcate)
Warning: replacing previous import 'minfi::getMeth' by 'bsseq::getMeth' when
loading 'DMRcate'library(stringr)
library(IlluminaHumanMethylationEPICanno.ilm10b4.hg19)
library(IlluminaHumanMethylationEPICmanifest)Load the EPIC array annotation data that describes the genomic context of each of the probes on the array.
# Get the EPICarray annotation data
annEPIC <- getAnnotation(IlluminaHumanMethylationEPICanno.ilm10b4.hg19)
head(annEPIC)
DataFrame with 6 rows and 46 columns
chr pos strand Name AddressA
<character> <integer> <character> <character> <character>
cg18478105 chr20 61847650 - cg18478105 46761277
cg09835024 chrX 24072640 - cg09835024 16745152
cg14361672 chr9 131463936 + cg14361672 51800947
cg01763666 chr17 80159506 + cg01763666 37768834
cg12950382 chr14 105176736 + cg12950382 8726444
cg02115394 chr13 115000168 + cg02115394 68602543
AddressB ProbeSeqA
<character> <character>
cg18478105 86644198 AAATAAATTTCACTCTCAAATCCCAATCTCATACAACAAAACAAAAACCA
cg09835024 81631976 AATAAACACCAACCCCAAACCAATCTCACTTTATTAAATTACAAAAATCA
cg14361672 7743487 ATCACTACCTAATCTATAACAAACCATTCAACCCATCCTAACATCCTACA
cg01763666 23754592 AAACAAAAATAAACAAACTCAAAATAAAAACAACTAAACTAAAACAAACA
cg12950382 76660327 ATACCAAAAAATAACAATATACTTATATATATACACATACCCAAATAACA
cg02115394 59659581 AAAATCACTACAACACCTCTAAACATTAACAAAAAAATCAAAAAAACTCA
ProbeSeqB Type
<character> <character>
cg18478105 AAATAAATTTCGCTCTCAAATCCCAATCTCGTACGACGAAACGAAAACCG I
cg09835024 AATAAACGCCGACCCCGAACCGATCTCGCTTTATTAAATTACAAAAATCG I
cg14361672 ATCACTACCTAATCTATAACGAACCATTCAACCCGTCCTAACATCCTACG I
cg01763666 GAACAAAAATAAACGAACTCAAAATAAAAACAACTAAACTAAAACAAACG I
cg12950382 GTACCGAAAAATAACAATATACTTATATATATACACGTACCCGAATAACG I
cg02115394 AAAATCGCTACGACGCCTCTAAACATTAACGAAAAAATCAAAAAAACTCG I
NextBase Color Probe_rs Probe_maf CpG_rs CpG_maf
<character> <character> <character> <numeric> <character> <numeric>
cg18478105 C Grn NA NA NA NA
cg09835024 A Red NA NA NA NA
cg14361672 T Red NA NA NA NA
cg01763666 C Grn NA NA NA NA
cg12950382 A Red rs12882277 0.378464 NA NA
cg02115394 A Red NA NA NA NA
SBE_rs SBE_maf Islands_Name Relation_to_Island
<character> <numeric> <character> <character>
cg18478105 NA NA chr20:61846843-61848103 Island
cg09835024 NA NA chrX:24072558-24073135 Island
cg14361672 NA NA chr9:131464843-131465830 N_Shore
cg01763666 NA NA OpenSea
cg12950382 NA NA OpenSea
cg02115394 NA NA chr13:115000148-115000874 Island
Forward_Sequence
<character>
cg18478105 TCCCGTCTTACGGGATGGATTTCGCTCTCAGGTCCCAGTCTCGTGCGGCGGGGCGGGGAC[CG]CAGCCGGCTGGGCGGGGAAGCCCTGAGCCGGGGAAGTCACGTGGGGCGTGTCCGGAGGCG
cg09835024 AGCCCCGTCATAGGTGGGCGCCGACCCCGAGCCGATCTCGCTTTATTAAATTACAGAAAT[CG]GTATTCAAAAAAAAAAAAAAAAAAGGGCGGGGAGGACACTCCCTCTTCTCTGTTCCCACA
cg14361672 TCACCTTCCCACCTCCTGGAGGACGCTCCTCCACGAAGTGCTGACACAACCTCCTGTAAA[CG]CAGGATGCCAGGACGGGCTGAATGGCCCGCCATAGACTAGGCAGTGACCAGCACACCTCC
cg01763666 CTGGAATGCCAGCTGCTGCTGCTGCTGCAGCTCCTCCACCTTCCTGGCCTCTCTGGCTAG[CG]CCTGCCTCAGCTTAGCTGCCTCTATCTTGAGCTCGCTCACCTCTGCCCGCCTGGCCTCTT
cg12950382 CCCTGCTGCCACCACCTCGGTGCACACACCTACTGGACGCACAGACACACGCATGCCCAC[CG]CCACTCGGGCACGTGCACACACACAAGCACACTGCCACTCTCCGGCACGCGCACACACAA
cg02115394 TTCTGGGGAAAGAAGGCTCAGCAGCCACCTGCTTTTTTGCCCGGGTGGGTGGTCCGGCCC[CG]AGCCCTCCTGACTCTCTCGCCAATGCCCAGAGGCGCCGCAGCGATTCCAGGGAGGCCGCG
SourceSeq UCSC_RefGene_Name
<character> <character>
cg18478105 CGGTCCCCGCCCCGCCGCACGAGACTGGGACCTGAGAGCGAAATCCATCC YTHDF1
cg09835024 GGTGGGCGCCGACCCCGAGCCGATCTCGCTTTATTAAATTACAGAAATCG EIF2S3
cg14361672 CGCAGGATGCCAGGACGGGCTGAATGGCCCGCCATAGACTAGGCAGTGAC PKN3
cg01763666 CGCCTGCCTCAGCTTAGCTGCCTCTATCTTGAGCTCGCTCACCTCTGCCC CCDC57
cg12950382 CGCCACTCGGGCACGTGCACACACACAAGCACACTGCCACTCTCCGGCAC INF2;INF2
cg02115394 GGAATCGCTGCGGCGCCTCTGGGCATTGGCGAGAGAGTCAGGAGGGCTCG CDC16;CDC16
UCSC_RefGene_Accession UCSC_RefGene_Group Phantom4_Enhancers
<character> <character> <character>
cg18478105 NM_017798 TSS200
cg09835024 NM_001415 TSS1500
cg14361672 NM_013355 TSS1500
cg01763666 NM_198082 Body
cg12950382 NM_022489;NM_001031714 Body;Body
cg02115394 NM_003903;NM_001078645 TSS200;TSS200
Phantom5_Enhancers DMR X450k_Enhancer HMM_Island
<character> <character> <character> <character>
cg18478105 20:61317142-61318498
cg09835024
cg14361672
cg01763666 17:77752688-77752973
cg12950382 14:104247518-104247873
cg02115394 13:114018251-114018976
Regulatory_Feature_Name Regulatory_Feature_Group
<character> <character>
cg18478105 20:61846284-61847956 Promoter_Associated
cg09835024 X:24071907-24073667 Promoter_Associated
cg14361672
cg01763666
cg12950382
cg02115394 13:115000009-115001429 Promoter_Associated
GencodeBasicV12_NAME
<character>
cg18478105 YTHDF1;YTHDF1
cg09835024 EIF2S3
cg14361672 PKN3
cg01763666
cg12950382
cg02115394 CDC16;CDC16;CDC16;CDC16;CDC16
GencodeBasicV12_Accession
<character>
cg18478105 ENST00000370334.4;ENST00000370339.3
cg09835024 ENST00000253039.4
cg14361672 ENST00000291906.4
cg01763666
cg12950382
cg02115394 ENST00000375312.3;ENST00000356221.3;ENST00000375310.1;ENST00000252457.5;ENST00000252458.6
GencodeBasicV12_Group
<character>
cg18478105 TSS200;TSS200
cg09835024 TSS200
cg14361672 TSS1500
cg01763666
cg12950382
cg02115394 TSS200;TSS1500;TSS1500;TSS1500;TSS1500
GencodeCompV12_NAME
<character>
cg18478105 YTHDF1;YTHDF1
cg09835024 EIF2S3;EIF2S3;EIF2S3
cg14361672 PKN3
cg01763666
cg12950382 INF2;INF2
cg02115394 CDC16;CDC16;CDC16;CDC16;CDC16;CDC16
GencodeCompV12_Accession
<character>
cg18478105 ENST00000370334.4;ENST00000370339.3
cg09835024 ENST00000487075.1;ENST00000423068.1;ENST00000253039.4
cg14361672 ENST00000291906.4
cg01763666
cg12950382 ENST00000474229.1;ENST00000480763.1
cg02115394 ENST00000360383.3;ENST00000356221.3;ENST00000375310.1;ENST00000494766.1;ENST00000375308.1;ENST00000252458.6
GencodeCompV12_Group
<character>
cg18478105 TSS200;TSS200
cg09835024 TSS1500;TSS1500;TSS200
cg14361672 TSS1500
cg01763666
cg12950382 5'UTR;TSS1500
cg02115394 TSS200;TSS1500;TSS1500;TSS1500;TSS1500;TSS1500
DNase_Hypersensitivity_NAME DNase_Hypersensitivity_Evidence_Count
<character> <character>
cg18478105 chr20:61847520-61847755 3
cg09835024 chrX:24072600-24073395 3
cg14361672
cg01763666 chr17:80159145-80159790 3
cg12950382
cg02115394
OpenChromatin_NAME OpenChromatin_Evidence_Count TFBS_NAME
<character> <character> <character>
cg18478105
cg09835024
cg14361672 chr9:131463740-131463970 3
cg01763666
cg12950382 chr14:105171651-105183138 6
cg02115394 chr13:114999804-115001809 6
TFBS_Evidence_Count Methyl27_Loci Methyl450_Loci Random_Loci
<character> <character> <character> <character>
cg18478105 TRUE
cg09835024 TRUE
cg14361672 TRUE
cg01763666 TRUE
cg12950382 TRUE
cg02115394 TRUE Read the sample information and IDAT file paths into R.
# absolute path to the directory where the data is (relative to the Rstudio project)
dataDirectory <- here("data/idat")

list.files(dataDirectory, recursive = TRUE)
[1] "202900540047_R01C01_Grn.idat"
[2] "202900540047_R01C01_Red.idat"
[3] "202900540047_R02C01_Grn.idat"
[4] "202900540047_R02C01_Red.idat"
[5] "202900540047_R03C01_Grn.idat"
[6] "202900540047_R03C01_Red.idat"
[7] "202900540047_R04C01_Grn.idat"
[8] "202900540047_R04C01_Red.idat"
[9] "202900540047_R05C01_Grn.idat"
[10] "202900540047_R05C01_Red.idat"
[11] "202900540047_R06C01_Grn.idat"
[12] "202900540047_R06C01_Red.idat"
[13] "202900540047_R07C01_Grn.idat"
[14] "202900540047_R07C01_Red.idat"
[15] "202900540047_R08C01_Grn.idat"
[16] "202900540047_R08C01_Red.idat"
[17] "202900540100_R01C01_Grn.idat"
[18] "202900540100_R01C01_Red.idat"
[19] "202900540100_R02C01_Grn.idat"
[20] "202900540100_R02C01_Red.idat"
[21] "202900540100_R03C01_Grn.idat"
[22] "202900540100_R03C01_Red.idat"
[23] "202900540100_R04C01_Grn.idat"
[24] "202900540100_R04C01_Red.idat"
[25] "202900540100_R05C01_Grn.idat"
[26] "202900540100_R05C01_Red.idat"
[27] "202900540100_R06C01_Grn.idat"
[28] "202900540100_R06C01_Red.idat"
[29] "202900540100_R07C01_Grn.idat"
[30] "202900540100_R07C01_Red.idat"
[31] "202900540100_R08C01_Grn.idat"
[32] "202900540100_R08C01_Red.idat"
[33] "202900540115_R01C01_Grn.idat"
[34] "202900540115_R01C01_Red.idat"
[35] "202900540115_R02C01_Grn.idat"
[36] "202900540115_R02C01_Red.idat"
[37] "202900540115_R03C01_Grn.idat"
[38] "202900540115_R03C01_Red.idat"
[39] "202900540115_R04C01_Grn.idat"
[40] "202900540115_R04C01_Red.idat"
[41] "202900540115_R05C01_Grn.idat"
[42] "202900540115_R05C01_Red.idat"
[43] "202900540115_R06C01_Grn.idat"
[44] "202900540115_R06C01_Red.idat"
[45] "202900540115_R07C01_Grn.idat"
[46] "202900540115_R07C01_Red.idat"
[47] "202900540115_R08C01_Grn.idat"
[48] "202900540115_R08C01_Red.idat"
[49] "202905570075_R01C01_Grn.idat"
[50] "202905570075_R01C01_Red.idat"
[51] "202905570075_R02C01_Grn.idat"
[52] "202905570075_R02C01_Red.idat"
[53] "202905570075_R03C01_Grn.idat"
[54] "202905570075_R03C01_Red.idat"
[55] "202905570075_R04C01_Grn.idat"
[56] "202905570075_R04C01_Red.idat"
[57] "202905570075_R05C01_Grn.idat"
[58] "202905570075_R05C01_Red.idat"
[59] "202905570075_R06C01_Grn.idat"
[60] "202905570075_R06C01_Red.idat"
[61] "202905570075_R07C01_Grn.idat"
[62] "202905570075_R07C01_Red.idat"
[63] "202905570075_R08C01_Grn.idat"
[64] "202905570075_R08C01_Red.idat"
[65] "203013220097_R01C01_Grn.idat"
[66] "203013220097_R01C01_Red.idat"
[67] "203013220097_R02C01_Grn.idat"
[68] "203013220097_R02C01_Red.idat"
[69] "203013220097_R03C01_Grn.idat"
[70] "203013220097_R03C01_Red.idat"
[71] "203013220097_R04C01_Grn.idat"
[72] "203013220097_R04C01_Red.idat"
[73] "203013220097_R05C01_Grn.idat"
[74] "203013220097_R05C01_Red.idat"
[75] "203013220097_R06C01_Grn.idat"
[76] "203013220097_R06C01_Red.idat"
[77] "203013220097_R07C01_Grn.idat"
[78] "203013220097_R07C01_Red.idat"
[79] "203013220097_R08C01_Grn.idat"
[80] "203013220097_R08C01_Red.idat"
[81] "Assessment for poor quality samples.pdf"
[82] "bVals.rds"
[83] "Clustering of cell types.pdf"
[84] "Cross Reactive Probes EPIC array.txt"
[85] "Data Exploration MDS (No Legend).pdf"
[86] "Data Exploration MDS 1 (legend).pdf"
[87] "Data Exploration MDS 2 no legend.pdf"
[88] "DMPs.csv"
[89] "Jovana Workflow Analysis 4.12.18"
[90] "Normalisation (with legend).pdf"
[91] "Normalised (no legend).pdf"
[92] "processedData.RData"
[93] "qcReport.pdf"
[94] "Samplesheet.csv" # read in the sample sheet for the experiment
targets <- read.csv(here("data/idat/Samplesheet.csv"))[-1,] # leave out the genome control sapmle
# set the path to the idat files relative to R project setup
targets$Basename <- gsub("/home/shivanthan.shanthiku/Shiv_DNAme/DNA Methylation/idat files Exp #1/",
here("data/idat/"), targets$Basename)
# clean up some labels
targets$Sample_Group <- targets$Sample_Label <- gsub("Granuloycte","Granulocyte",targets$Sample_Group)
targets$Sample_Group <- targets$Sample_Label <- gsub("Epithelialcell","EpithelialCell",targets$Sample_Group)
targets Sample_Name Sample_Well Sample_Plate Sample_Group Sample_Label
2 103516-001-002 B01 1 EpithelialCell EpithelialCell
3 103516-001-003 C01 1 Case Case
4 103516-001-004 D01 1 Control Control
5 103516-001-005 E01 1 Case Case
6 103516-001-006 F01 1 Control Control
7 103516-001-007 G01 1 Case Case
8 103516-001-008 H01 1 Control Control
9 103516-001-009 A02 1 Case Case
10 103516-001-010 B02 1 Control Control
11 103516-001-011 C02 1 Case Case
12 103516-001-012 D02 1 Control Control
13 103516-001-013 E02 1 Case Case
14 103516-001-014 F02 1 Control Control
15 103516-001-015 G02 1 Case Case
16 103516-001-016 H02 1 Control Control
17 103516-001-017 A03 1 Case Case
18 103516-001-018 B03 1 Control Control
19 103516-001-019 C03 1 Case Case
20 103516-001-020 D03 1 Control Control
21 103516-001-021 E03 1 Case Case
22 103516-001-022 F03 1 Control Control
23 103516-001-023 G03 1 Case Case
24 103516-001-024 H03 1 Control Control
25 103516-001-025 A04 1 Case Case
26 103516-001-026 B04 1 Control Control
27 103516-001-027 C04 1 Case Case
28 103516-001-028 D04 1 Control Control
29 103516-001-029 E04 1 Case Case
30 103516-001-030 F04 1 Control Control
31 103516-001-031 G04 1 Control Control
32 103516-001-033 A05 1 Macrophage Macrophage
33 103516-001-034 B05 1 Macrophage Macrophage
34 103516-001-035 C05 1 Macrophage Macrophage
35 103516-001-036 D05 1 Granulocyte Granulocyte
36 103516-001-037 E05 1 Granulocyte Granulocyte
37 103516-001-038 F05 1 Granulocyte Granulocyte
38 103516-001-039 G05 1 Lymphocyte Lymphocyte
39 103516-001-040 H05 1 Lymphocyte Lymphocyte
Sentrix_ID Sentrix_Position
2 2.02906e+11 R02C01
3 2.02906e+11 R03C01
4 2.02906e+11 R04C01
5 2.02906e+11 R05C01
6 2.02906e+11 R06C01
7 2.02906e+11 R07C01
8 2.02906e+11 R08C01
9 2.02901e+11 R01C01
10 2.02901e+11 R02C01
11 2.02901e+11 R03C01
12 2.02901e+11 R04C01
13 2.02901e+11 R05C01
14 2.02901e+11 R06C01
15 2.02901e+11 R07C01
16 2.02901e+11 R08C01
17 2.03013e+11 R01C01
18 2.03013e+11 R02C01
19 2.03013e+11 R03C01
20 2.03013e+11 R04C01
21 2.03013e+11 R05C01
22 2.03013e+11 R06C01
23 2.03013e+11 R07C01
24 2.03013e+11 R08C01
25 2.02901e+11 R01C01
26 2.02901e+11 R02C01
27 2.02901e+11 R03C01
28 2.02901e+11 R04C01
29 2.02901e+11 R05C01
30 2.02901e+11 R06C01
31 2.02901e+11 R07C01
32 2.02901e+11 R01C01
33 2.02901e+11 R02C01
34 2.02901e+11 R03C01
35 2.02901e+11 R04C01
36 2.02901e+11 R05C01
37 2.02901e+11 R06C01
38 2.02901e+11 R07C01
39 2.02901e+11 R08C01
Basename
2 /oshlack_lab/jovana.maksimovic/projects/MCRI/shivanthan.shanthikumar/paed-cf-methylation/data/idat/202905570075_R02C01
3 /oshlack_lab/jovana.maksimovic/projects/MCRI/shivanthan.shanthikumar/paed-cf-methylation/data/idat/202905570075_R03C01
4 /oshlack_lab/jovana.maksimovic/projects/MCRI/shivanthan.shanthikumar/paed-cf-methylation/data/idat/202905570075_R04C01
5 /oshlack_lab/jovana.maksimovic/projects/MCRI/shivanthan.shanthikumar/paed-cf-methylation/data/idat/202905570075_R05C01
6 /oshlack_lab/jovana.maksimovic/projects/MCRI/shivanthan.shanthikumar/paed-cf-methylation/data/idat/202905570075_R06C01
7 /oshlack_lab/jovana.maksimovic/projects/MCRI/shivanthan.shanthikumar/paed-cf-methylation/data/idat/202905570075_R07C01
8 /oshlack_lab/jovana.maksimovic/projects/MCRI/shivanthan.shanthikumar/paed-cf-methylation/data/idat/202905570075_R08C01
9 /oshlack_lab/jovana.maksimovic/projects/MCRI/shivanthan.shanthikumar/paed-cf-methylation/data/idat/202900540115_R01C01
10 /oshlack_lab/jovana.maksimovic/projects/MCRI/shivanthan.shanthikumar/paed-cf-methylation/data/idat/202900540115_R02C01
11 /oshlack_lab/jovana.maksimovic/projects/MCRI/shivanthan.shanthikumar/paed-cf-methylation/data/idat/202900540115_R03C01
12 /oshlack_lab/jovana.maksimovic/projects/MCRI/shivanthan.shanthikumar/paed-cf-methylation/data/idat/202900540115_R04C01
13 /oshlack_lab/jovana.maksimovic/projects/MCRI/shivanthan.shanthikumar/paed-cf-methylation/data/idat/202900540115_R05C01
14 /oshlack_lab/jovana.maksimovic/projects/MCRI/shivanthan.shanthikumar/paed-cf-methylation/data/idat/202900540115_R06C01
15 /oshlack_lab/jovana.maksimovic/projects/MCRI/shivanthan.shanthikumar/paed-cf-methylation/data/idat/202900540115_R07C01
16 /oshlack_lab/jovana.maksimovic/projects/MCRI/shivanthan.shanthikumar/paed-cf-methylation/data/idat/202900540115_R08C01
17 /oshlack_lab/jovana.maksimovic/projects/MCRI/shivanthan.shanthikumar/paed-cf-methylation/data/idat/203013220097_R01C01
18 /oshlack_lab/jovana.maksimovic/projects/MCRI/shivanthan.shanthikumar/paed-cf-methylation/data/idat/203013220097_R02C01
19 /oshlack_lab/jovana.maksimovic/projects/MCRI/shivanthan.shanthikumar/paed-cf-methylation/data/idat/203013220097_R03C01
20 /oshlack_lab/jovana.maksimovic/projects/MCRI/shivanthan.shanthikumar/paed-cf-methylation/data/idat/203013220097_R04C01
21 /oshlack_lab/jovana.maksimovic/projects/MCRI/shivanthan.shanthikumar/paed-cf-methylation/data/idat/203013220097_R05C01
22 /oshlack_lab/jovana.maksimovic/projects/MCRI/shivanthan.shanthikumar/paed-cf-methylation/data/idat/203013220097_R06C01
23 /oshlack_lab/jovana.maksimovic/projects/MCRI/shivanthan.shanthikumar/paed-cf-methylation/data/idat/203013220097_R07C01
24 /oshlack_lab/jovana.maksimovic/projects/MCRI/shivanthan.shanthikumar/paed-cf-methylation/data/idat/203013220097_R08C01
25 /oshlack_lab/jovana.maksimovic/projects/MCRI/shivanthan.shanthikumar/paed-cf-methylation/data/idat/202900540100_R01C01
26 /oshlack_lab/jovana.maksimovic/projects/MCRI/shivanthan.shanthikumar/paed-cf-methylation/data/idat/202900540100_R02C01
27 /oshlack_lab/jovana.maksimovic/projects/MCRI/shivanthan.shanthikumar/paed-cf-methylation/data/idat/202900540100_R03C01
28 /oshlack_lab/jovana.maksimovic/projects/MCRI/shivanthan.shanthikumar/paed-cf-methylation/data/idat/202900540100_R04C01
29 /oshlack_lab/jovana.maksimovic/projects/MCRI/shivanthan.shanthikumar/paed-cf-methylation/data/idat/202900540100_R05C01
30 /oshlack_lab/jovana.maksimovic/projects/MCRI/shivanthan.shanthikumar/paed-cf-methylation/data/idat/202900540100_R06C01
31 /oshlack_lab/jovana.maksimovic/projects/MCRI/shivanthan.shanthikumar/paed-cf-methylation/data/idat/202900540100_R07C01
32 /oshlack_lab/jovana.maksimovic/projects/MCRI/shivanthan.shanthikumar/paed-cf-methylation/data/idat/202900540047_R01C01
33 /oshlack_lab/jovana.maksimovic/projects/MCRI/shivanthan.shanthikumar/paed-cf-methylation/data/idat/202900540047_R02C01
34 /oshlack_lab/jovana.maksimovic/projects/MCRI/shivanthan.shanthikumar/paed-cf-methylation/data/idat/202900540047_R03C01
35 /oshlack_lab/jovana.maksimovic/projects/MCRI/shivanthan.shanthikumar/paed-cf-methylation/data/idat/202900540047_R04C01
36 /oshlack_lab/jovana.maksimovic/projects/MCRI/shivanthan.shanthikumar/paed-cf-methylation/data/idat/202900540047_R05C01
37 /oshlack_lab/jovana.maksimovic/projects/MCRI/shivanthan.shanthikumar/paed-cf-methylation/data/idat/202900540047_R06C01
38 /oshlack_lab/jovana.maksimovic/projects/MCRI/shivanthan.shanthikumar/paed-cf-methylation/data/idat/202900540047_R07C01
39 /oshlack_lab/jovana.maksimovic/projects/MCRI/shivanthan.shanthikumar/paed-cf-methylation/data/idat/202900540047_R08C01
Sample_source
2 A1
3 52H
4 61G
5 26G
6 14G
7 29G
8 M1C005F
9 54F12
10 89C
11 55F12
12 32G
13 12F11
14 50G
15 06F
16 62H
17 23EE10
18 37H
19 53F
20 41G
21 48i
22 25G12
23 45G
24 18H12
25 21E
26 04G11
27 76B10
28 78B10
29 57G
30 08F
31 008G
32 M1
33 M2
34 M3
35 G1
36 G2
37 G3
38 L1
39 L2Read in the raw methylation data.
# read in the raw data from the IDAT files
rgSet <- read.metharray.exp(targets=targets)
rgSet
class: RGChannelSet
dim: 1051815 38
metadata(0):
assays(2): Green Red
rownames(1051815): 1600101 1600111 ... 99810990 99810992
rowData names(0):
colnames(38): 202905570075_R02C01 202905570075_R03C01 ...
202900540047_R07C01 202900540047_R08C01
colData names(10): Sample_Name Sample_Well ... Sample_source filenames
Annotation
array: IlluminaHumanMethylationEPIC
annotation: ilm10b4.hg19# give the samples descriptive names
targets$ID <- paste(targets$Sample_Group,targets$Sample_Name,sep=".")
sampleNames(rgSet) <- targets$ID
rgSetclass: RGChannelSet
dim: 1051815 38
metadata(0):
assays(2): Green Red
rownames(1051815): 1600101 1600111 ... 99810990 99810992
rowData names(0):
colnames(38): EpithelialCell.103516-001-002 Case.103516-001-003 ...
Lymphocyte.103516-001-039 Lymphocyte.103516-001-040
colData names(10): Sample_Name Sample_Well ... Sample_source filenames
Annotation
array: IlluminaHumanMethylationEPIC
annotation: ilm10b4.hg19Quality control
Calculate the detection P-values for each probe so that we can check for any failed samples.
# QUALITY CONTROL

# calculate the detection p-values
detP <- detectionP(rgSet)
head(detP)
EpithelialCell.103516-001-002 Case.103516-001-003
cg18478105 0.000000e+00 0.000000e+00
cg09835024 0.000000e+00 0.000000e+00
cg14361672 0.000000e+00 0.000000e+00
cg01763666 0.000000e+00 0.000000e+00
cg12950382 8.335193e-55 1.249933e-203
cg02115394 0.000000e+00 0.000000e+00
Control.103516-001-004 Case.103516-001-005 Control.103516-001-006
cg18478105 0.000000e+00 0.000000e+00 0.000000e+00
cg09835024 0.000000e+00 0.000000e+00 0.000000e+00
cg14361672 0.000000e+00 0.000000e+00 0.000000e+00
cg01763666 0.000000e+00 0.000000e+00 0.000000e+00
cg12950382 1.076029e-203 3.638136e-83 9.125171e-225
cg02115394 0.000000e+00 0.000000e+00 0.000000e+00
Case.103516-001-007 Control.103516-001-008 Case.103516-001-009
cg18478105 0.000000e+00 0.000000e+00 0.000000e+00
cg09835024 0.000000e+00 0.000000e+00 0.000000e+00
cg14361672 0.000000e+00 0.000000e+00 0.000000e+00
cg01763666 0.000000e+00 0.000000e+00 0.000000e+00
cg12950382 6.462425e-67 2.744325e-110 2.623143e-158
cg02115394 0.000000e+00 0.000000e+00 0.000000e+00
Control.103516-001-010 Case.103516-001-011 Control.103516-001-012
cg18478105 0.000000e+00 0.000000e+00 0
cg09835024 0.000000e+00 0.000000e+00 0
cg14361672 0.000000e+00 0.000000e+00 0
cg01763666 0.000000e+00 0.000000e+00 0
cg12950382 2.381862e-107 1.570558e-220 0
cg02115394 0.000000e+00 0.000000e+00 0
Case.103516-001-013 Control.103516-001-014 Case.103516-001-015
cg18478105 0.000000e+00 0.000000e+00 0.00000e+00
cg09835024 0.000000e+00 0.000000e+00 0.00000e+00
cg14361672 0.000000e+00 0.000000e+00 0.00000e+00
cg01763666 0.000000e+00 0.000000e+00 0.00000e+00
cg12950382 1.741536e-87 6.564336e-269 2.01803e-135
cg02115394 0.000000e+00 0.000000e+00 0.00000e+00
Control.103516-001-016 Case.103516-001-017 Control.103516-001-018
cg18478105 0.000000e+00 0.00000e+00 0.000000e+00
cg09835024 0.000000e+00 0.00000e+00 0.000000e+00
cg14361672 0.000000e+00 0.00000e+00 0.000000e+00
cg01763666 0.000000e+00 0.00000e+00 0.000000e+00
cg12950382 2.982542e-62 4.78107e-112 2.030454e-126
cg02115394 0.000000e+00 0.00000e+00 0.000000e+00
Case.103516-001-019 Control.103516-001-020 Case.103516-001-021
cg18478105 0.000000e+00 0.000000e+00 0.000000e+00
cg09835024 0.000000e+00 0.000000e+00 0.000000e+00
cg14361672 0.000000e+00 0.000000e+00 0.000000e+00
cg01763666 0.000000e+00 0.000000e+00 0.000000e+00
cg12950382 2.338471e-51 8.236197e-155 1.190681e-98
cg02115394 0.000000e+00 0.000000e+00 0.000000e+00
Control.103516-001-022 Case.103516-001-023 Control.103516-001-024
cg18478105 0.000000e+00 0.000000e+00 0.000000e+00
cg09835024 0.000000e+00 0.000000e+00 0.000000e+00
cg14361672 0.000000e+00 0.000000e+00 0.000000e+00
cg01763666 0.000000e+00 0.000000e+00 0.000000e+00
cg12950382 8.692799e-115 1.096844e-116 8.419923e-50
cg02115394 0.000000e+00 0.000000e+00 0.000000e+00
Case.103516-001-025 Control.103516-001-026 Case.103516-001-027
cg18478105 0.000000e+00 0.000000e+00 0.000000e+00
cg09835024 0.000000e+00 0.000000e+00 0.000000e+00
cg14361672 0.000000e+00 0.000000e+00 0.000000e+00
cg01763666 0.000000e+00 0.000000e+00 0.000000e+00
cg12950382 2.457464e-49 2.618101e-61 1.238714e-109
cg02115394 0.000000e+00 0.000000e+00 0.000000e+00
Control.103516-001-028 Case.103516-001-029 Control.103516-001-030
cg18478105 0.000000e+00 0.000000e+00 0.000000e+00
cg09835024 0.000000e+00 0.000000e+00 0.000000e+00
cg14361672 0.000000e+00 0.000000e+00 0.000000e+00
cg01763666 0.000000e+00 0.000000e+00 0.000000e+00
cg12950382 1.418763e-118 2.516727e-167 5.036695e-91
cg02115394 0.000000e+00 0.000000e+00 0.000000e+00
Control.103516-001-031 Macrophage.103516-001-033
cg18478105 0.000000e+00 0.000000e+00
cg09835024 0.000000e+00 0.000000e+00
cg14361672 0.000000e+00 0.000000e+00
cg01763666 0.000000e+00 0.000000e+00
cg12950382 4.294179e-55 4.021151e-92
cg02115394 0.000000e+00 0.000000e+00
Macrophage.103516-001-034 Macrophage.103516-001-035
cg18478105 0.000000e+00 0.000000e+00
cg09835024 0.000000e+00 0.000000e+00
cg14361672 0.000000e+00 0.000000e+00
cg01763666 0.000000e+00 0.000000e+00
cg12950382 9.192242e-132 3.284289e-147
cg02115394 0.000000e+00 0.000000e+00
Granulocyte.103516-001-036 Granulocyte.103516-001-037
cg18478105 0.000000e+00 0.000000e+00
cg09835024 0.000000e+00 0.000000e+00
cg14361672 0.000000e+00 0.000000e+00
cg01763666 0.000000e+00 0.000000e+00
cg12950382 2.960354e-96 2.999361e-56
cg02115394 0.000000e+00 0.000000e+00
Granulocyte.103516-001-038 Lymphocyte.103516-001-039
cg18478105 0.000000e+00 0.000000e+00
cg09835024 0.000000e+00 0.000000e+00
cg14361672 0.000000e+00 0.000000e+00
cg01763666 0.000000e+00 0.000000e+00
cg12950382 4.455051e-121 7.075156e-93
cg02115394 0.000000e+00 0.000000e+00
Lymphocyte.103516-001-040
cg18478105 0.0000e+00
cg09835024 0.0000e+00
cg14361672 0.0000e+00
cg01763666 0.0000e+00
cg12950382 8.4912e-137
cg02115394 0.0000e+00# examine mean detection p-values across all samples to identify any failed samples
pal <- brewer.pal(8, "Dark2")
par(mfrow=c(1,2))
barplot(colMeans(detP), col=pal[factor(targets$Sample_Group)], las=2,
cex.names=0.8,ylab="Mean detection p-values")
abline(h=0.01,col="red")
legend("top", legend=levels(factor(targets$Sample_Group)), fill=pal,
bg="white")
barplot(colMeans(detP), col=pal[factor(targets$Sample_Group)], las=2,
cex.names=0.8, ylim = c(0,0.001), ylab="Mean detection p-values")
legend("top", legend=levels(factor(targets$Sample_Group)), fill=pal, bg="white")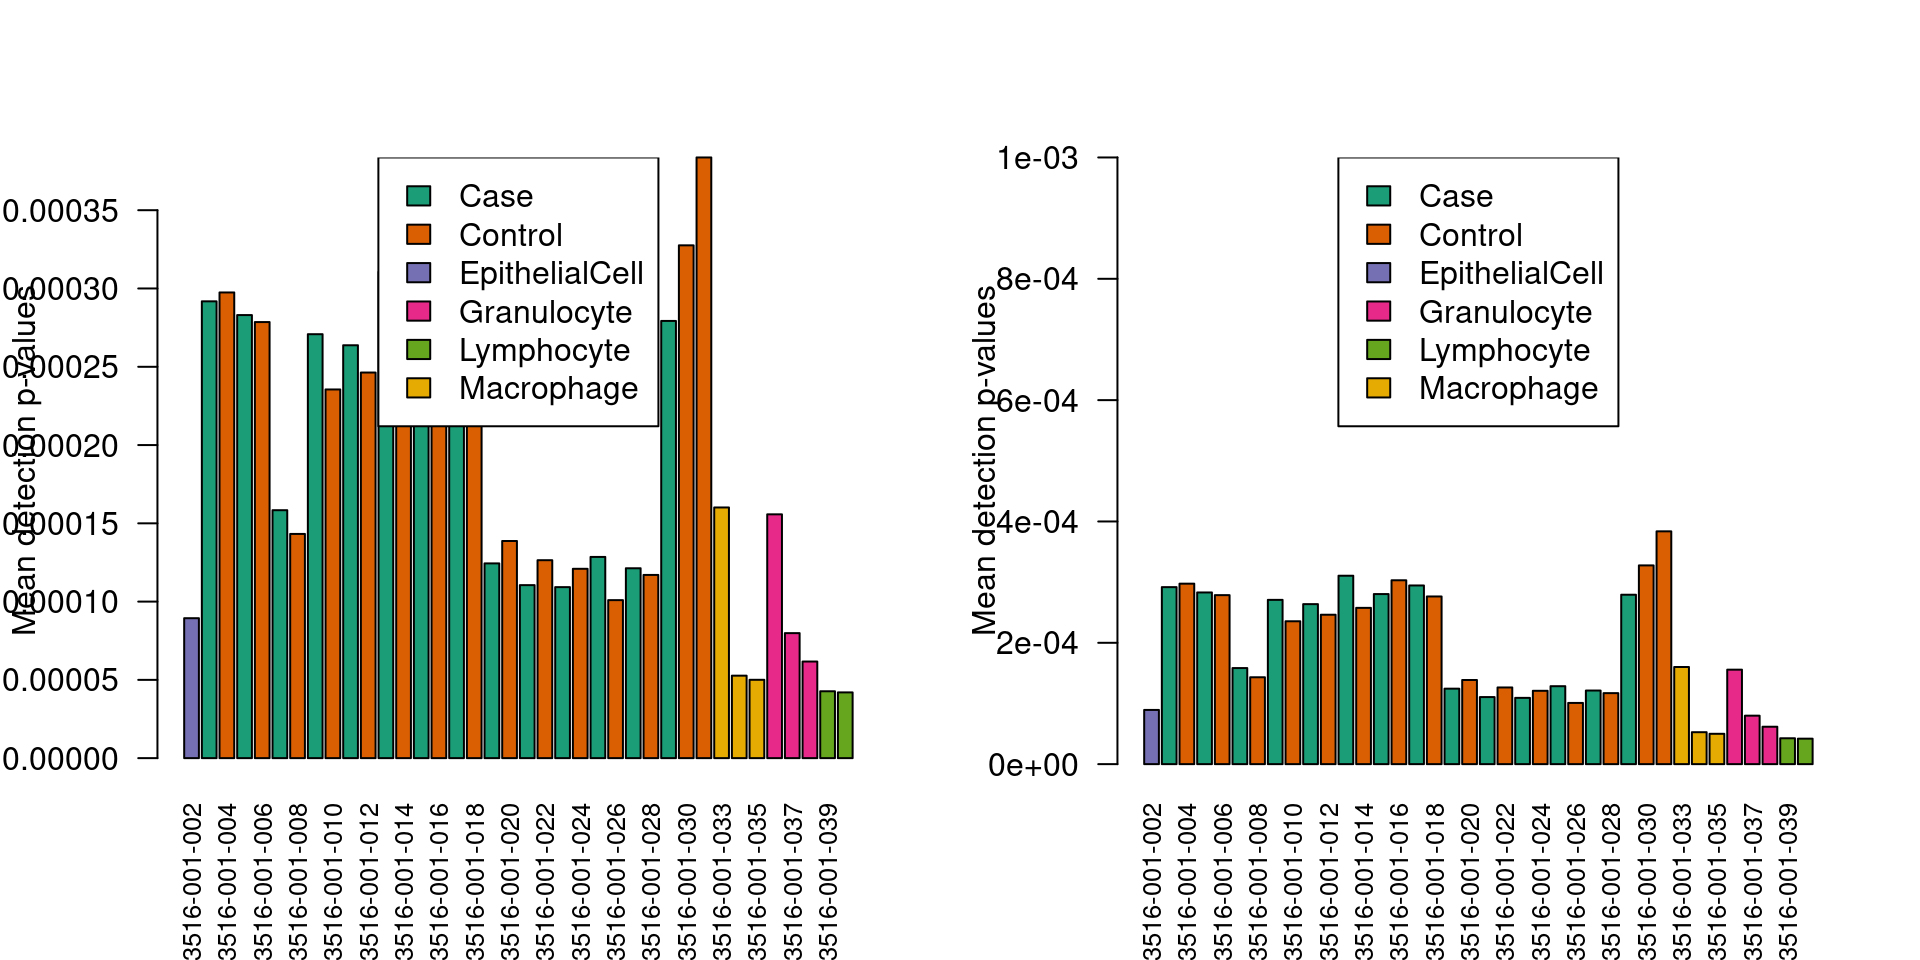
| Version | Author | Date |
|---|---|---|
| 02bf97c | Jovana Maksimovic | 2020-03-16 |
Normalisation
Normalise the data.
## NORMALISATION (decision made to used preprocessQuantile as tissue types are NOT vastly different)

# normalize the data; this results in a GenomicRatioSet object
mSetSq <- preprocessQuantile(rgSet)
[preprocessQuantile] Mapping to genome.[preprocessQuantile] Fixing outliers.[preprocessQuantile] Quantile normalizing.# create a MethylSet object from the raw data for plotting
mSetRaw <- preprocessRaw(rgSet)
# visualise what the data looks like before and after normalisation
par(mfrow=c(1,2))
densityPlot(rgSet, sampGroups=targets$Sample_Group,main="Raw", legend=FALSE)
legend("top", legend = levels(factor(targets$Sample_Group)),
text.col=brewer.pal(8,"Dark2"))
densityPlot(getBeta(mSetSq), sampGroups=targets$Sample_Group,
main="Normalized", legend=FALSE)
legend("top", legend = levels(factor(targets$Sample_Group)),
text.col=brewer.pal(8,"Dark2"))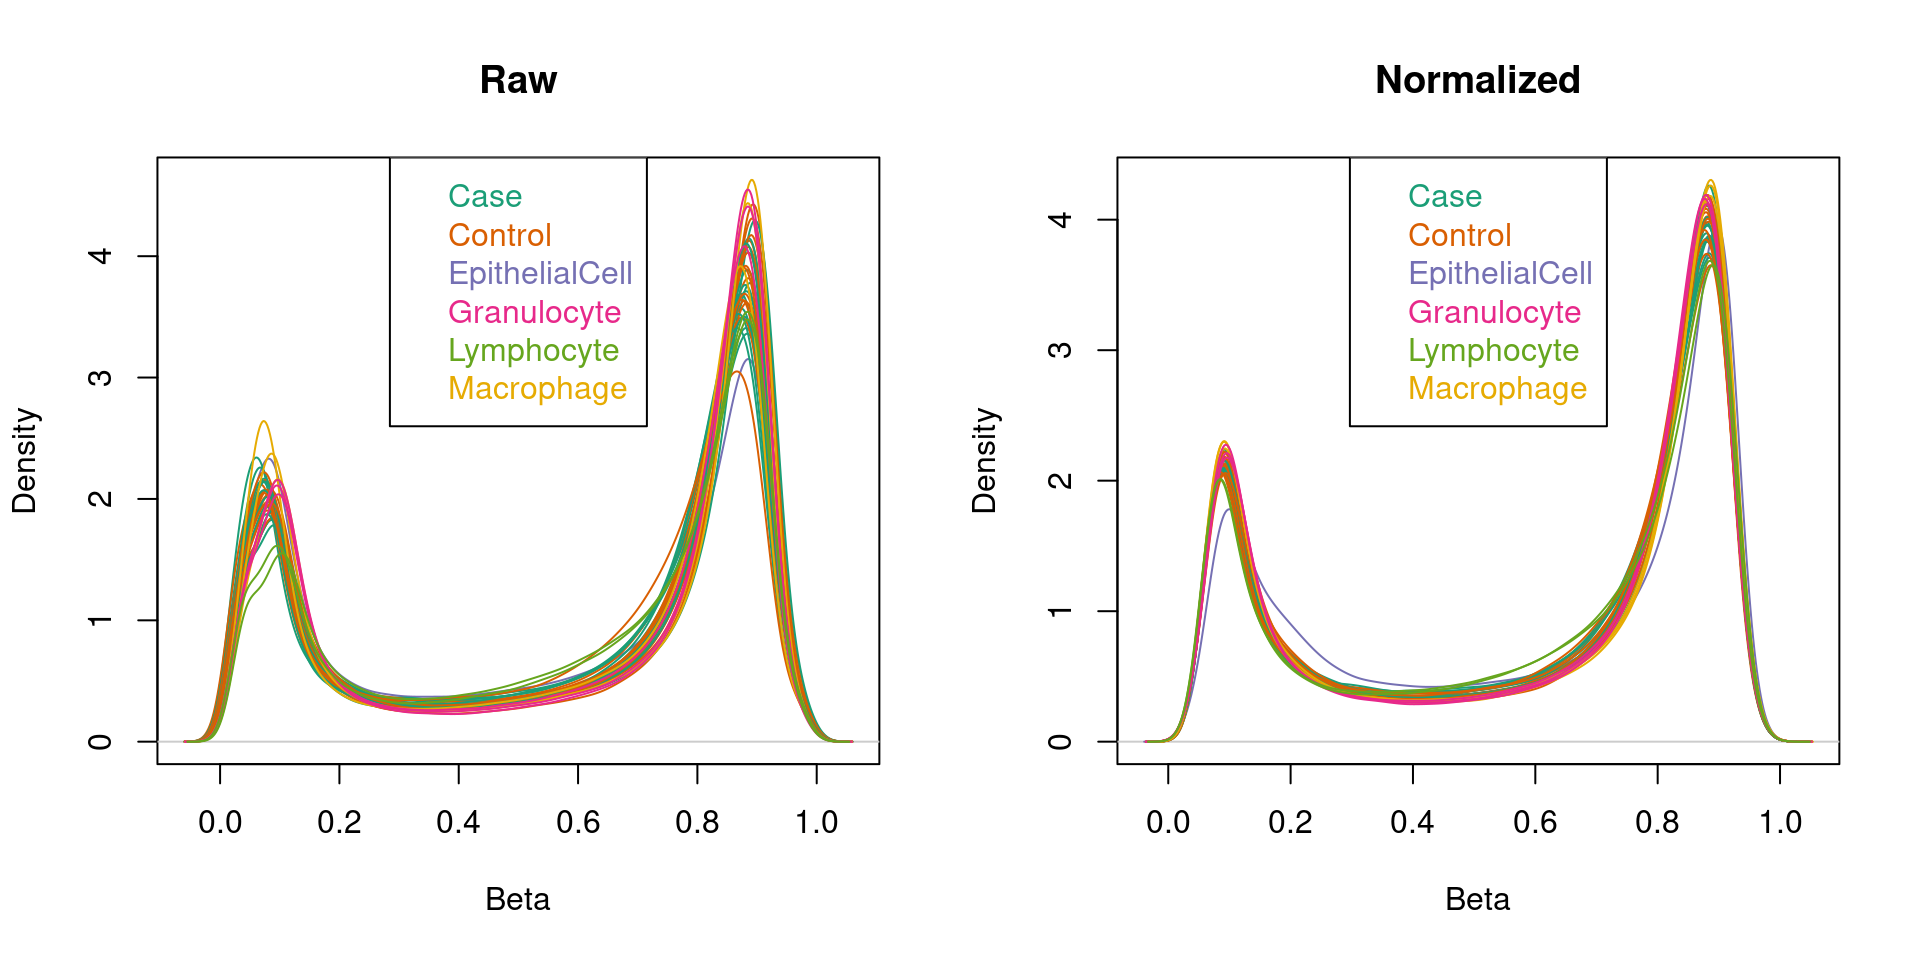
| Version | Author | Date |
|---|---|---|
| 02bf97c | Jovana Maksimovic | 2020-03-16 |
Data exploration (before filtering)
Explore the data to look for any structure. When we colour ALL the samples by sample type and then by predicted sex, we can see that the largest source of variation is sex, which corresponds to the first principal component.
# DATA EXPLORATION
mDat <- getM(mSetSq)
# MDS plots to look at largest sources of variation
par(mfrow=c(1,2))
plotMDS(mDat, top=1000, gene.selection="common",
        col=pal[factor(targets$Sample_Group)],pch=19)
legend("topleft", legend=levels(factor(targets$Sample_Group)), text.col=pal,
       bg="white", cex=0.7)

sex <- getSex(mSetSq)
Warning in .getSex(CN = CN, xIndex = xIndex, yIndex = yIndex, cutoff = cutoff):
An inconsistency was encountered while determining sex. One possibility is
that only one sex is present. We recommend further checks, for example with the
plotSex function.plotMDS(mDat, top=1000, gene.selection="common",
col=pal[factor(sex$predictedSex)],pch=19)
legend("topleft", legend=levels(factor(sex$predictedSex)), text.col=pal,
bg="white", cex=0.7)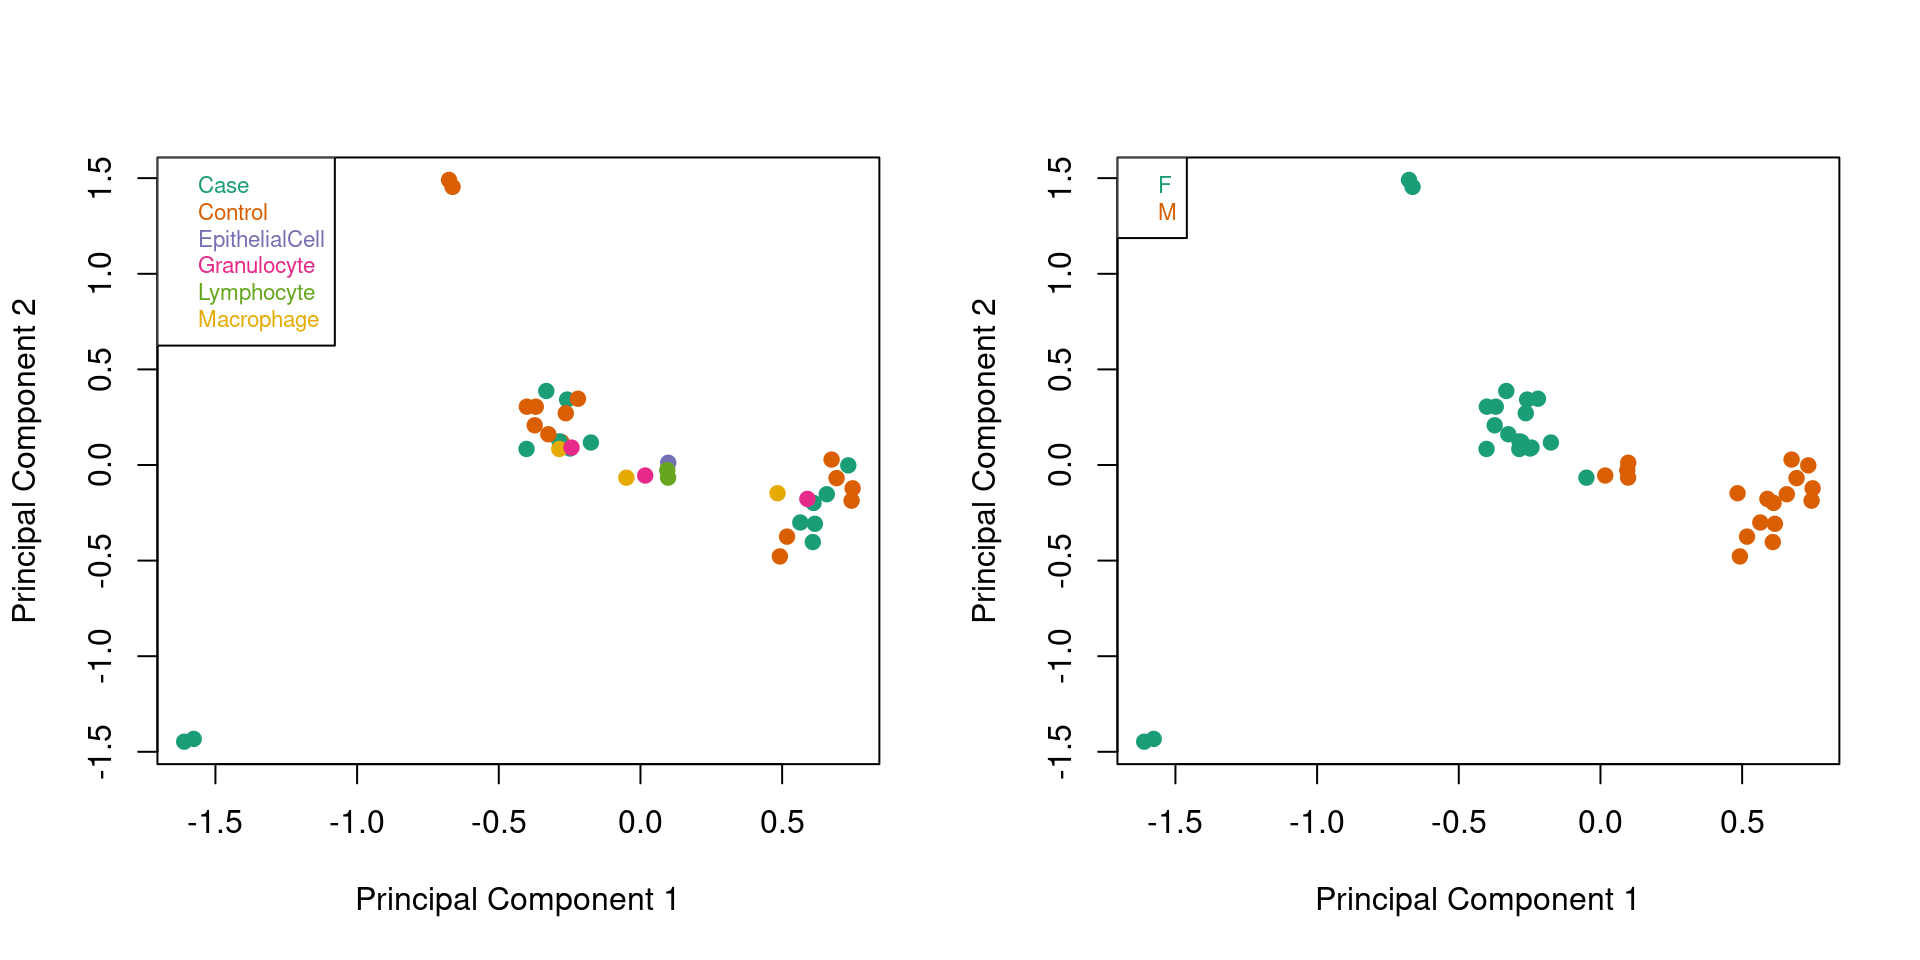
| Version | Author | Date |
|---|---|---|
| 02bf97c | Jovana Maksimovic | 2020-03-16 |
When we colour ONLY the patient samples by sex and disease status, a clear separation by sex in principal component one can been seen.
par(mfrow=c(1,2))
patients <- targets$Sample_Group %in% c("Case","Control")
mDat <- getM(mSetSq[,patients])

plotMDS(mDat, top=1000, gene.selection="common",
        col=pal[factor(sex$predictedSex[patients])],pch=19)
legend("topright", legend=levels(factor(sex$predictedSex[patients])), text.col=pal,
       bg="white", cex=0.7)

plotMDS(mDat, top=1000, gene.selection="common",
        col=pal[factor(targets$Sample_Group[patients])],pch=19)
legend("topright", legend=levels(factor(targets$Sample_Group[patients])), text.col=pal,
       bg="white", cex=0.7)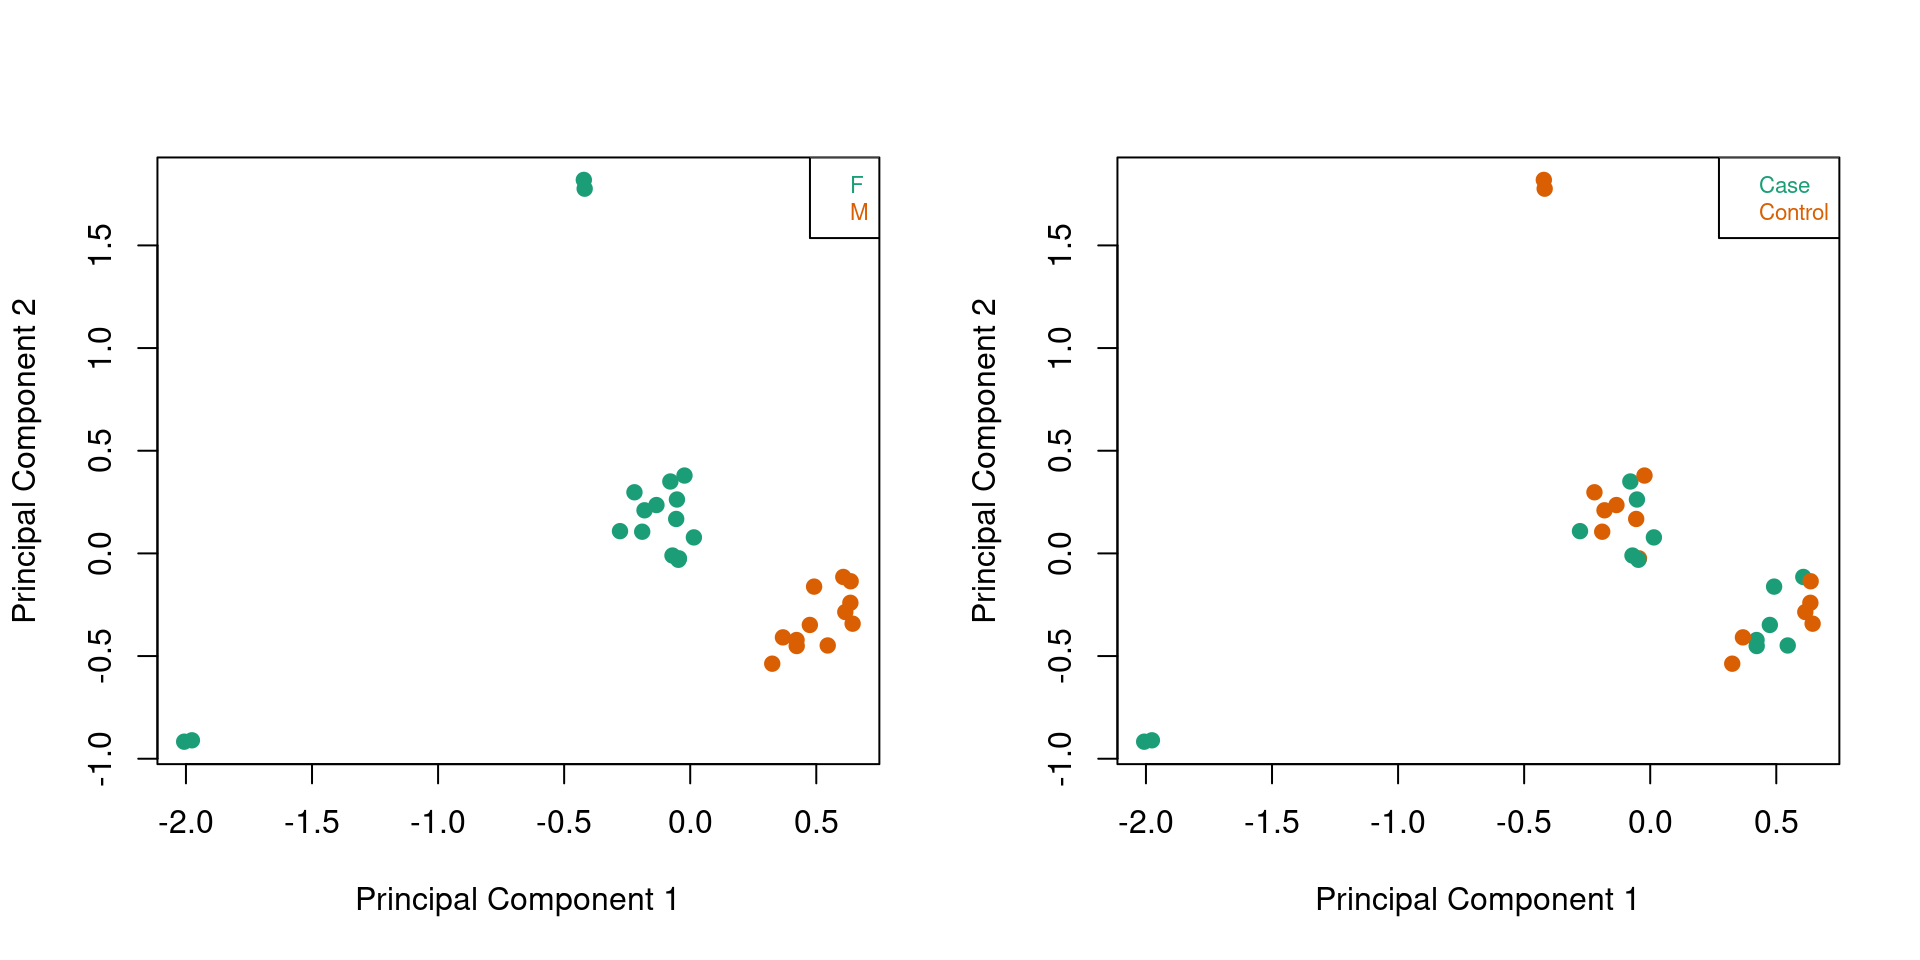
| Version | Author | Date |
|---|---|---|
| 02bf97c | Jovana Maksimovic | 2020-03-16 |
Examine the top 4 principal componets for obvious sources of variation. ALL samples are coloured by type. No clear pattern is emerging at this stage.
# Examine higher dimensions to look at other sources of variation
par(mfrow=c(1,3))
mDat <- getM(mSetSq)

plotMDS(mDat, top=1000, gene.selection="common",
        col=pal[factor(targets$Sample_Group)], dim=c(1,3),pch=19)
legend("topright", legend=levels(factor(targets$Sample_Group)), text.col=pal,
       cex=0.7, bg="white")
plotMDS(mDat, top=1000, gene.selection="common",
        col=pal[factor(targets$Sample_Group)], dim=c(2,3),pch=19)
legend("topright", legend=levels(factor(targets$Sample_Group)), text.col=pal,
       cex=0.7, bg="white")
plotMDS(mDat, top=1000, gene.selection="common",
        col=pal[factor(targets$Sample_Group)], dim=c(3,4),pch=19)
legend("topright", legend=levels(factor(targets$Sample_Group)), text.col=pal,
       cex=0.7, bg="white")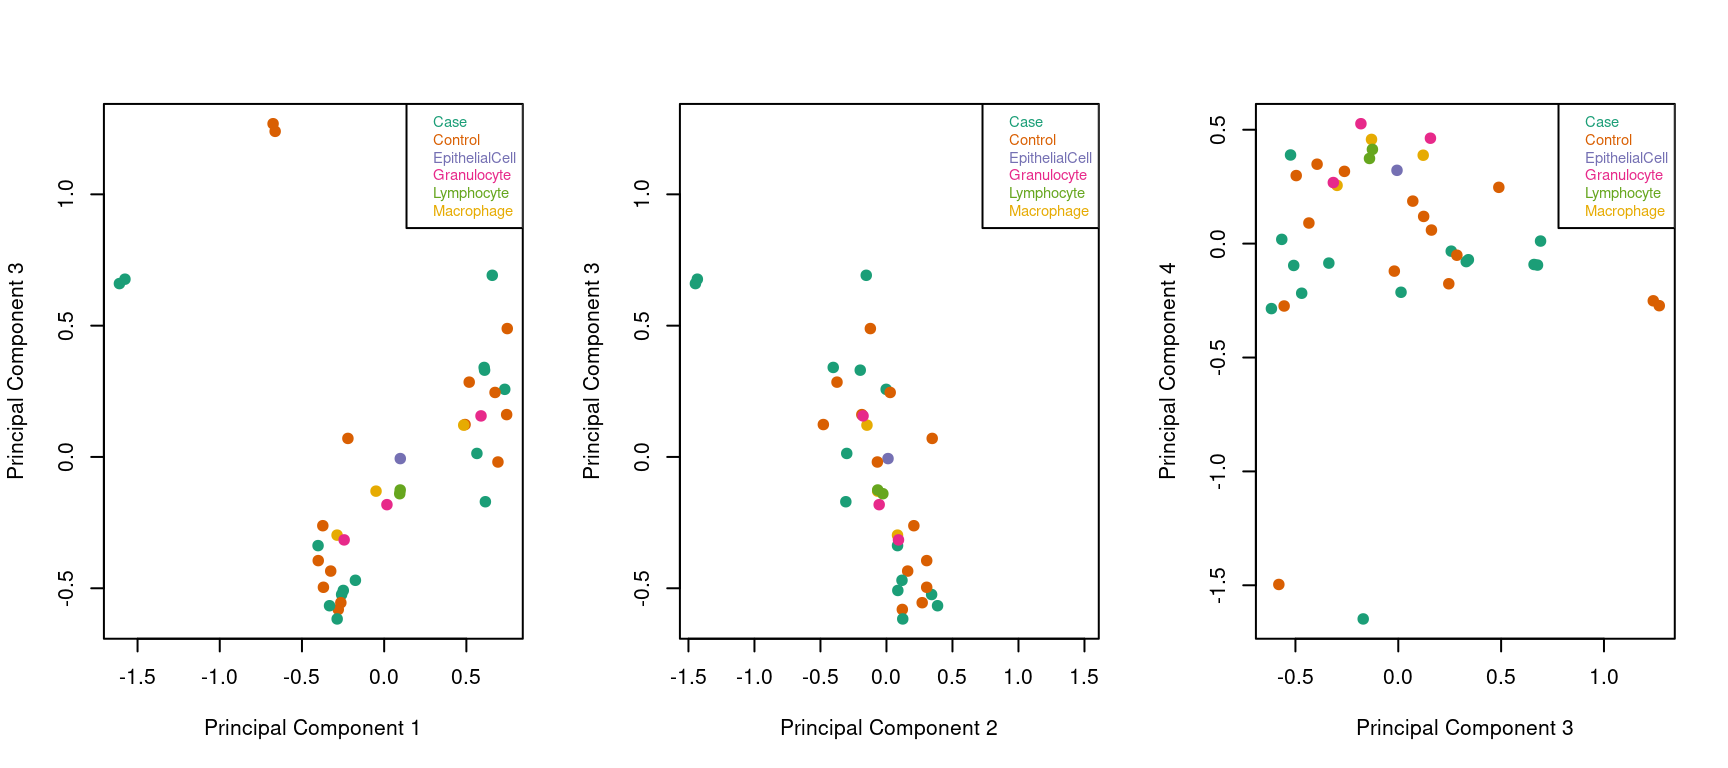
| Version | Author | Date |
|---|---|---|
| 02bf97c | Jovana Maksimovic | 2020-03-16 |
Look at only the sorted cells samples, coloured by predicted sex and cell type. As expected, the samples cluster nicely by cell type.
cells <- !targets$Sample_Group %in% c("Case","Control")
mDat <- getM(mSetSq[,cells])
par(mfrow=c(1,2))
plotMDS(mDat, top=1000, gene.selection="common",
        col=pal[factor(sex$predictedSex[cells])],pch=19)
legend("topright", legend=levels(factor(sex$predictedSex[cells])), text.col=pal,
       bg="white", cex=0.7)

plotMDS(mDat, top=1000, gene.selection="common",
        col=pal[factor(targets$Sample_Group[cells])],pch=19)
legend("topright", legend=levels(factor(targets$Sample_Group[cells])), text.col=pal,
       bg="white", cex=0.7)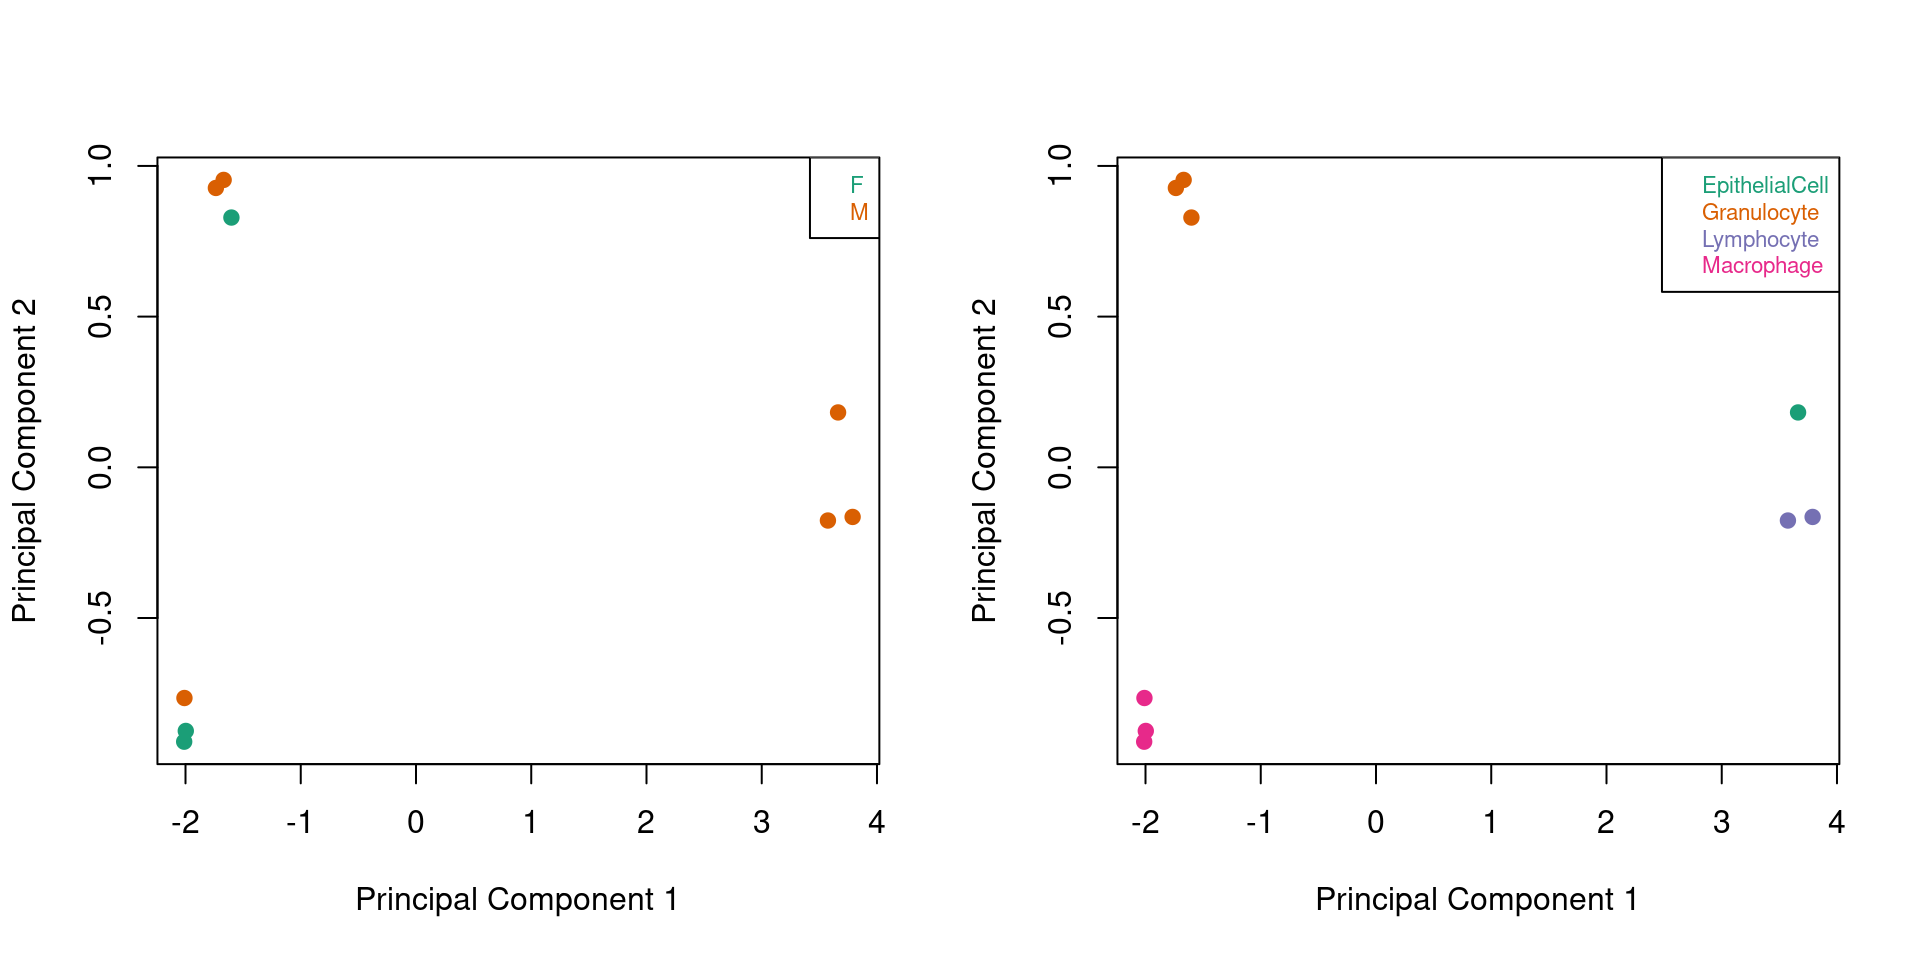
| Version | Author | Date |
|---|---|---|
| 02bf97c | Jovana Maksimovic | 2020-03-16 |
Filtering
Filter out poor performing probes, sex chromosome probes, SNP probes and cross reactive probes.
# Filtering
# ensure probes are in the same order in the mSetSq and detP objects
detP <- detP[match(featureNames(mSetSq),rownames(detP)),]

# remove any probes that have failed in one or more samples
keep <- rowSums(detP < 0.01) == ncol(mSetSq)
table(keep)
keep
FALSE TRUE
3988 861871 # subset data
mSetSqFlt <- mSetSq[keep,]
mSetSqFltclass: GenomicRatioSet
dim: 861871 38
metadata(0):
assays(2): M CN
rownames(861871): cg14817997 cg26928153 ... cg07587934 cg16855331
rowData names(0):
colnames(38): EpithelialCell.103516-001-002 Case.103516-001-003 ...
Lymphocyte.103516-001-039 Lymphocyte.103516-001-040
colData names(13): Sample_Name Sample_Well ... yMed predictedSex
Annotation
array: IlluminaHumanMethylationEPIC
annotation: ilm10b4.hg19
Preprocessing
Method: Raw (no normalization or bg correction)
minfi version: 1.32.0
Manifest version: 0.3.0# if your data includes males and females, remove probes on the sex chromosomes
keep <- !(featureNames(mSetSqFlt) %in% annEPIC$Name[annEPIC$chr %in% c("chrX","chrY")])
table(keep)keep
FALSE TRUE
19149 842722 mSetSqFlt <- mSetSqFlt[keep,]
# remove probes with SNPs at CpG site
mSetSqFlt <- dropLociWithSnps(mSetSqFlt)
mSetSqFltclass: GenomicRatioSet
dim: 814007 38
metadata(0):
assays(2): M CN
rownames(814007): cg14817997 cg26928153 ... cg07660283 cg09226288
rowData names(0):
colnames(38): EpithelialCell.103516-001-002 Case.103516-001-003 ...
Lymphocyte.103516-001-039 Lymphocyte.103516-001-040
colData names(13): Sample_Name Sample_Well ... yMed predictedSex
Annotation
array: IlluminaHumanMethylationEPIC
annotation: ilm10b4.hg19
Preprocessing
Method: Raw (no normalization or bg correction)
minfi version: 1.32.0
Manifest version: 0.3.0# exclude cross reactive probes
xReactiveProbes <- read.csv(file=paste(dataDirectory,
"Cross Reactive Probes EPIC array.txt",
sep="/"), stringsAsFactors=FALSE, header = FALSE)
keep <- !(featureNames(mSetSqFlt) %in% xReactiveProbes$V1)
table(keep)keep
FALSE TRUE
38839 775168 mSetSqFlt <- mSetSqFlt[keep,]
mSetSqFltclass: GenomicRatioSet
dim: 775168 38
metadata(0):
assays(2): M CN
rownames(775168): cg26928153 cg16269199 ... cg19565306 cg09226288
rowData names(0):
colnames(38): EpithelialCell.103516-001-002 Case.103516-001-003 ...
Lymphocyte.103516-001-039 Lymphocyte.103516-001-040
colData names(13): Sample_Name Sample_Well ... yMed predictedSex
Annotation
array: IlluminaHumanMethylationEPIC
annotation: ilm10b4.hg19
Preprocessing
Method: Raw (no normalization or bg correction)
minfi version: 1.32.0
Manifest version: 0.3.0Calculate M and beta values for downstream use in analysis and visulalisation.
# calculate M-values and beta values for downstream analysis and visualisation
mVals <- getM(mSetSqFlt)
head(mVals[,1:5])
EpithelialCell.103516-001-002 Case.103516-001-003
cg26928153 2.69274029 2.6252647
cg16269199 1.80696522 1.6163797
cg13869341 2.82147909 2.7826519
cg24669183 2.04801653 2.1212532
cg26679879 -0.53550078 -0.8716944
cg22519184 -0.06306404 -0.4739589
Control.103516-001-004 Case.103516-001-005 Control.103516-001-006
cg26928153 2.5794908 2.4622957 2.4280392
cg16269199 1.8007141 1.7352034 1.5535003
cg13869341 2.9804261 2.1558786 2.0769147
cg24669183 2.0591847 1.8864816 2.0036839
cg26679879 -0.4400872 -0.9114735 -0.9197778
cg22519184 -0.2618356 -0.2399486 -0.3174489bVals <- getBeta(mSetSqFlt)
head(bVals[,1:5]) EpithelialCell.103516-001-002 Case.103516-001-003
cg26928153 0.8660488 0.8605295
cg16269199 0.7777311 0.7540609
cg13869341 0.8760669 0.8731151
cg24669183 0.8052721 0.8131092
cg26679879 0.4082557 0.3533805
cg22519184 0.4890736 0.4186000
Control.103516-001-004 Case.103516-001-005 Control.103516-001-006
cg26928153 0.8566778 0.8464121 0.8432999
cg16269199 0.7769812 0.7690139 0.7458888
cg13869341 0.8875418 0.8167290 0.8083939
cg24669183 0.8064831 0.7871129 0.8004082
cg26679879 0.4243246 0.3471058 0.3458025
cg22519184 0.4547515 0.4585157 0.4452112Plot the distributions of the M and beta values.
par(mfrow=c(1,2))
densityPlot(bVals, sampGroups=targets$Sample_Group, main="Beta values",
            legend=FALSE, xlab="Beta values")
legend("top", legend = levels(factor(targets$Sample_Group)),
       text.col=brewer.pal(8,"Dark2"))
densityPlot(mVals, sampGroups=targets$Sample_Group, main="M-values",
            legend=FALSE, xlab="M values")
legend("topleft", legend = levels(factor(targets$Sample_Group)),
       text.col=brewer.pal(8,"Dark2"))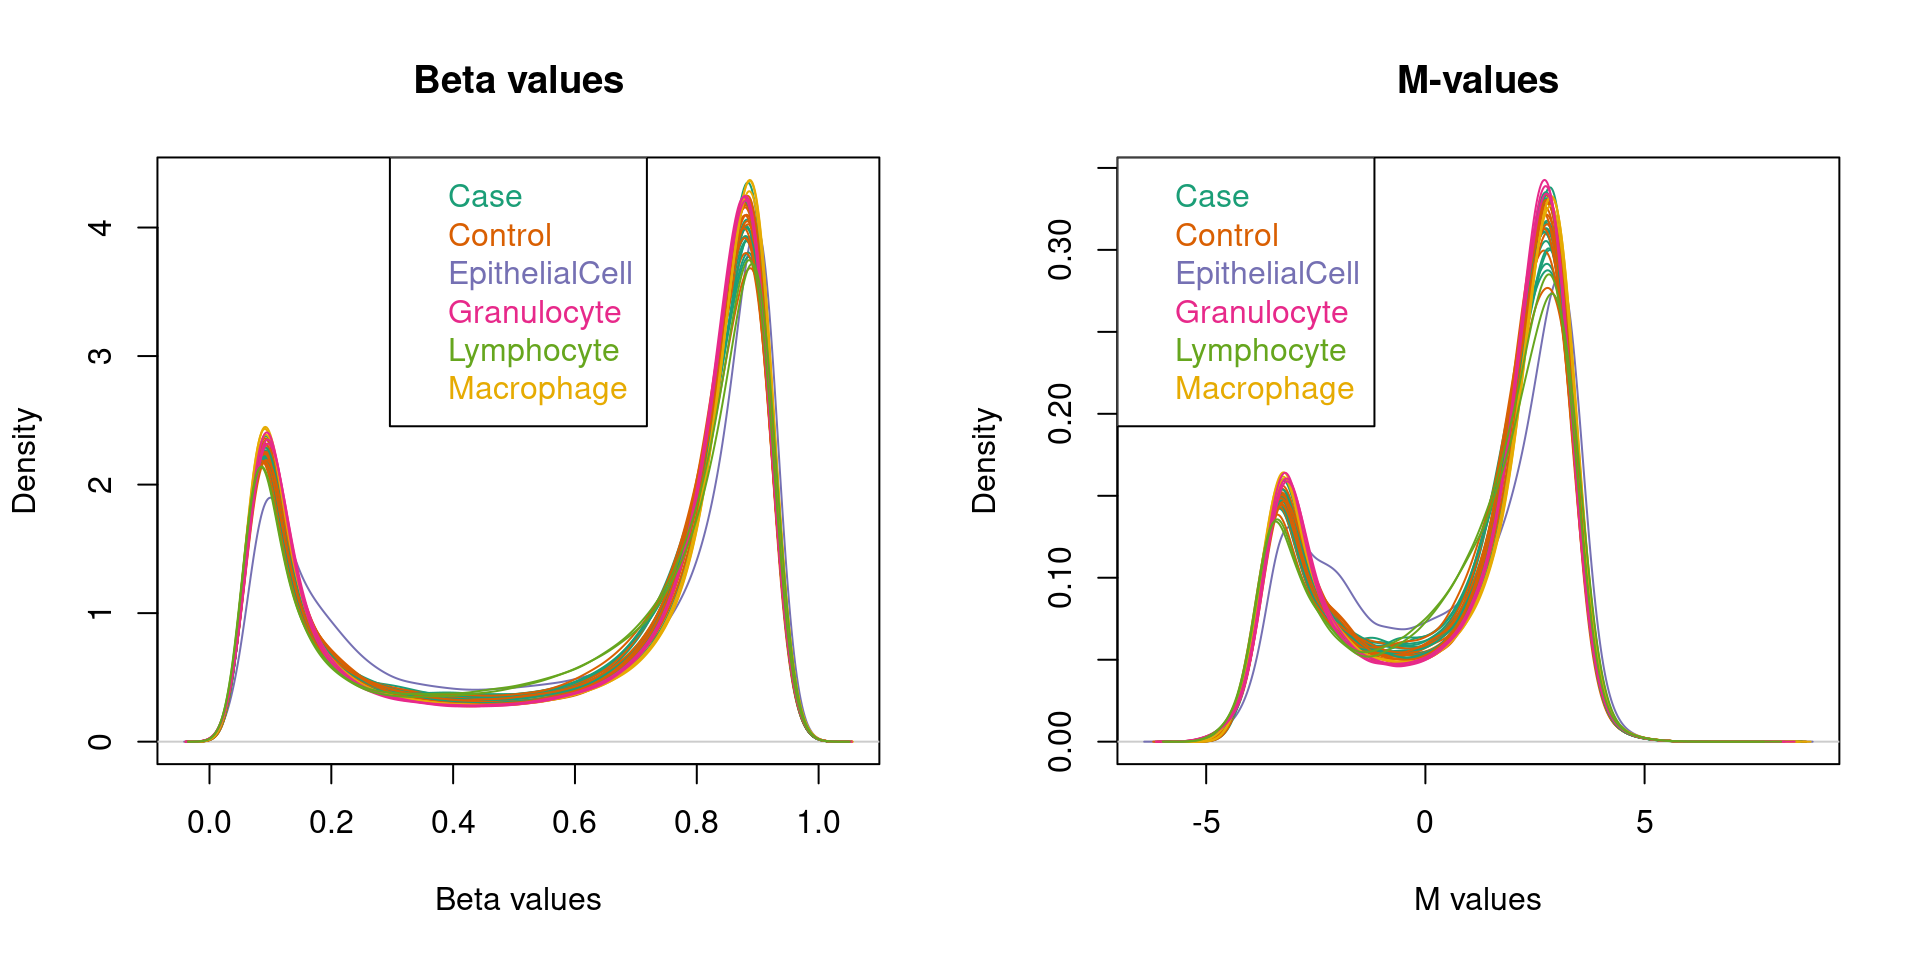
| Version | Author | Date |
|---|---|---|
| 02bf97c | Jovana Maksimovic | 2020-03-16 |
Data exploration (after filtering)
Look at the largest sources of variation in the data after filtering. When ALL samples are coloured by type and by sex we now much clearer clustering of the sorted cell samples and patient samples. The control samples appear to be clustering towards the granulocyte samples suggesting that they may be dominated by that cell type. We no longer see any evidence of clustering by sex. The first principal component appears to be capturing the differences between macrophages, granulocytes and lymphocytes whilst the second appears to be largely the difference between granulocytes and the other cell types.
# MDS plots to look at largest sources of variation
par(mfrow=c(1,2))
plotMDS(mVals, top=1000, gene.selection="common",
        col=pal[factor(targets$Sample_Group)],pch=19)
legend("bottomleft", legend=levels(factor(targets$Sample_Group)), text.col=pal,
       bg="white", cex=0.7)

plotMDS(mVals, top=1000, gene.selection="common",
        col=pal[factor(sex$predictedSex)],pch=19)
legend("bottomleft", legend=levels(factor(sex$predictedSex)), text.col=pal,
       bg="white", cex=0.7)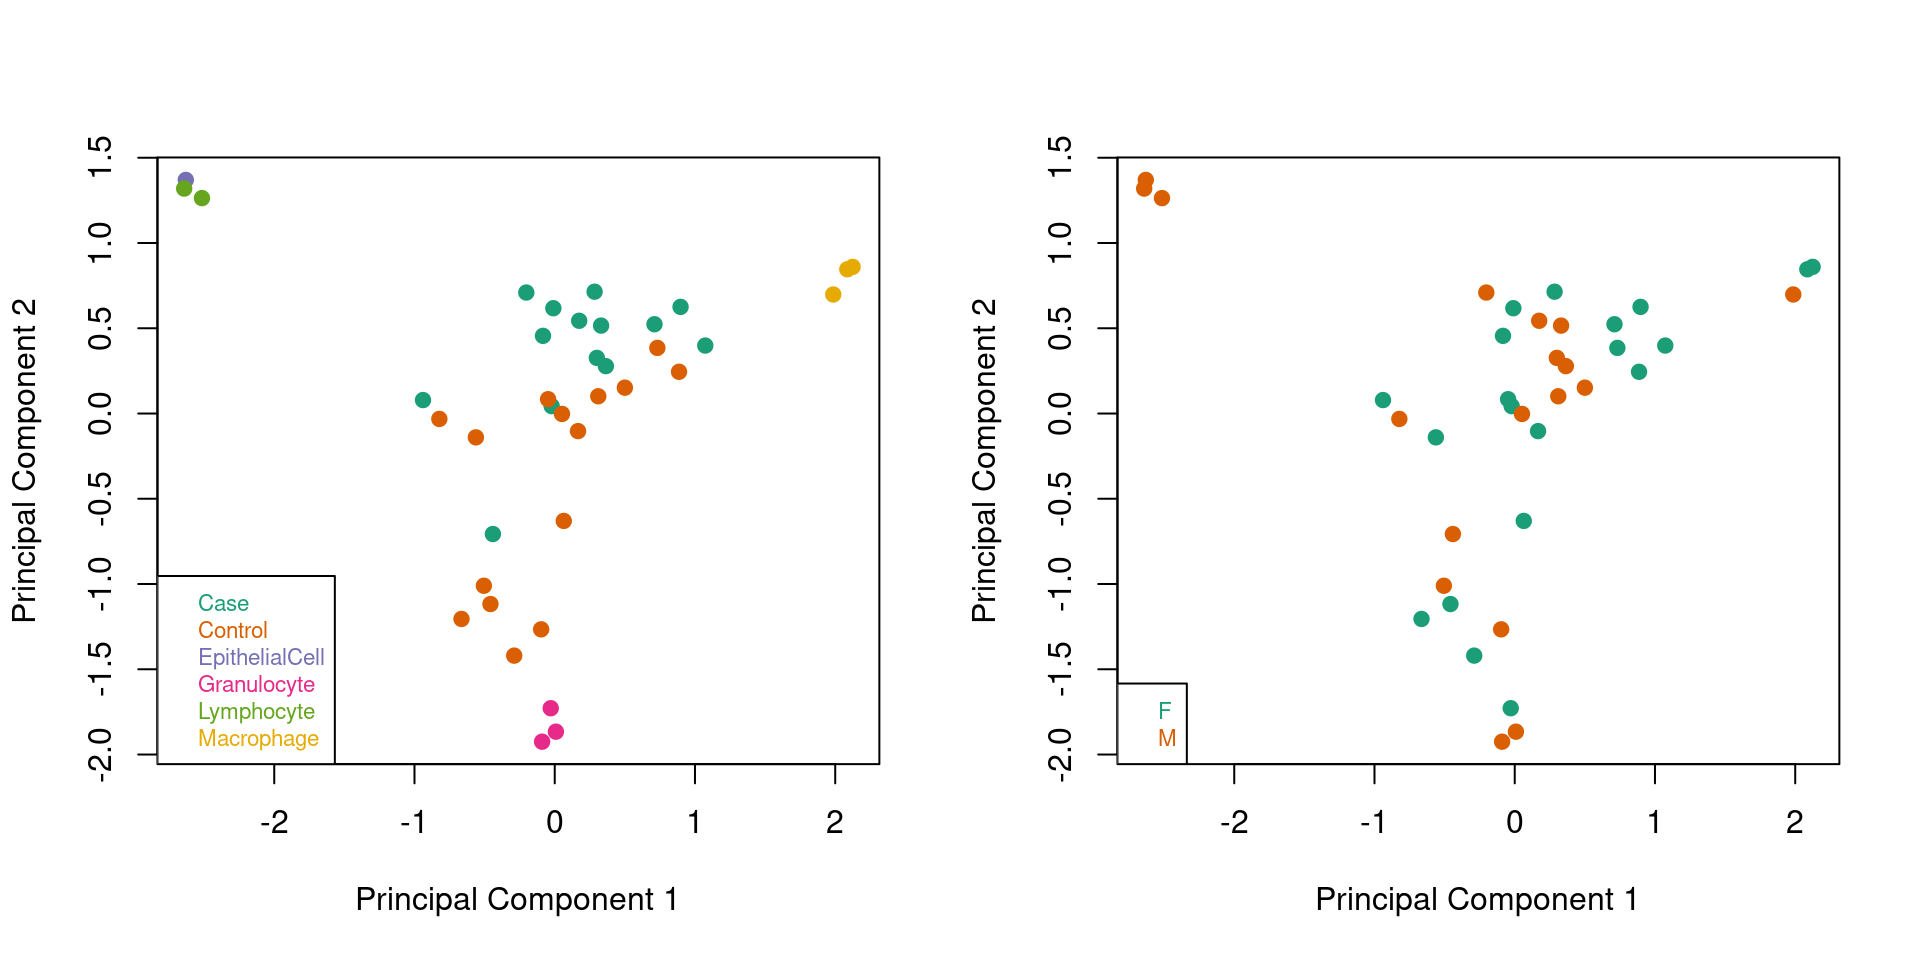
| Version | Author | Date |
|---|---|---|
| 02bf97c | Jovana Maksimovic | 2020-03-16 |
Looking at only the patient samples, we no longer see any clustering by sex although there is evidence of some separation of the case and control samples in the first principle component although it is not clear cut.
par(mfrow=c(1,2))
plotMDS(mVals[,patients], top=1000, gene.selection="common",
        col=pal[factor(sex$predictedSex[patients])],pch=19)
legend("topright", legend=levels(factor(sex$predictedSex[patients])), text.col=pal,
       bg="white", cex=0.7)

plotMDS(mVals[,patients], top=1000, gene.selection="common",
        col=pal[factor(targets$Sample_Group[patients])],pch=19)
legend("topright", legend=levels(factor(targets$Sample_Group[patients])), text.col=pal,
       bg="white", cex=0.7)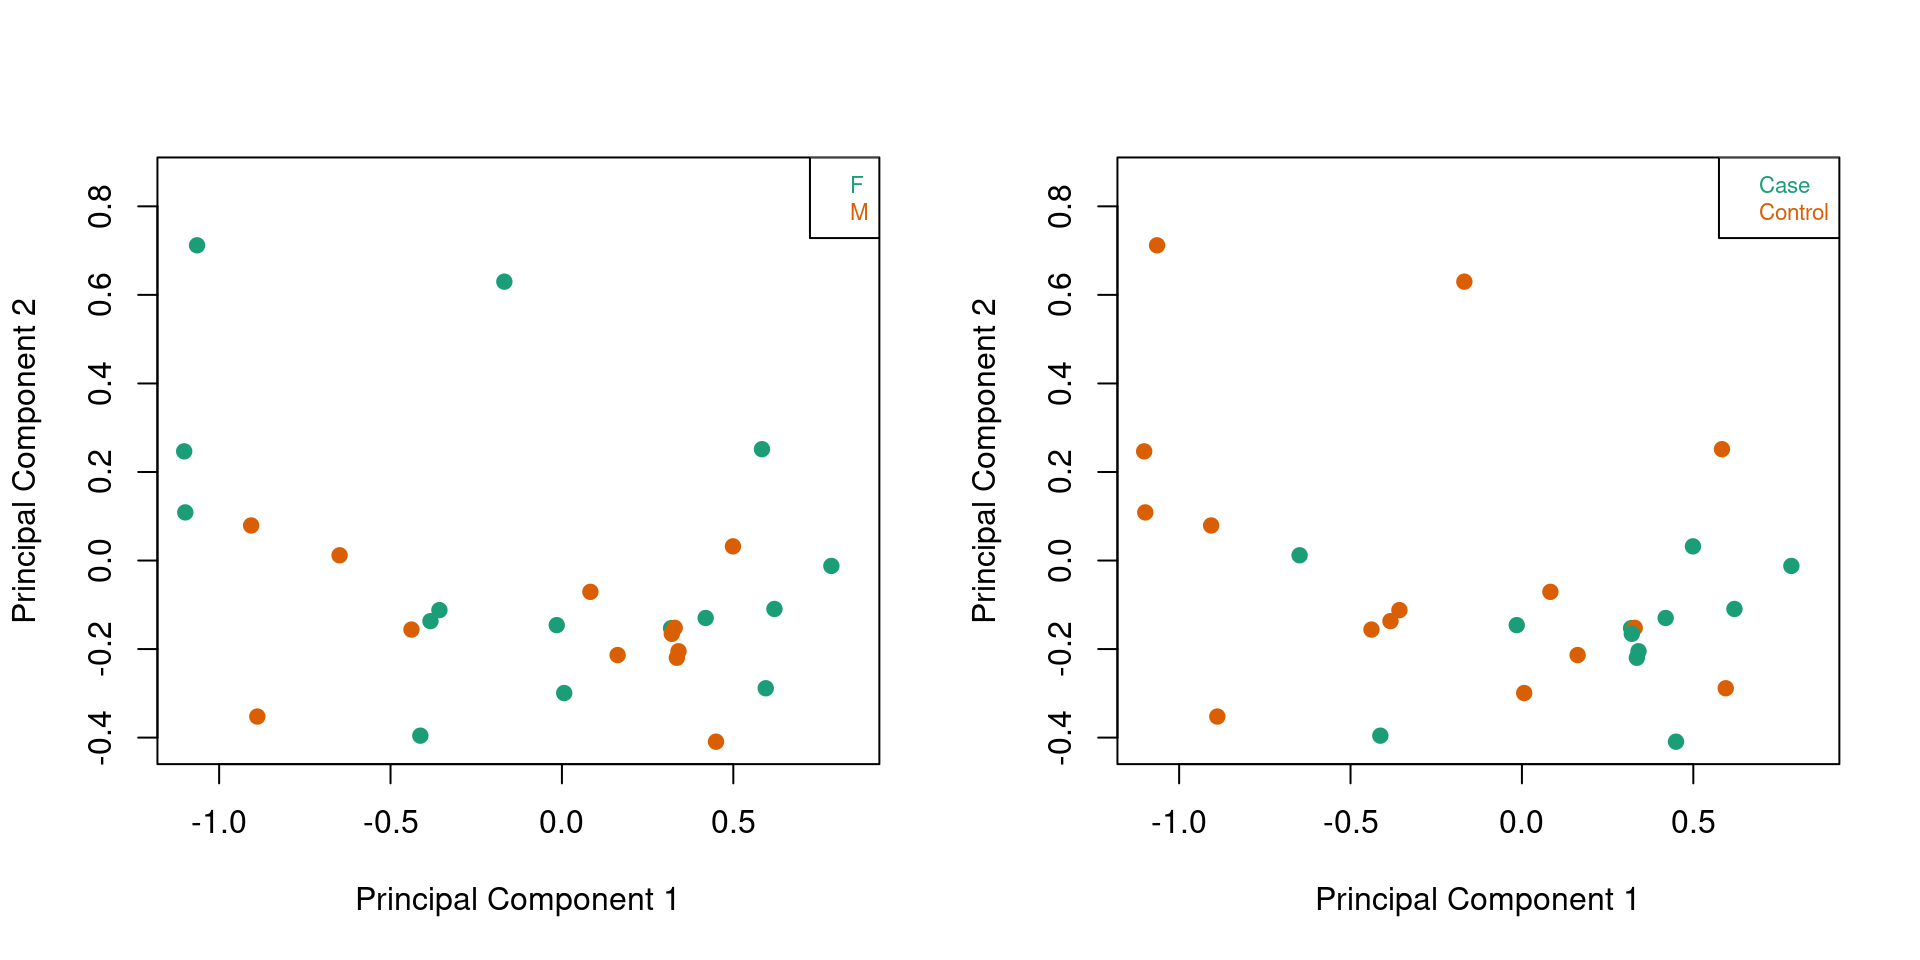
| Version | Author | Date |
|---|---|---|
| 02bf97c | Jovana Maksimovic | 2020-03-16 |
Looking at the top 4 principal components with ALL the samples indicates that they are dominated by the differences between the sorted cell types.
# Examine higher dimensions to look at other sources of variation
par(mfrow=c(1,3))
plotMDS(mVals, top=1000, gene.selection="common",
        col=pal[factor(targets$Sample_Group)], dim=c(1,3),pch=19)
legend("topright", legend=levels(factor(targets$Sample_Group)), text.col=pal,
       cex=0.7, bg="white")
plotMDS(mVals, top=1000, gene.selection="common",
        col=pal[factor(targets$Sample_Group)], dim=c(2,3),pch=19)
legend("topleft", legend=levels(factor(targets$Sample_Group)), text.col=pal,
       cex=0.7, bg="white")
plotMDS(mVals, top=1000, gene.selection="common",
        col=pal[factor(targets$Sample_Group)], dim=c(3,4),pch=19)
legend("bottomright", legend=levels(factor(targets$Sample_Group)), text.col=pal,
       cex=0.7, bg="white")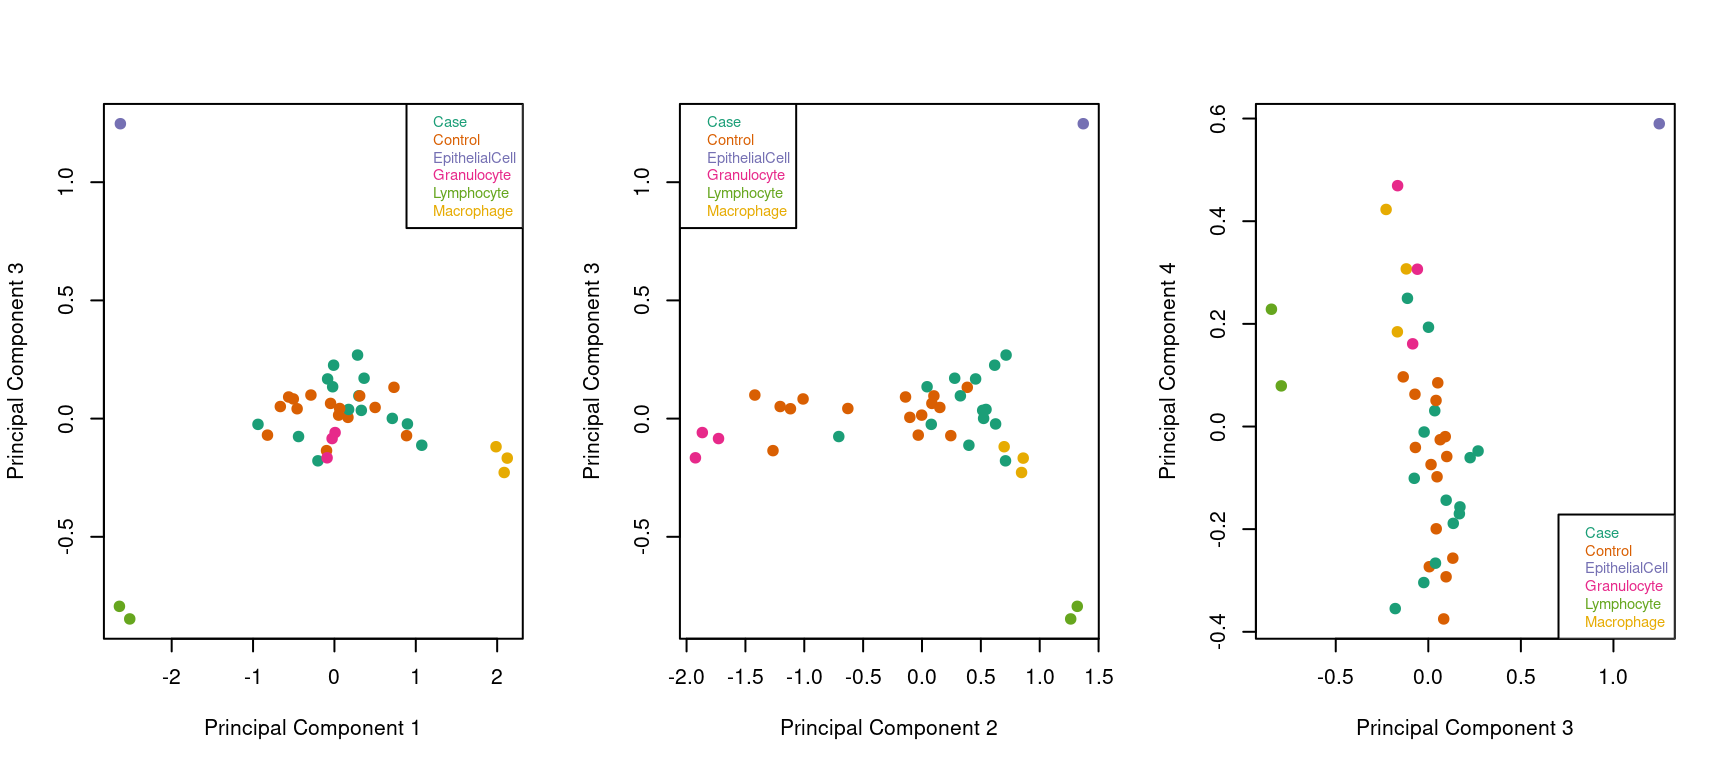
| Version | Author | Date |
|---|---|---|
| 02bf97c | Jovana Maksimovic | 2020-03-16 |
When we look at ONLY the sorted cell samples, there is still very clear clustering by cell type and no evidence of clustering by sex.
par(mfrow=c(1,2))
plotMDS(mVals[,cells], top=1000, gene.selection="common",
        col=pal[factor(sex$predictedSex[cells])],pch=19)
legend("topright", legend=levels(factor(sex$predictedSex[cells])), text.col=pal,
       bg="white", cex=0.7)

plotMDS(mVals[,cells], top=1000, gene.selection="common",
        col=pal[factor(targets$Sample_Group[cells])],pch=19)
legend("topright", legend=levels(factor(targets$Sample_Group[cells])), text.col=pal,
       bg="white", cex=0.7)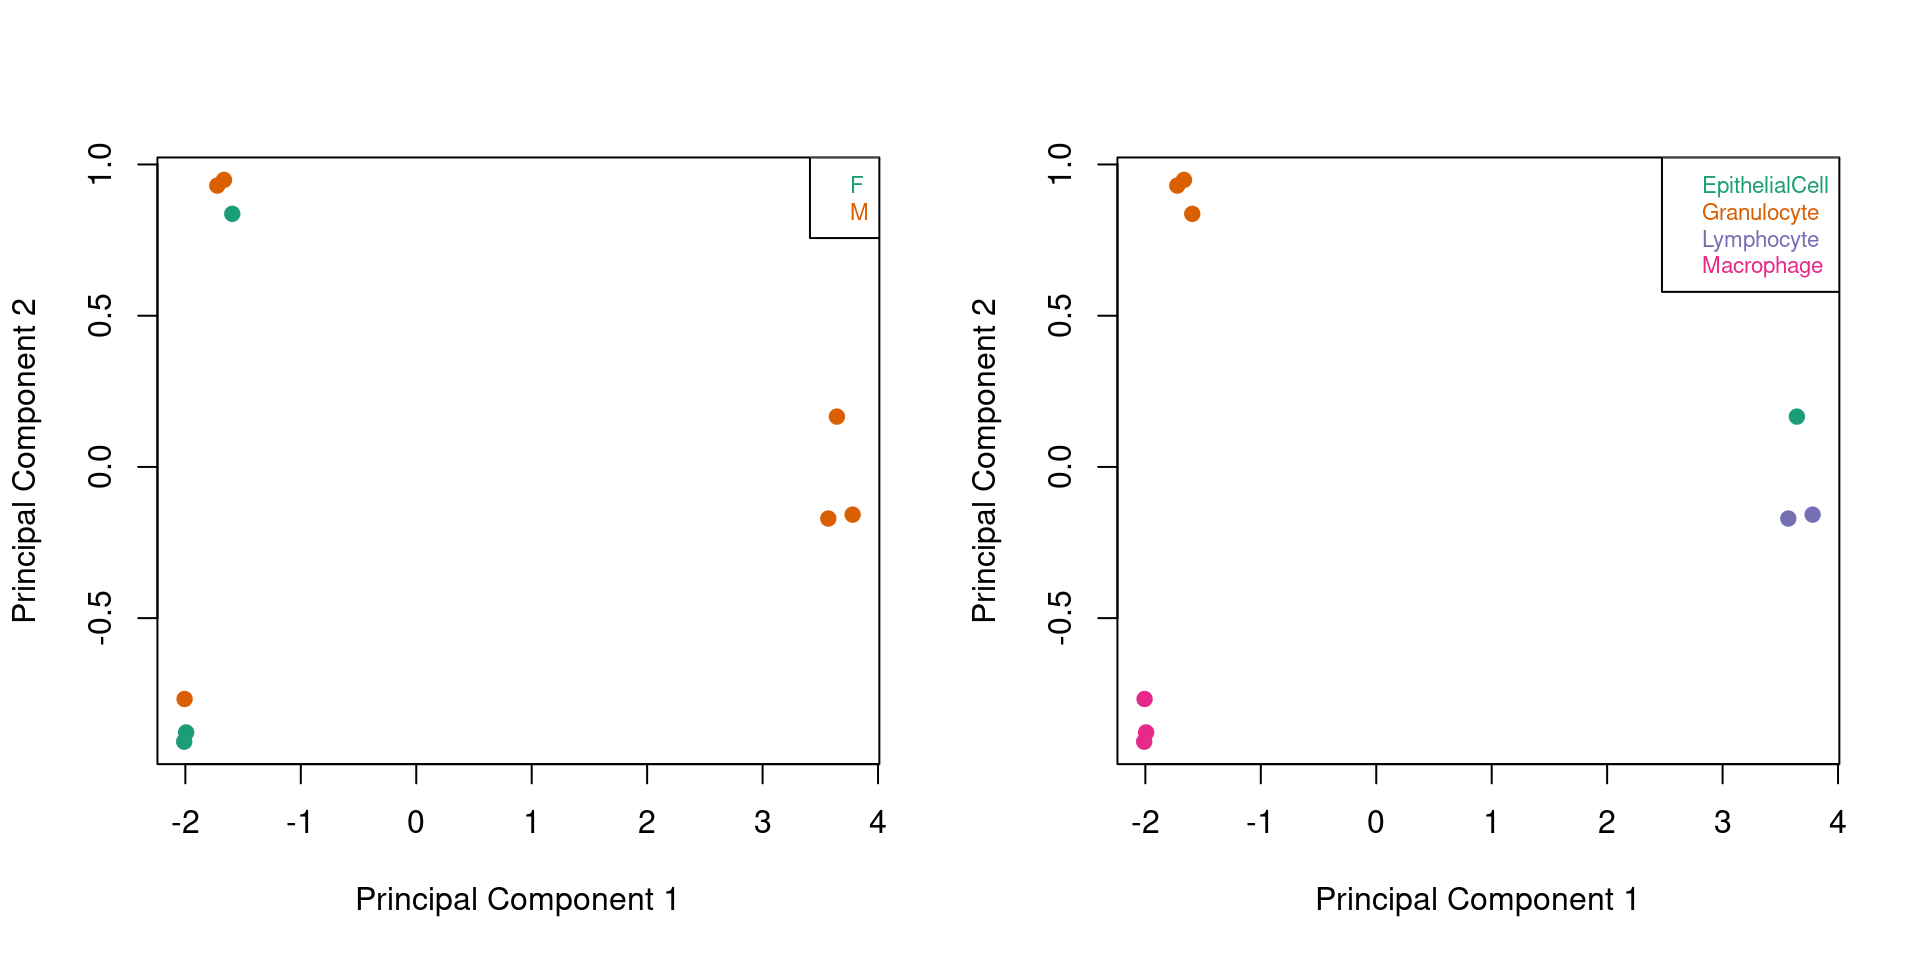
| Version | Author | Date |
|---|---|---|
| 02bf97c | Jovana Maksimovic | 2020-03-16 |
The data appears to be of good quality and shows no eivdence of unusual sources of variation. Save the various data objects for faster downstream analysis.
save(annEPIC, mSetSqFlt, rgSet, mVals, bVals, targets,
pal, sex, patients, cells, file = here("data/idat/processedData.RData"))sessionInfo()R version 3.6.1 (2019-07-05)
Platform: x86_64-pc-linux-gnu (64-bit)
Running under: CentOS Linux 7 (Core)
Matrix products: default
BLAS: /config/RStudio/R/3.6.1/lib64/R/lib/libRblas.so
LAPACK: /config/RStudio/R/3.6.1/lib64/R/lib/libRlapack.so
locale:
[1] LC_CTYPE=en_AU.UTF-8 LC_NUMERIC=C
[3] LC_TIME=en_AU.UTF-8 LC_COLLATE=en_AU.UTF-8
[5] LC_MONETARY=en_AU.UTF-8 LC_MESSAGES=en_AU.UTF-8
[7] LC_PAPER=en_AU.UTF-8 LC_NAME=C
[9] LC_ADDRESS=C LC_TELEPHONE=C
[11] LC_MEASUREMENT=en_AU.UTF-8 LC_IDENTIFICATION=C
attached base packages:
[1] grid stats4 parallel stats graphics grDevices utils
[8] datasets methods base
other attached packages:
[1] IlluminaHumanMethylationEPICmanifest_0.3.0
[2] IlluminaHumanMethylationEPICanno.ilm10b4.hg19_0.6.0
[3] stringr_1.4.0
[4] DMRcate_2.0.7
[5] Gviz_1.28.3
[6] minfiData_0.32.0
[7] IlluminaHumanMethylation450kanno.ilmn12.hg19_0.6.0
[8] IlluminaHumanMethylation450kmanifest_0.4.0
[9] missMethyl_1.20.4
[10] RColorBrewer_1.1-2
[11] minfi_1.32.0
[12] bumphunter_1.26.0
[13] locfit_1.5-9.1
[14] iterators_1.0.12
[15] foreach_1.4.8
[16] Biostrings_2.54.0
[17] XVector_0.24.0
[18] SummarizedExperiment_1.16.1
[19] DelayedArray_0.12.2
[20] BiocParallel_1.20.1
[21] matrixStats_0.56.0
[22] Biobase_2.46.0
[23] GenomicRanges_1.36.1
[24] GenomeInfoDb_1.22.0
[25] IRanges_2.20.2
[26] S4Vectors_0.24.3
[27] BiocGenerics_0.32.0
[28] limma_3.42.2
[29] here_0.1
[30] workflowr_1.6.1
loaded via a namespace (and not attached):
[1] R.utils_2.9.0 tidyselect_0.2.5
[3] RSQLite_2.1.2 AnnotationDbi_1.46.1
[5] htmlwidgets_1.3 munsell_0.5.0
[7] codetools_0.2-16 preprocessCore_1.48.0
[9] statmod_1.4.32 withr_2.1.2
[11] colorspace_1.4-1 knitr_1.28
[13] rstudioapi_0.11 git2r_0.26.1
[15] GenomeInfoDbData_1.2.1 bit64_0.9-7
[17] rhdf5_2.28.0 rprojroot_1.3-2
[19] vctrs_0.2.4 xfun_0.12
[21] biovizBase_1.32.0 BiocFileCache_1.10.2
[23] R6_2.4.1 illuminaio_0.28.0
[25] AnnotationFilter_1.8.0 bitops_1.0-6
[27] reshape_0.8.8 assertthat_0.2.1
[29] promises_1.1.0 scales_1.1.0
[31] bsseq_1.22.0 nnet_7.3-12
[33] gtable_0.3.0 methylumi_2.30.0
[35] ensembldb_2.8.0 rlang_0.4.5
[37] genefilter_1.68.0 splines_3.6.1
[39] rtracklayer_1.44.4 lazyeval_0.2.2
[41] DSS_2.34.0 acepack_1.4.1
[43] GEOquery_2.54.1 dichromat_2.0-0
[45] checkmate_1.9.4 BiocManager_1.30.10
[47] yaml_2.2.1 GenomicFeatures_1.36.4
[49] backports_1.1.5 httpuv_1.5.2
[51] Hmisc_4.2-0 tools_3.6.1
[53] nor1mix_1.3-0 ggplot2_3.3.0
[55] siggenes_1.60.0 Rcpp_1.0.3
[57] plyr_1.8.6 base64enc_0.1-3
[59] progress_1.2.2 zlibbioc_1.30.0
[61] purrr_0.3.3 RCurl_1.95-4.12
[63] BiasedUrn_1.07 prettyunits_1.0.2
[65] rpart_4.1-15 openssl_1.4.1
[67] cluster_2.1.0 fs_1.3.2
[69] magrittr_1.5 data.table_1.12.8
[71] whisker_0.4 ProtGenerics_1.16.0
[73] mime_0.9 hms_0.5.3
[75] evaluate_0.14 xtable_1.8-4
[77] XML_3.98-1.20 mclust_5.4.5
[79] gridExtra_2.3 compiler_3.6.1
[81] biomaRt_2.42.0 tibble_2.1.3
[83] crayon_1.3.4 R.oo_1.22.0
[85] htmltools_0.4.0 later_1.0.0
[87] Formula_1.2-3 tidyr_1.0.2
[89] DBI_1.0.0 ExperimentHub_1.12.0
[91] dbplyr_1.4.2 MASS_7.3-51.5
[93] rappdirs_0.3.1 Matrix_1.2-18
[95] readr_1.3.1 permute_0.9-5
[97] R.methodsS3_1.7.1 quadprog_1.5-8
[99] pkgconfig_2.0.3 GenomicAlignments_1.20.1
[101] registry_0.5-1 foreign_0.8-72
[103] xml2_1.2.5 annotate_1.62.0
[105] rngtools_1.4 pkgmaker_0.27
[107] multtest_2.40.0 beanplot_1.2
[109] ruv_0.9.7.1 bibtex_0.4.2
[111] doRNG_1.7.1 scrime_1.3.5
[113] VariantAnnotation_1.30.1 digest_0.6.25
[115] rmarkdown_2.1 base64_2.0
[117] htmlTable_1.13.2 edgeR_3.26.8
[119] DelayedMatrixStats_1.8.0 curl_4.3
[121] shiny_1.3.2 gtools_3.8.1
[123] Rsamtools_2.0.1 lifecycle_0.2.0
[125] nlme_3.1-145 Rhdf5lib_1.6.1
[127] askpass_1.1 BSgenome_1.52.0
[129] pillar_1.4.3 lattice_0.20-40
[131] httr_1.4.1 survival_2.44-1.1
[133] GO.db_3.8.2 interactiveDisplayBase_1.22.0
[135] glue_1.3.2 BiocVersion_3.10.1
[137] bit_1.1-14 stringi_1.4.6
[139] HDF5Array_1.14.3 blob_1.2.0
[141] AnnotationHub_2.18.0 org.Hs.eg.db_3.8.2
[143] latticeExtra_0.6-28 memoise_1.1.0
[145] dplyr_0.8.3
sessionInfo()R version 3.6.1 (2019-07-05)
Platform: x86_64-pc-linux-gnu (64-bit)
Running under: CentOS Linux 7 (Core)
Matrix products: default
BLAS: /config/RStudio/R/3.6.1/lib64/R/lib/libRblas.so
LAPACK: /config/RStudio/R/3.6.1/lib64/R/lib/libRlapack.so
locale:
[1] LC_CTYPE=en_AU.UTF-8 LC_NUMERIC=C
[3] LC_TIME=en_AU.UTF-8 LC_COLLATE=en_AU.UTF-8
[5] LC_MONETARY=en_AU.UTF-8 LC_MESSAGES=en_AU.UTF-8
[7] LC_PAPER=en_AU.UTF-8 LC_NAME=C
[9] LC_ADDRESS=C LC_TELEPHONE=C
[11] LC_MEASUREMENT=en_AU.UTF-8 LC_IDENTIFICATION=C
attached base packages:
[1] grid stats4 parallel stats graphics grDevices utils
[8] datasets methods base
other attached packages:
[1] IlluminaHumanMethylationEPICmanifest_0.3.0
[2] IlluminaHumanMethylationEPICanno.ilm10b4.hg19_0.6.0
[3] stringr_1.4.0
[4] DMRcate_2.0.7
[5] Gviz_1.28.3
[6] minfiData_0.32.0
[7] IlluminaHumanMethylation450kanno.ilmn12.hg19_0.6.0
[8] IlluminaHumanMethylation450kmanifest_0.4.0
[9] missMethyl_1.20.4
[10] RColorBrewer_1.1-2
[11] minfi_1.32.0
[12] bumphunter_1.26.0
[13] locfit_1.5-9.1
[14] iterators_1.0.12
[15] foreach_1.4.8
[16] Biostrings_2.54.0
[17] XVector_0.24.0
[18] SummarizedExperiment_1.16.1
[19] DelayedArray_0.12.2
[20] BiocParallel_1.20.1
[21] matrixStats_0.56.0
[22] Biobase_2.46.0
[23] GenomicRanges_1.36.1
[24] GenomeInfoDb_1.22.0
[25] IRanges_2.20.2
[26] S4Vectors_0.24.3
[27] BiocGenerics_0.32.0
[28] limma_3.42.2
[29] here_0.1
[30] workflowr_1.6.1
loaded via a namespace (and not attached):
[1] R.utils_2.9.0 tidyselect_0.2.5
[3] RSQLite_2.1.2 AnnotationDbi_1.46.1
[5] htmlwidgets_1.3 munsell_0.5.0
[7] codetools_0.2-16 preprocessCore_1.48.0
[9] statmod_1.4.32 withr_2.1.2
[11] colorspace_1.4-1 knitr_1.28
[13] rstudioapi_0.11 git2r_0.26.1
[15] GenomeInfoDbData_1.2.1 bit64_0.9-7
[17] rhdf5_2.28.0 rprojroot_1.3-2
[19] vctrs_0.2.4 xfun_0.12
[21] biovizBase_1.32.0 BiocFileCache_1.10.2
[23] R6_2.4.1 illuminaio_0.28.0
[25] AnnotationFilter_1.8.0 bitops_1.0-6
[27] reshape_0.8.8 assertthat_0.2.1
[29] promises_1.1.0 scales_1.1.0
[31] bsseq_1.22.0 nnet_7.3-12
[33] gtable_0.3.0 methylumi_2.30.0
[35] ensembldb_2.8.0 rlang_0.4.5
[37] genefilter_1.68.0 splines_3.6.1
[39] rtracklayer_1.44.4 lazyeval_0.2.2
[41] DSS_2.34.0 acepack_1.4.1
[43] GEOquery_2.54.1 dichromat_2.0-0
[45] checkmate_1.9.4 BiocManager_1.30.10
[47] yaml_2.2.1 GenomicFeatures_1.36.4
[49] backports_1.1.5 httpuv_1.5.2
[51] Hmisc_4.2-0 tools_3.6.1
[53] nor1mix_1.3-0 ggplot2_3.3.0
[55] siggenes_1.60.0 Rcpp_1.0.3
[57] plyr_1.8.6 base64enc_0.1-3
[59] progress_1.2.2 zlibbioc_1.30.0
[61] purrr_0.3.3 RCurl_1.95-4.12
[63] BiasedUrn_1.07 prettyunits_1.0.2
[65] rpart_4.1-15 openssl_1.4.1
[67] cluster_2.1.0 fs_1.3.2
[69] magrittr_1.5 data.table_1.12.8
[71] whisker_0.4 ProtGenerics_1.16.0
[73] mime_0.9 hms_0.5.3
[75] evaluate_0.14 xtable_1.8-4
[77] XML_3.98-1.20 mclust_5.4.5
[79] gridExtra_2.3 compiler_3.6.1
[81] biomaRt_2.42.0 tibble_2.1.3
[83] crayon_1.3.4 R.oo_1.22.0
[85] htmltools_0.4.0 later_1.0.0
[87] Formula_1.2-3 tidyr_1.0.2
[89] DBI_1.0.0 ExperimentHub_1.12.0
[91] dbplyr_1.4.2 MASS_7.3-51.5
[93] rappdirs_0.3.1 Matrix_1.2-18
[95] readr_1.3.1 permute_0.9-5
[97] R.methodsS3_1.7.1 quadprog_1.5-8
[99] pkgconfig_2.0.3 GenomicAlignments_1.20.1
[101] registry_0.5-1 foreign_0.8-72
[103] xml2_1.2.5 annotate_1.62.0
[105] rngtools_1.4 pkgmaker_0.27
[107] multtest_2.40.0 beanplot_1.2
[109] ruv_0.9.7.1 bibtex_0.4.2
[111] doRNG_1.7.1 scrime_1.3.5
[113] VariantAnnotation_1.30.1 digest_0.6.25
[115] rmarkdown_2.1 base64_2.0
[117] htmlTable_1.13.2 edgeR_3.26.8
[119] DelayedMatrixStats_1.8.0 curl_4.3
[121] shiny_1.3.2 gtools_3.8.1
[123] Rsamtools_2.0.1 lifecycle_0.2.0
[125] nlme_3.1-145 Rhdf5lib_1.6.1
[127] askpass_1.1 BSgenome_1.52.0
[129] pillar_1.4.3 lattice_0.20-40
[131] httr_1.4.1 survival_2.44-1.1
[133] GO.db_3.8.2 interactiveDisplayBase_1.22.0
[135] glue_1.3.2 BiocVersion_3.10.1
[137] bit_1.1-14 stringi_1.4.6
[139] HDF5Array_1.14.3 blob_1.2.0
[141] AnnotationHub_2.18.0 org.Hs.eg.db_3.8.2
[143] latticeExtra_0.6-28 memoise_1.1.0
[145] dplyr_0.8.3