Estimating cell proportions
Jovana Maksimovic
12/17/2018
Last updated: 2020-03-16
Checks: 7 0
Knit directory: paed-cf-methylation/
This reproducible R Markdown analysis was created with workflowr (version 1.6.1). The Checks tab describes the reproducibility checks that were applied when the results were created. The Past versions tab lists the development history.
Great! Since the R Markdown file has been committed to the Git repository, you know the exact version of the code that produced these results.
Great job! The global environment was empty. Objects defined in the global environment can affect the analysis in your R Markdown file in unknown ways. For reproduciblity it’s best to always run the code in an empty environment.
The command set.seed(20200224) was run prior to running the code in the R Markdown file. Setting a seed ensures that any results that rely on randomness, e.g. subsampling or permutations, are reproducible.
Great job! Recording the operating system, R version, and package versions is critical for reproducibility.
Nice! There were no cached chunks for this analysis, so you can be confident that you successfully produced the results during this run.
Great job! Using relative paths to the files within your workflowr project makes it easier to run your code on other machines.
Great! You are using Git for version control. Tracking code development and connecting the code version to the results is critical for reproducibility.
The results in this page were generated with repository version b268666. See the Past versions tab to see a history of the changes made to the R Markdown and HTML files.
Note that you need to be careful to ensure that all relevant files for the analysis have been committed to Git prior to generating the results (you can use wflow_publish or wflow_git_commit). workflowr only checks the R Markdown file, but you know if there are other scripts or data files that it depends on. Below is the status of the Git repository when the results were generated:
Ignored files:
    Ignored:    .Rhistory
    Ignored:    .Rproj.user/
    Ignored:    code/DNAm-based-age-predictor/
    Ignored:    data/CFGeneModifiers.csv
    Ignored:    data/Horvath-27k-probes.csv
    Ignored:    data/Horvath-coefficients.csv
    Ignored:    data/Horvath-methylation-data.csv
    Ignored:    data/Horvath-mini-annotation.csv
    Ignored:    data/Horvath-sample-data.csv
    Ignored:    data/ageFile-final.txt
    Ignored:    data/idat/
    Ignored:    data/processedData.RData
    Ignored:    data/rawPatientBetas.rds
    Ignored:    output/Horvath-output.csv
    Ignored:    output/Horvath-output2.csv
    Ignored:    output/age.pred
    Ignored:    output/stderr.txt
    Ignored:    output/stdout.txt
Note that any generated files, e.g. HTML, png, CSS, etc., are not included in this status report because it is ok for generated content to have uncommitted changes.
These are the previous versions of the repository in which changes were made to the R Markdown (analysis/estCellProp.Rmd) and HTML (docs/estCellProp.html) files. If you’ve configured a remote Git repository (see ?wflow_git_remote), click on the hyperlinks in the table below to view the files as they were in that past version.
| File | Version | Author | Date | Message |
|---|---|---|---|---|
| html | 4e14664 | Jovana Maksimovic | 2020-03-16 | Build site. |
| Rmd | c5e92c8 | Jovana Maksimovic | 2020-03-16 | wflow_publish(“analysis/estCellProp.Rmd”) |
Estimate cell type proportions of lavage patient samples
Load all necessary analysis packages.
library(here)
library(workflowr)
#Load Packages Required for Analysis
library(limma)
library(minfi)
library(RColorBrewer)
library(missMethyl)
library(matrixStats)
library(minfiData)
library(IlluminaHumanMethylationEPICanno.ilm10b4.hg19)
library(IlluminaHumanMethylationEPICmanifest)
library(FlowSorted.Blood.EPIC)
library(NMF)
library(ggplot2)
library(cowplot)
library(ExperimentHub)
library(reshape)
library(reshape2)
Load raw and processed data objects generated by exploratory analysis.
# load data objects
load(here("data/idat/processedData.RData"))
# load modified cell type estimation function
source(here("code/functions.R"))
As expected, we see clear clustering by cell types.
plotMDS(mVals[,cells], top=1000, gene.selection="common",
        col=pal[factor(targets$Sample_Group[cells])],pch=19)
legend("topright", legend=levels(factor(targets$Sample_Group[cells])), text.col=pal,
       bg="white", cex=0.7)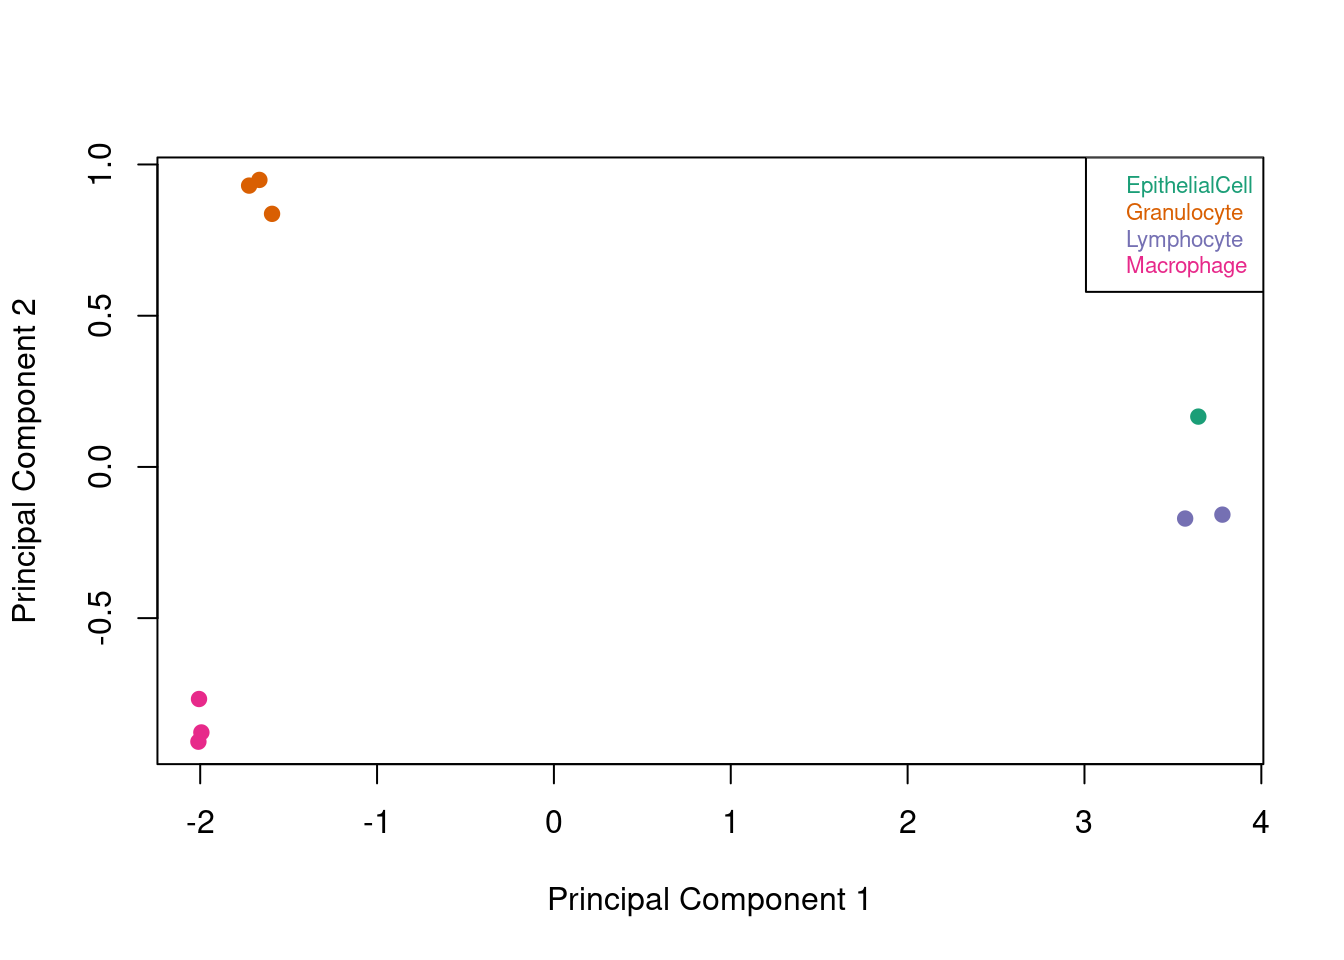
| Version | Author | Date |
|---|---|---|
| 4e14664 | Jovana Maksimovic | 2020-03-16 |
Cell type estimation
We can estimate the proportions of cell types in each of our patients samples using our reference panel. To select the most informative cell type probes from our reference panel we can either set the ’probeSelect paremeter to both, which selects an equal number (50) of probes (with F-stat p-value < 1E-8) with the greatest magnitude of effect from the hyper and hypo methylated sides; or any, which selects the 100 probes (with F-stat p-value < 1E-8) with the greatest magnitude of difference regardless of direction of effect.
Get estimates for proportion of each cell type using the any option.
lavageRef <- rgSet[,cells]
colData(lavageRef)$CellType <- colData(lavageRef)$Sample_Group
cellEstAny <- estimateCellCounts2(rgSet = rgSet[,patients], compositeCellType = "Lavage",
                                processMethod = "preprocessNoob",
                                probeSelect = "any",
                                cellTypes = unique(targets$Sample_Group[cells]),
                                referencePlatform =
                                "IlluminaHumanMethylationEPIC",
                                referenceset = "lavageRef",
                                IDOLOptimizedCpGs = NULL,
                                returnAll = TRUE,
                                meanPlot = FALSE)
[estimateCellCounts2] Combining user data with reference (flow sorted) data.Warning in DataFrame(sampleNames = c(colnames(rgSet),
colnames(referenceRGset)), : 'stringsAsFactors' is ignored[estimateCellCounts2] Processing user and reference data together.[estimateCellCounts2] Picking probes for composition estimation.[estimateCellCounts2] Estimating composition.cellEstAny$counts EpithelialCell Macrophage Granulocyte Lymphocyte
Case.103516-001-003 0.10912093 0.14096408 0.3627366 0.43857362
Control.103516-001-004 0.07567840 0.41142506 0.4410196 0.14775025
Case.103516-001-005 0.25181213 0.59716172 0.1529250 0.06697737
Control.103516-001-006 0.11816495 0.68006840 0.2271682 0.04464973
Case.103516-001-007 0.10005455 0.51119175 0.1963071 0.24499883
Control.103516-001-008 0.02035871 0.07910399 0.8773749 0.05109921
Case.103516-001-009 0.10214691 0.68932031 0.1797846 0.09099153
Control.103516-001-010 0.06616318 0.01282324 0.8469510 0.09548693
Case.103516-001-011 0.05439409 0.75364947 0.1897758 0.05933600
Control.103516-001-012 0.07233714 0.24074171 0.6555977 0.08986358
Case.103516-001-013 0.23882915 0.50403910 0.1890100 0.14117113
Control.103516-001-014 0.05536819 0.03997348 0.9090762 0.02738828
Case.103516-001-015 0.20792660 0.42546850 0.2365627 0.18507317
Control.103516-001-016 0.16661130 0.20355812 0.4822253 0.21483349
Case.103516-001-017 0.16096106 0.40132644 0.4015755 0.12839296
Control.103516-001-018 0.06699026 0.67786416 0.2519185 0.06574071
Case.103516-001-019 0.06785921 0.11814081 0.6903587 0.17163639
Control.103516-001-020 0.09289384 0.37793266 0.3970988 0.18914111
Case.103516-001-021 0.15891004 0.54266852 0.2963285 0.08630184
Control.103516-001-022 0.11871882 0.56669744 0.3175308 0.07663026
Case.103516-001-023 0.16658483 0.54916741 0.2643125 0.10394682
Control.103516-001-024 0.14442962 0.50790629 0.3559648 0.08600448
Case.103516-001-025 0.15771857 0.57857072 0.1999580 0.13920747
Control.103516-001-026 0.06606386 0.06713295 0.8044572 0.10180187
Case.103516-001-027 0.05643048 0.45997591 0.1401997 0.38834420
Control.103516-001-028 0.11888247 0.15342367 0.3955064 0.38036179
Case.103516-001-029 0.05641684 0.76062137 0.1244154 0.10948116
Control.103516-001-030 0.15338911 0.40325176 0.3773980 0.14514182
Control.103516-001-031 0.08065634 0.07456093 0.8373916 0.05198884estAny <- melt(cellEstAny$counts)
colnames(estAny) <- c("Sample","Cell","Proportion")
g <- ggplot(estAny, aes(Sample))
g + geom_bar(aes(fill = Cell, weight=Proportion)) +
scale_x_discrete(breaks = waiver(), labels=1:nrow(estAny)) +
ggtitle("Patient samples (Any)") +
ylab("Proportion")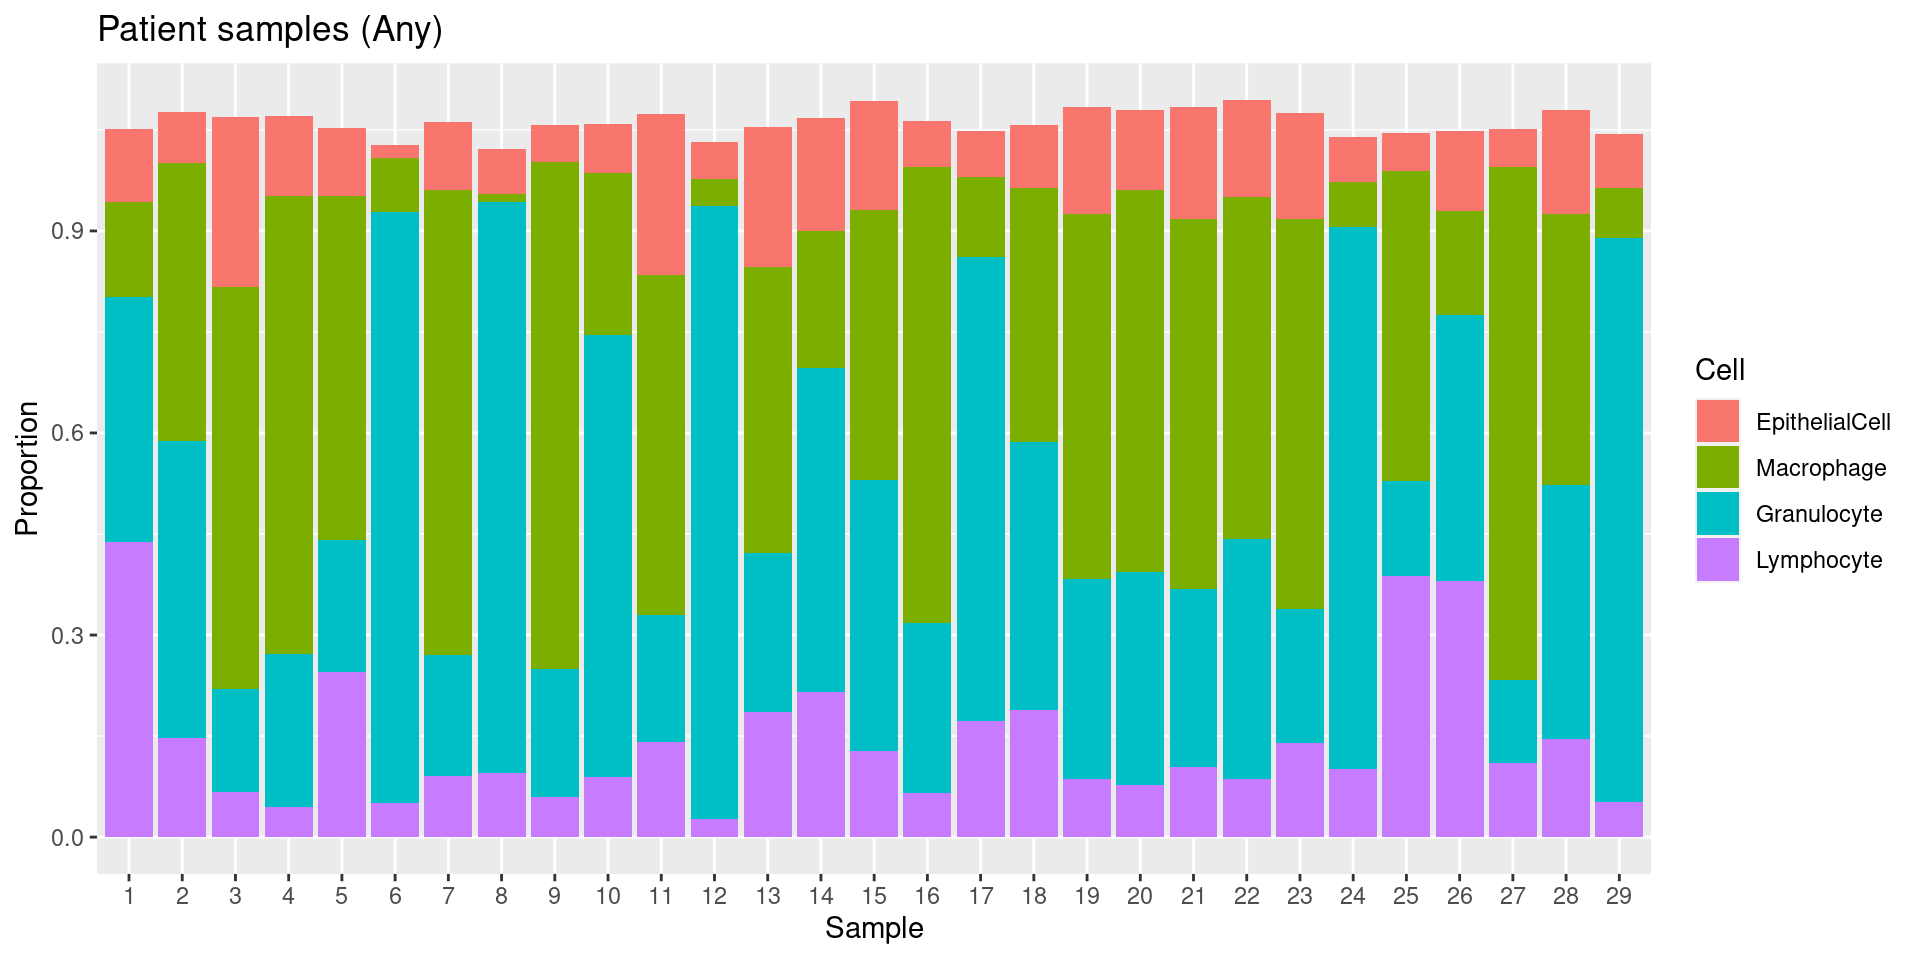
| Version | Author | Date |
|---|---|---|
| 4e14664 | Jovana Maksimovic | 2020-03-16 |
Get estimates for proportion of each cell type using the both option.
cellEstBoth <- estimateCellCounts2(rgSet = rgSet[,patients], compositeCellType = "Lavage",
                                processMethod = "preprocessNoob",
                                probeSelect = "both",
                                cellTypes = unique(targets$Sample_Group[cells]),
                                referencePlatform =
                                "IlluminaHumanMethylationEPIC",
                                referenceset = "lavageRef",
                                IDOLOptimizedCpGs = NULL,
                                returnAll = TRUE,
                                meanPlot = FALSE)
[estimateCellCounts2] Combining user data with reference (flow sorted) data.Warning in DataFrame(sampleNames = c(colnames(rgSet),
colnames(referenceRGset)), : 'stringsAsFactors' is ignored[estimateCellCounts2] Processing user and reference data together.[estimateCellCounts2] Picking probes for composition estimation.[estimateCellCounts2] Estimating composition.cellEstBoth$counts EpithelialCell Macrophage Granulocyte Lymphocyte
Case.103516-001-003 0.12410779 0.15994184 0.3933415 0.39177388
Control.103516-001-004 0.04616106 0.42648637 0.4472523 0.14138573
Case.103516-001-005 0.24518441 0.59941656 0.1371195 0.07338889
Control.103516-001-006 0.09871215 0.68660191 0.2063385 0.06011967
Case.103516-001-007 0.09878410 0.55254266 0.2039200 0.21255128
Control.103516-001-008 0.01113002 0.07492359 0.8816931 0.05113472
Case.103516-001-009 0.08530654 0.69694509 0.1689916 0.09656800
Control.103516-001-010 0.07329523 0.00759358 0.8603416 0.08499090
Case.103516-001-011 0.03585303 0.75530472 0.1821756 0.06907043
Control.103516-001-012 0.05122689 0.23955254 0.6616567 0.08901088
Case.103516-001-013 0.23211562 0.51822537 0.1767829 0.13924614
Control.103516-001-014 0.05277781 0.02597201 0.9146985 0.03129424
Case.103516-001-015 0.21610850 0.45325178 0.2370618 0.15739393
Control.103516-001-016 0.16642230 0.20490761 0.5038888 0.19704986
Case.103516-001-017 0.14264065 0.38831588 0.3995090 0.13980580
Control.103516-001-018 0.04308519 0.67614903 0.2474618 0.07754263
Case.103516-001-019 0.06112728 0.12223394 0.7087250 0.15841894
Control.103516-001-020 0.08659379 0.39580236 0.4077915 0.17017293
Case.103516-001-021 0.14270180 0.55026009 0.2785873 0.09493242
Control.103516-001-022 0.09883709 0.55512170 0.3092811 0.09490305
Case.103516-001-023 0.15018633 0.55154483 0.2554983 0.10954196
Control.103516-001-024 0.11863705 0.50128072 0.3465146 0.10476455
Case.103516-001-025 0.14654875 0.59182561 0.1966005 0.13367099
Control.103516-001-026 0.05926145 0.06258880 0.8133222 0.09881234
Case.103516-001-027 0.05607965 0.49994339 0.1681444 0.34226807
Control.103516-001-028 0.13177936 0.16815731 0.4260856 0.34044852
Case.103516-001-029 0.03828731 0.78115427 0.1253797 0.10144508
Control.103516-001-030 0.13747952 0.41122345 0.3738652 0.14415778
Control.103516-001-031 0.07232267 0.05692205 0.8405813 0.06015391estBoth <- melt(cellEstBoth$counts)
colnames(estBoth) <- c("Sample","Cell","Proportion")
g <- ggplot(estBoth, aes(Sample))
g + geom_bar(aes(fill = Cell, weight=Proportion)) +
scale_x_discrete(breaks = waiver(), labels=1:nrow(estBoth)) +
ggtitle("Patient samples (Both)") +
ylab("Proportion")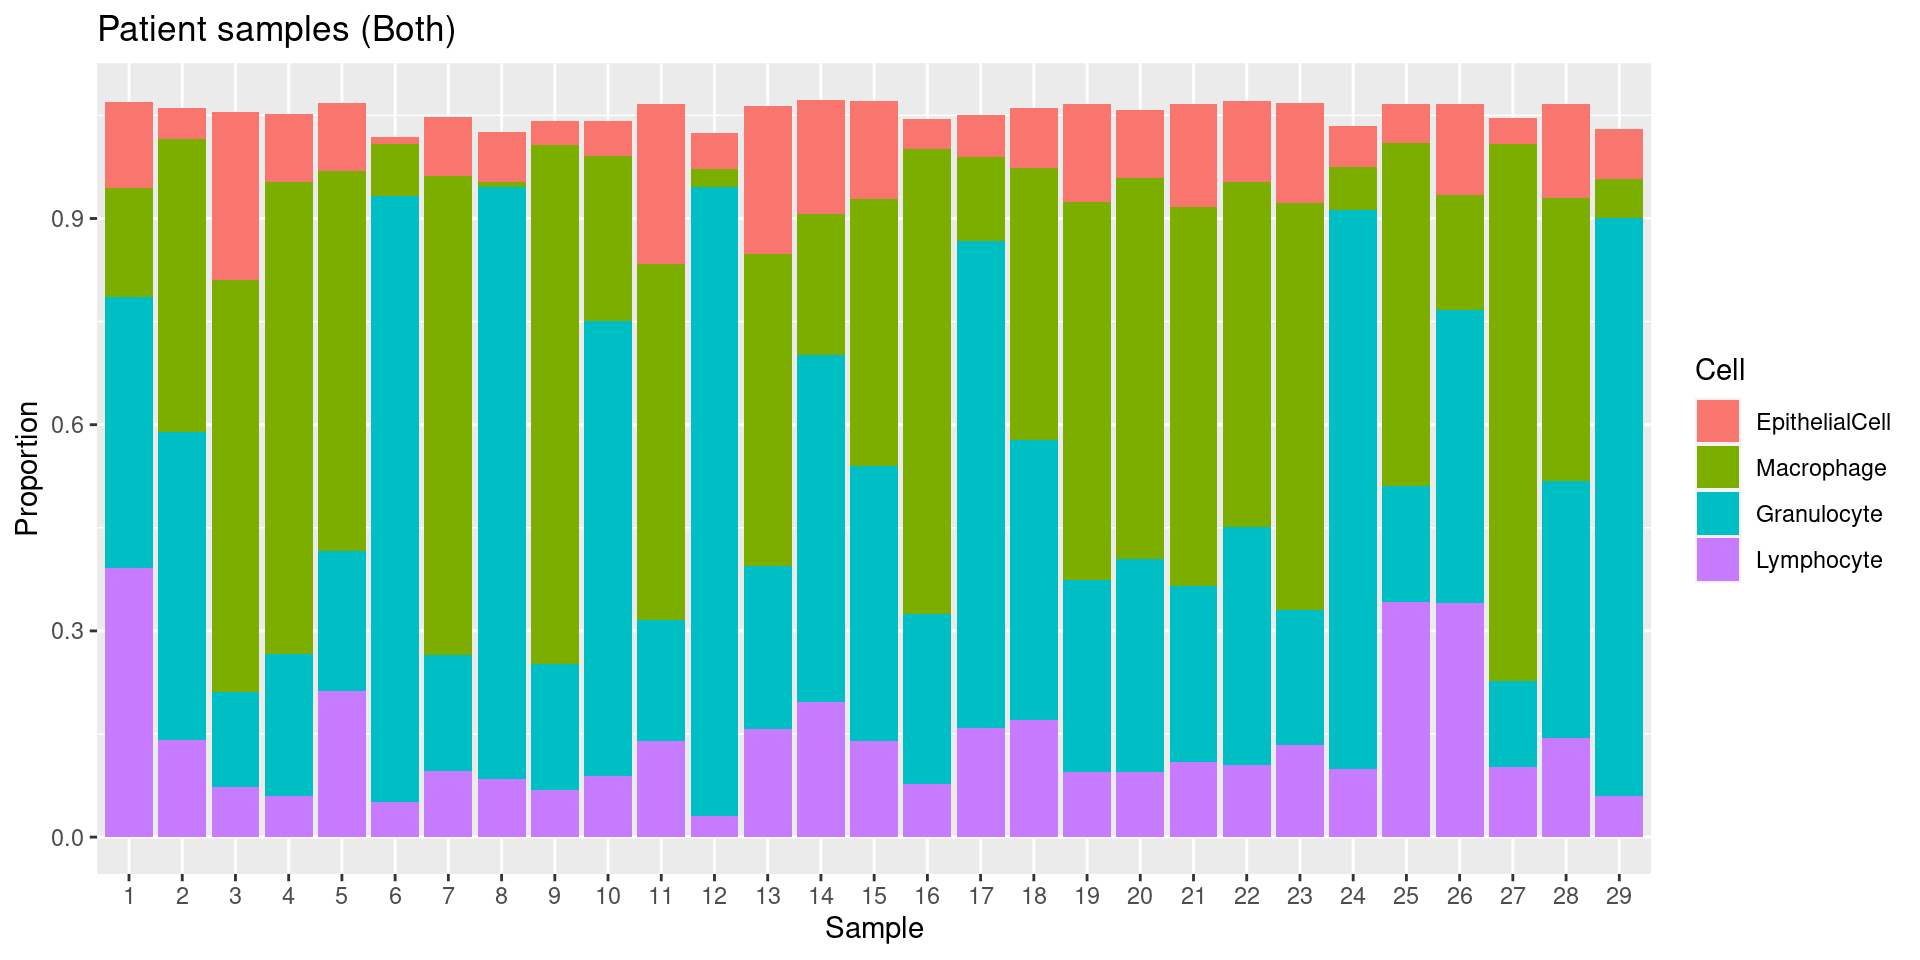
| Version | Author | Date |
|---|---|---|
| 4e14664 | Jovana Maksimovic | 2020-03-16 |
Test whether there are any statistically significant differnces between cases and controls in the estimated proportions of the various cell types (based on estimates made using any for probe selection). Granulocytes are significantly higher in controls (FDR < 0.05) and macrophages are significantly lower (FDR < 0.05).
caseCtrl <- factor(targets$Sample_Group[patients])
design <- model.matrix(~caseCtrl)

fit <- lmFit(t(cellEstAny$counts),design)
fit <- eBayes(fit)

topTable(fit)
Removing intercept from test coefficients logFC AveExpr t P.Value adj.P.Val
Granulocyte 0.28623694 0.4069286 3.844705 0.0006076499 0.002430599
Macrophage -0.20254047 0.3975424 -2.608821 0.0142071174 0.028414235
EpithelialCell -0.04049331 0.1139956 -1.844204 0.0753752227 0.100500297
Lymphocyte -0.05031493 0.1421488 -1.317353 0.1980177676 0.198017768
B
Granulocyte -0.3798641
Macrophage -3.2677817
EpithelialCell -4.7111464
Lymphocyte -5.4755066Test whether there are any statistically significant differnces between cases and controls in the estimated proportions of the various cell types (based on estimates made using both for probe selection). Granulocytes are significantly higher in controls (FDR < 0.05) and macrophages are significantly lower (FDR < 0.05).
fit <- lmFit(t(cellEstBoth$counts),design)
fit <- eBayes(fit)

topTable(fit)
Removing intercept from test coefficients logFC AveExpr t P.Value adj.P.Val
Granulocyte 0.28996791 0.4094003 3.801114 0.0006857602 0.002743041
Macrophage -0.21622680 0.4039376 -2.760161 0.0099157255 0.019831451
EpithelialCell -0.04360654 0.1042329 -1.955121 0.0602811309 0.080374841
Lymphocyte -0.04218073 0.1367592 -1.298883 0.2042312957 0.204231296
B
Granulocyte -0.4854938
Macrophage -2.9362044
EpithelialCell -4.5138825
Lymphocyte -5.4869850Plot cell type proportion estimates stratified by patient status. There are statistically significant differences between cases and controls in the proportions of granulocytes and macrophages, in particular.
estAny <- cellEstAny$counts
estBoth <- cellEstBoth$counts

prop <- as.vector(estAny)
cell <- rep(colnames(estAny),each=nrow(estAny))
status <- rep(strsplit2(rownames(estAny),".",fixed=TRUE)[,1],ncol(estAny))
patient <- rep(rownames(estAny),ncol(estAny))

datAny <- data.frame(prop,cell,status,patient)

a <- ggplot(datAny, aes(x=cell, y=prop, fill=status)) + geom_boxplot()
a <- a + geom_jitter(position = position_dodge(0.75), shape=1) +
    scale_fill_brewer(palette="Set1") +
    labs(y="Estimated proportion", x="Cell type", fill="Status") +
    theme_minimal() + ggtitle("Any")

prop <- as.vector(estBoth)
cell <- rep(colnames(estBoth),each=nrow(estBoth))
status <- rep(strsplit2(rownames(estBoth),".",fixed=TRUE)[,1],ncol(estBoth))
patient <- rep(rownames(estBoth),ncol(estBoth))

datBoth <- data.frame(prop,cell,status,patient)

b <- ggplot(datBoth, aes(x=cell, y=prop, fill=status)) + geom_boxplot()
b <- b + geom_jitter(position = position_dodge(0.75), shape=1) +
    scale_fill_brewer(palette="Set1") +
    labs(y="Estimated proportion", x="Cell type", fill="Status") +
    theme_minimal() + ggtitle("Both")

plot_grid(a,b)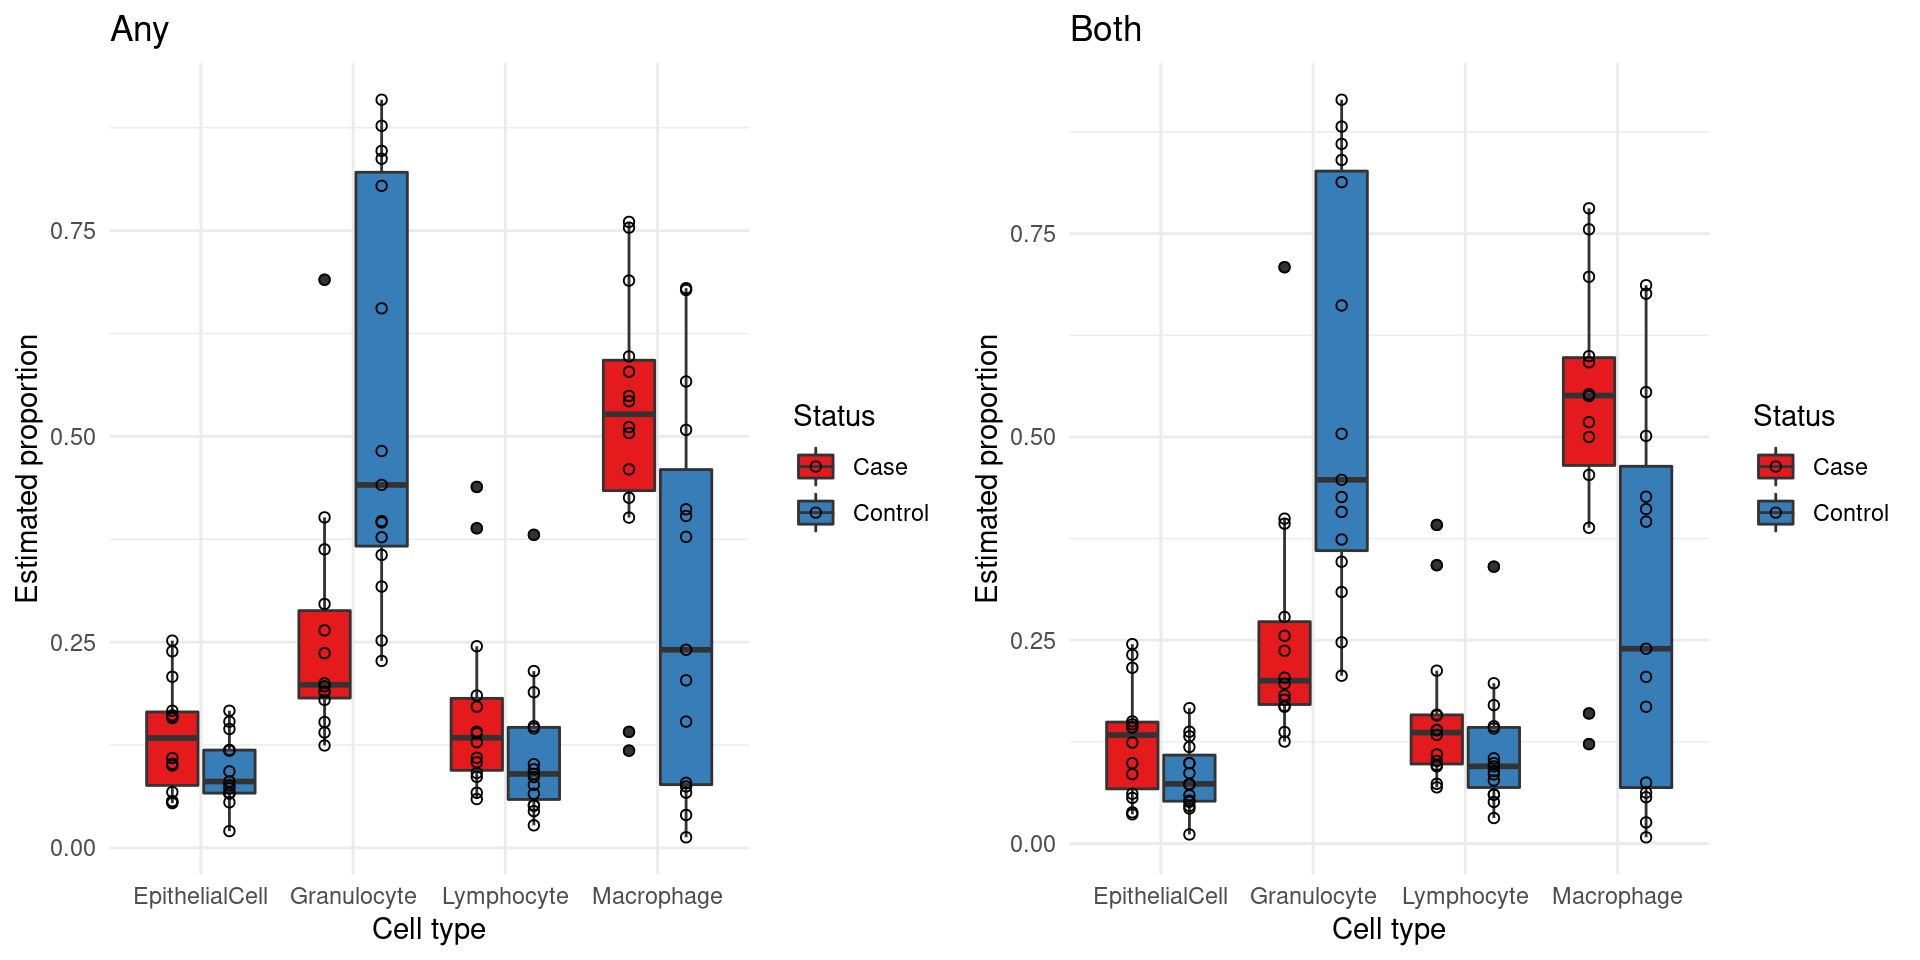
| Version | Author | Date |
|---|---|---|
| 4e14664 | Jovana Maksimovic | 2020-03-16 |
Reference panel validation
We will use blood immune cell mixtures with known cell type proportions published by Salas et al. 2018 to test the accuracy of cell type proportion estimates derived using our reference library.
hub <- ExperimentHub() snapshotDate(): 2019-10-22query(hub, "FlowSorted.Blood.EPIC") ExperimentHub with 1 record
# snapshotDate(): 2019-10-22
# names(): EH1136
# package(): FlowSorted.Blood.EPIC
# $dataprovider: GEO
# $species: Homo sapiens
# $rdataclass: RGChannelSet
# $rdatadateadded: 2018-04-20
# $title: FlowSorted.Blood.EPIC: Illumina Human Methylation data from EPIC o...
# $description: The FlowSorted.Blood.EPIC package contains Illumina HumanMet...
# $taxonomyid: 9606
# $genome: hg19
# $sourcetype: tar.gz
# $sourceurl: https://www.ncbi.nlm.nih.gov/geo/query/acc.cgi?acc=GSE110554
# $sourcesize: NA
# $tags: c("ExperimentData", "Homo_sapiens_Data", "Tissue",
# "MicroarrayData", "Genome", "TissueMicroarrayData",
# "MethylationArrayData")
# retrieve record with 'object[["EH1136"]]' FlowSorted.Blood.EPIC <- hub[["EH1136"]]see ?FlowSorted.Blood.EPIC and browseVignettes('FlowSorted.Blood.EPIC') for documentationloading from cache# separate the reference from the testing dataset
RGsetTargets <- FlowSorted.Blood.EPIC[,FlowSorted.Blood.EPIC$CellType == "MIX"]
mixReal <- as.matrix(colData(RGsetTargets)[,12:17])/100
mixDat <- melt(mixReal)
colnames(mixDat) <- c("Sample","Cell","Proportion")
g <- ggplot(mixDat, aes(Sample))
g + geom_bar(aes(fill = Cell, weight=Proportion)) +
scale_x_discrete(breaks = waiver(), labels=1:nrow(mixReal)) +
ggtitle("Artificially created cell mixtures") +
ylab("Proportion")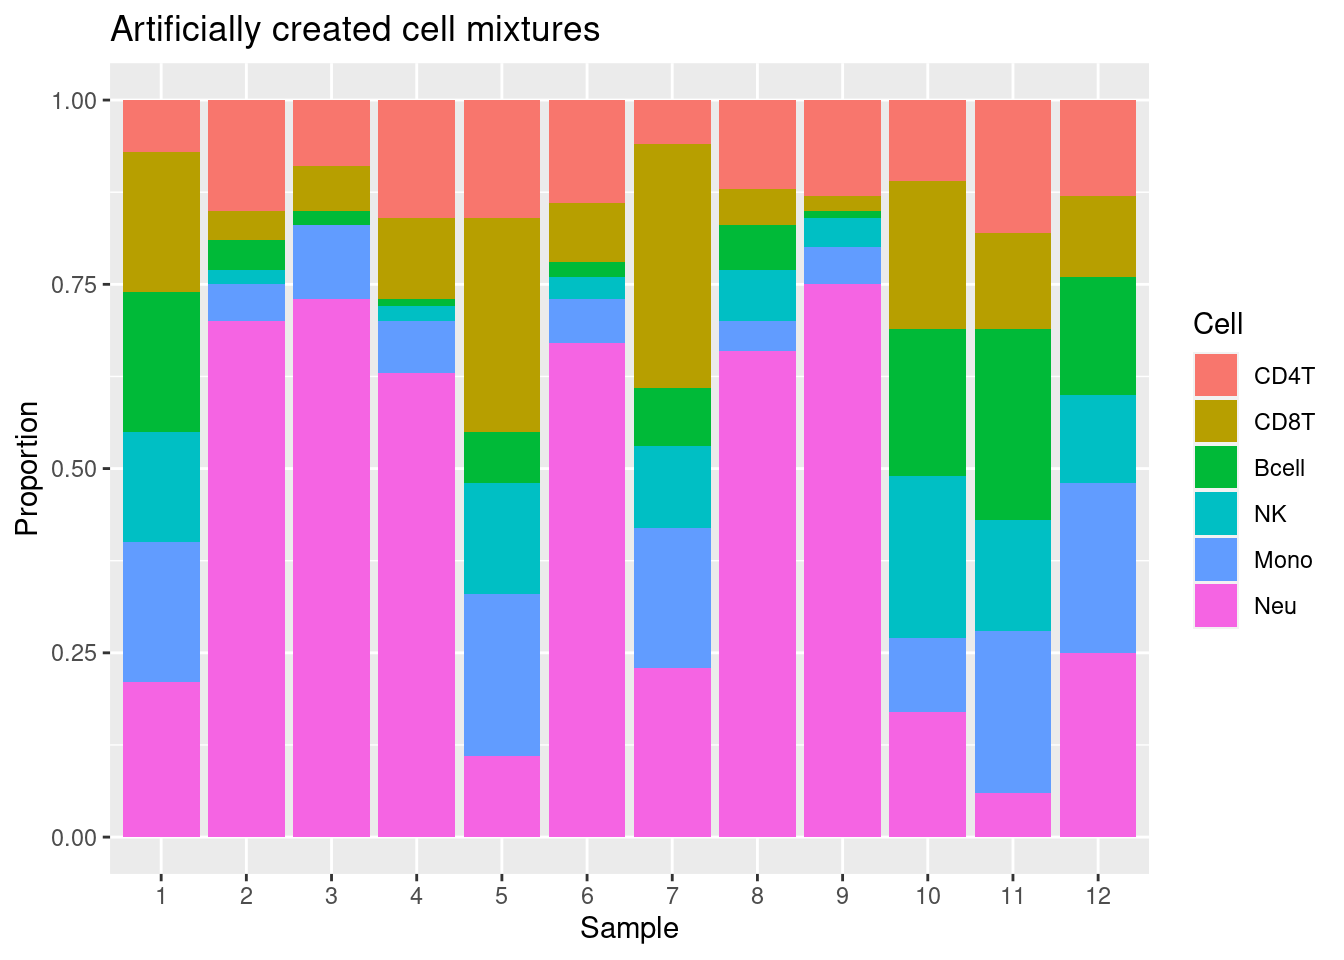
| Version | Author | Date |
|---|---|---|
| 4e14664 | Jovana Maksimovic | 2020-03-16 |
We have not sorted our BAL lymphocytes into B cells, T cells and NK cells, so the “true” lymphocyte value we will compare to is the sum of the proportions of those cells in the artificial mixture.
mixSum <- data.frame(mixReal[,5:6],Lymph=rowSums(mixReal[,1:4]))
mixSumDat <- melt(as.matrix(mixSum))
colnames(mixSumDat) <- c("Sample","Cell","Proportion")

g <- ggplot(mixSumDat, aes(Sample))
g + geom_bar(aes(fill = Cell, weight=Proportion)) +
    scale_x_discrete(breaks = waiver(), labels=1:nrow(mixReal)) +
    ggtitle("Artificially created cell mixtures") +
    ylab("Proportion")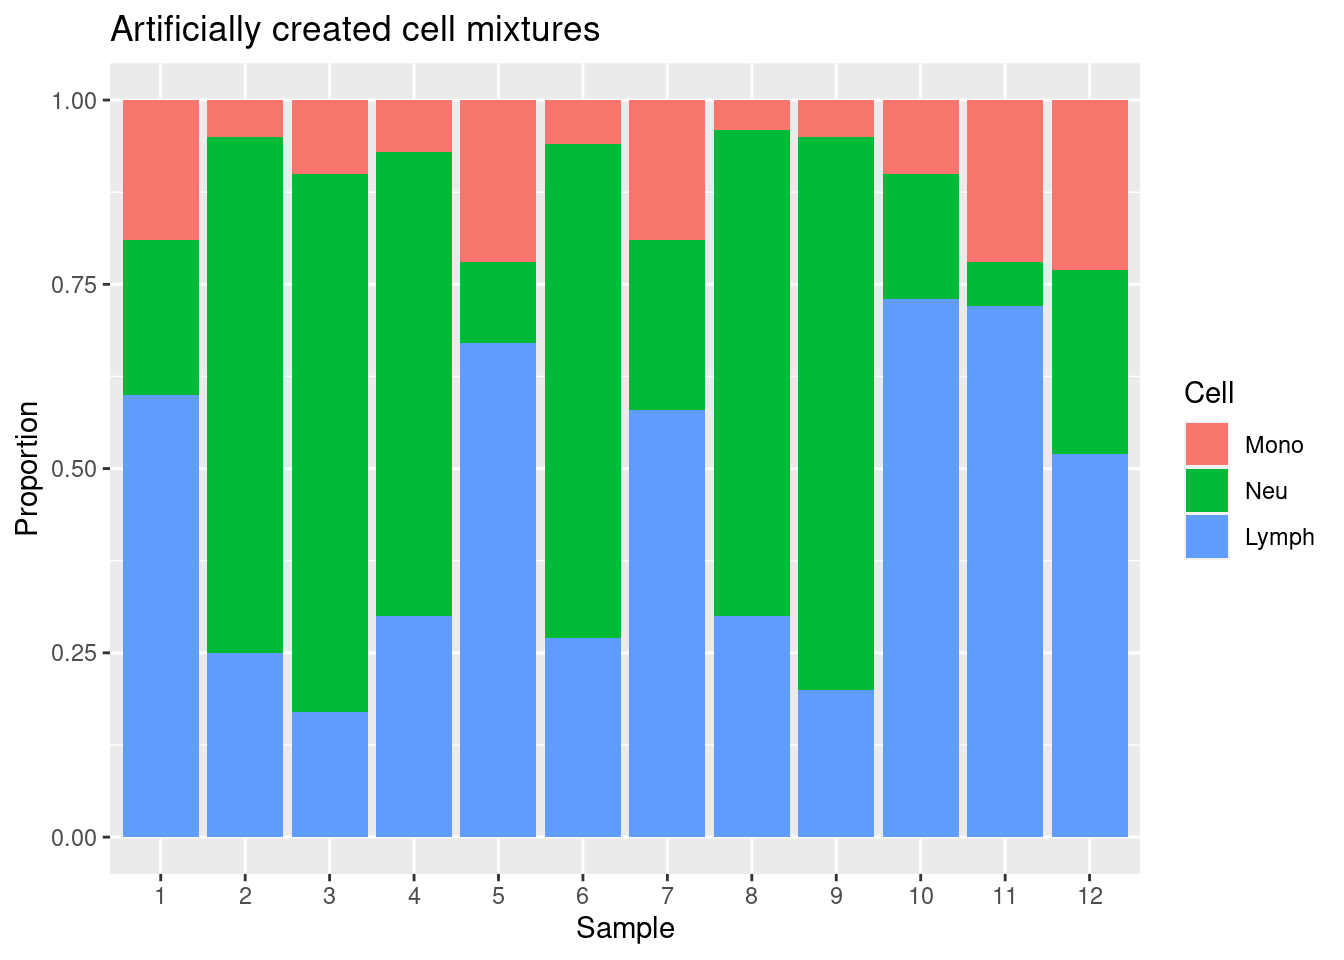
| Version | Author | Date |
|---|---|---|
| 4e14664 | Jovana Maksimovic | 2020-03-16 |
mixEstBoth <- estimateCellCounts2(rgSet = RGsetTargets, compositeCellType = "Lavage",
                                processMethod = "preprocessNoob",
                                probeSelect = "both",
                                cellTypes = unique(targets$Sample_Group[cells]),
                                referencePlatform =
                                "IlluminaHumanMethylationEPIC",
                                referenceset = "lavageRef",
                                IDOLOptimizedCpGs = NULL,
                                returnAll = FALSE,
                                meanPlot = FALSE)
[estimateCellCounts2] Combining user data with reference (flow sorted) data.Warning in DataFrame(sampleNames = c(colnames(rgSet),
colnames(referenceRGset)), : 'stringsAsFactors' is ignored[estimateCellCounts2] Processing user and reference data together.[estimateCellCounts2] Picking probes for composition estimation.[estimateCellCounts2] Estimating composition.mixEstBoth$counts EpithelialCell Macrophage Granulocyte Lymphocyte
201868590193_R01C01 0.032534701 0.10885324 0.2975074 0.6033620
201868590243_R02C01 0.014354914 0.01700282 0.6823029 0.2979897
201868590267_R01C01 0.013382193 0.04103073 0.7423603 0.2150178
201868590267_R05C01 0.014536300 0.02915357 0.6308373 0.3445959
201869680008_R01C01 0.034513133 0.11511596 0.2099788 0.6844661
201869680008_R03C01 0.014686271 0.02613267 0.6604543 0.3165205
201869680008_R06C01 0.030235061 0.10573755 0.3179219 0.5899939
201869680030_R03C01 0.013372544 0.01638556 0.6491859 0.3374567
201869680030_R07C01 0.008243855 0.01442765 0.7367812 0.2476411
201870610056_R01C01 0.022888545 0.05879336 0.2330513 0.7192876
201870610056_R03C01 0.034507128 0.12436530 0.1754307 0.7168048
201870610111_R03C01 0.030158620 0.12172952 0.3473760 0.5405616mixEstAny <- estimateCellCounts2(rgSet = RGsetTargets, compositeCellType = "Lavage",
processMethod = "preprocessNoob",
probeSelect = "any",
cellTypes = unique(targets$Sample_Group[cells]),
referencePlatform =
"IlluminaHumanMethylationEPIC",
referenceset = "lavageRef",
IDOLOptimizedCpGs = NULL,
returnAll = FALSE,
meanPlot = FALSE)[estimateCellCounts2] Combining user data with reference (flow sorted) data.Warning in DataFrame(sampleNames = c(colnames(rgSet),
colnames(referenceRGset)), : 'stringsAsFactors' is ignored[estimateCellCounts2] Processing user and reference data together.[estimateCellCounts2] Picking probes for composition estimation.[estimateCellCounts2] Estimating composition.mixEstAny$counts EpithelialCell Macrophage Granulocyte Lymphocyte
201868590193_R01C01 0.046335168 0.12579772 0.2702613 0.6087632
201868590243_R02C01 0.012304691 0.01835176 0.6594440 0.3181849
201868590267_R01C01 0.016520985 0.05186542 0.7249149 0.2251652
201868590267_R05C01 0.014923517 0.03397710 0.6074928 0.3635969
201869680008_R01C01 0.049157324 0.13512314 0.1852904 0.6871913
201869680008_R03C01 0.012016090 0.02643821 0.6365121 0.3389347
201869680008_R06C01 0.038066064 0.12192938 0.2892189 0.5989168
201869680030_R03C01 0.011860962 0.01750936 0.6254467 0.3583511
201869680030_R07C01 0.008459628 0.01874810 0.7209969 0.2625362
201870610056_R01C01 0.033869911 0.07106810 0.2104873 0.7256044
201870610056_R03C01 0.044739947 0.14364127 0.1414464 0.7243571
201870610111_R03C01 0.040021052 0.14371910 0.3162917 0.5485580We can see that the estimates of granulocyte proportion made using our reference panel are highly correlated with the true proportion regardless of how the discrimination probe set is chosen.
par(mfrow=c(1,2))
plot(mixReal[,6], mixEstAny$counts[,3], xlim=c(0,1),
     ylim=c(0,1),xlab="True granulocyte prop.",ylab="Est. Prop.",
     main="Any")
abline(0,1,col="red",lty=2)
plot(mixReal[,6], mixEstBoth$counts[,3], xlim=c(0,1),
     ylim=c(0,1),xlab="True granulocyte prop.",ylab="Est. Prop.",
     main="Both")
abline(0,1,col="red",lty=2)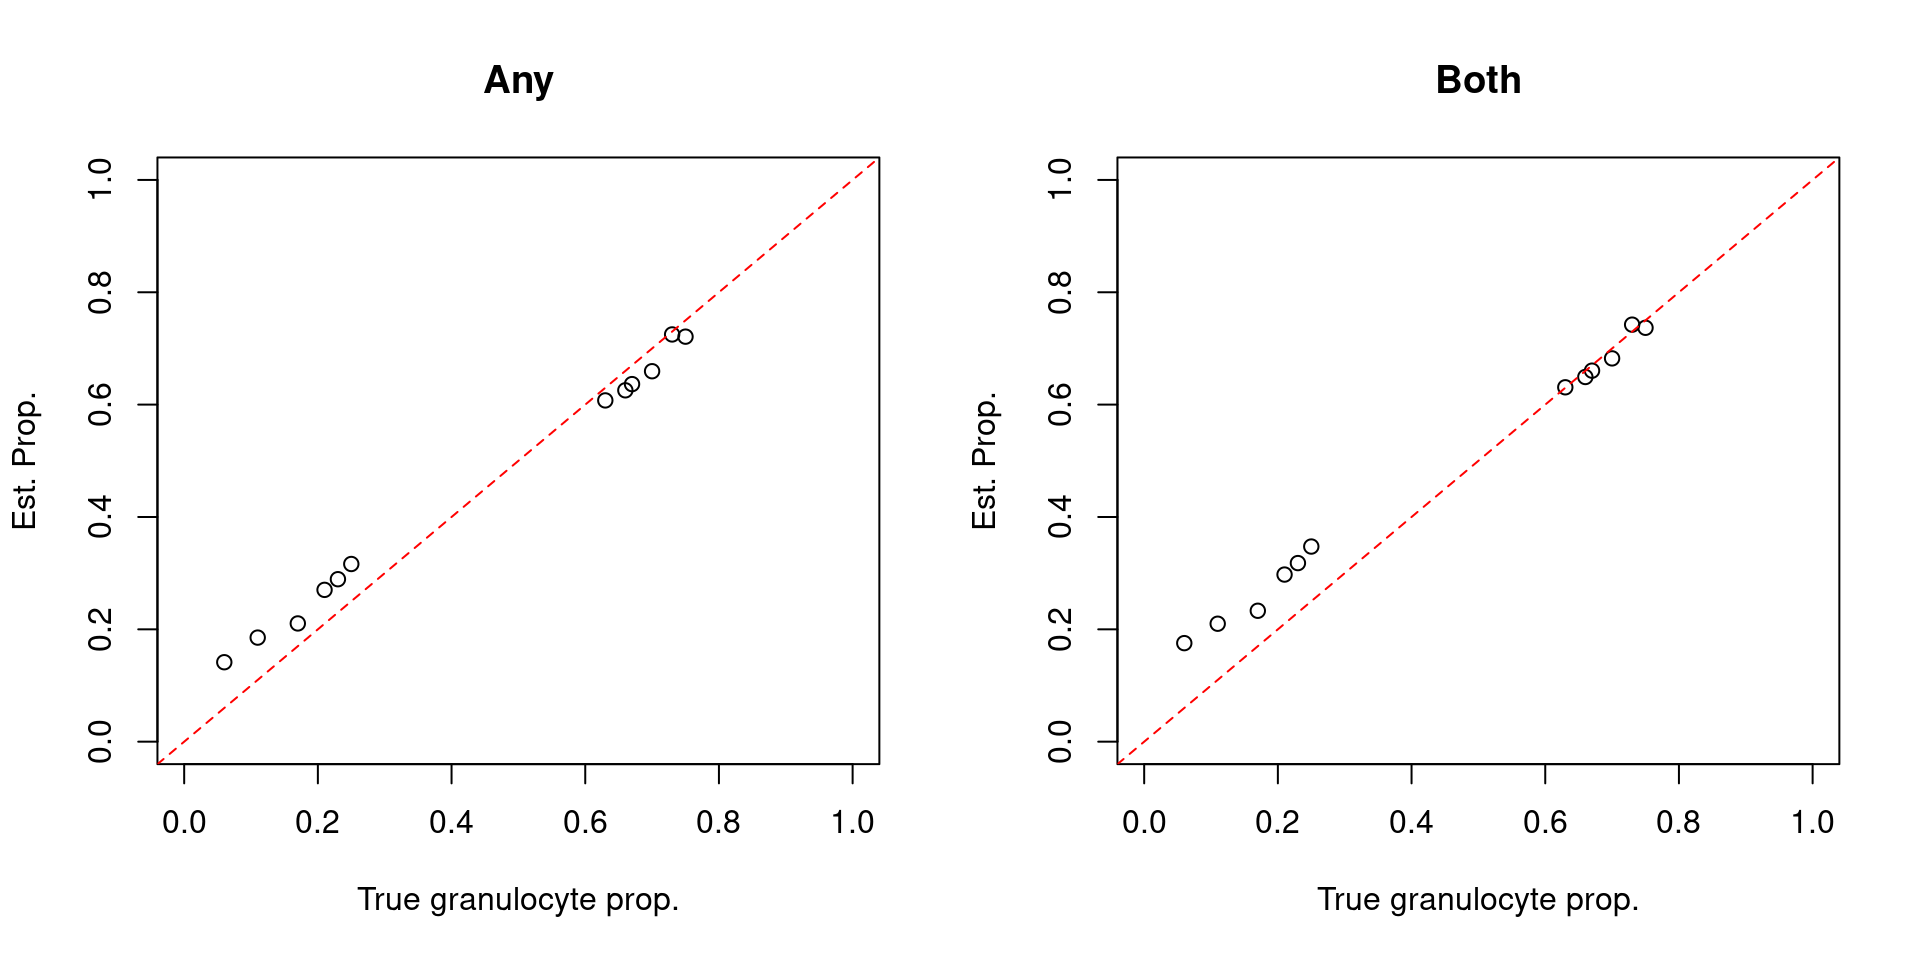
| Version | Author | Date |
|---|---|---|
| 4e14664 | Jovana Maksimovic | 2020-03-16 |
We can see that the estimates of lymphocyte proportion made using our reference panel are highly correlated with the true proportion regardless of how the discrimination probe set is chosen. The true proportion of lymphocytes is determined to be the summ of the proportions of CD4T, CD8T, NK and B cells.
par(mfrow=c(1,2))
plot(rowSums(mixReal[,1:4]), mixEstAny$counts[,4], xlim=c(0,1),
     ylim=c(0,1),xlab="True lymphocyte prop.",ylab="Est. Prop.",
     main="Any")
abline(0,1,col="red",lty=2)
plot(rowSums(mixReal[,1:4]), mixEstBoth$counts[,4], xlim=c(0,1),
     ylim=c(0,1),xlab="True lymphocyte prop.",ylab="Est. Prop.",
     main="Both")
abline(0,1,col="red",lty=2)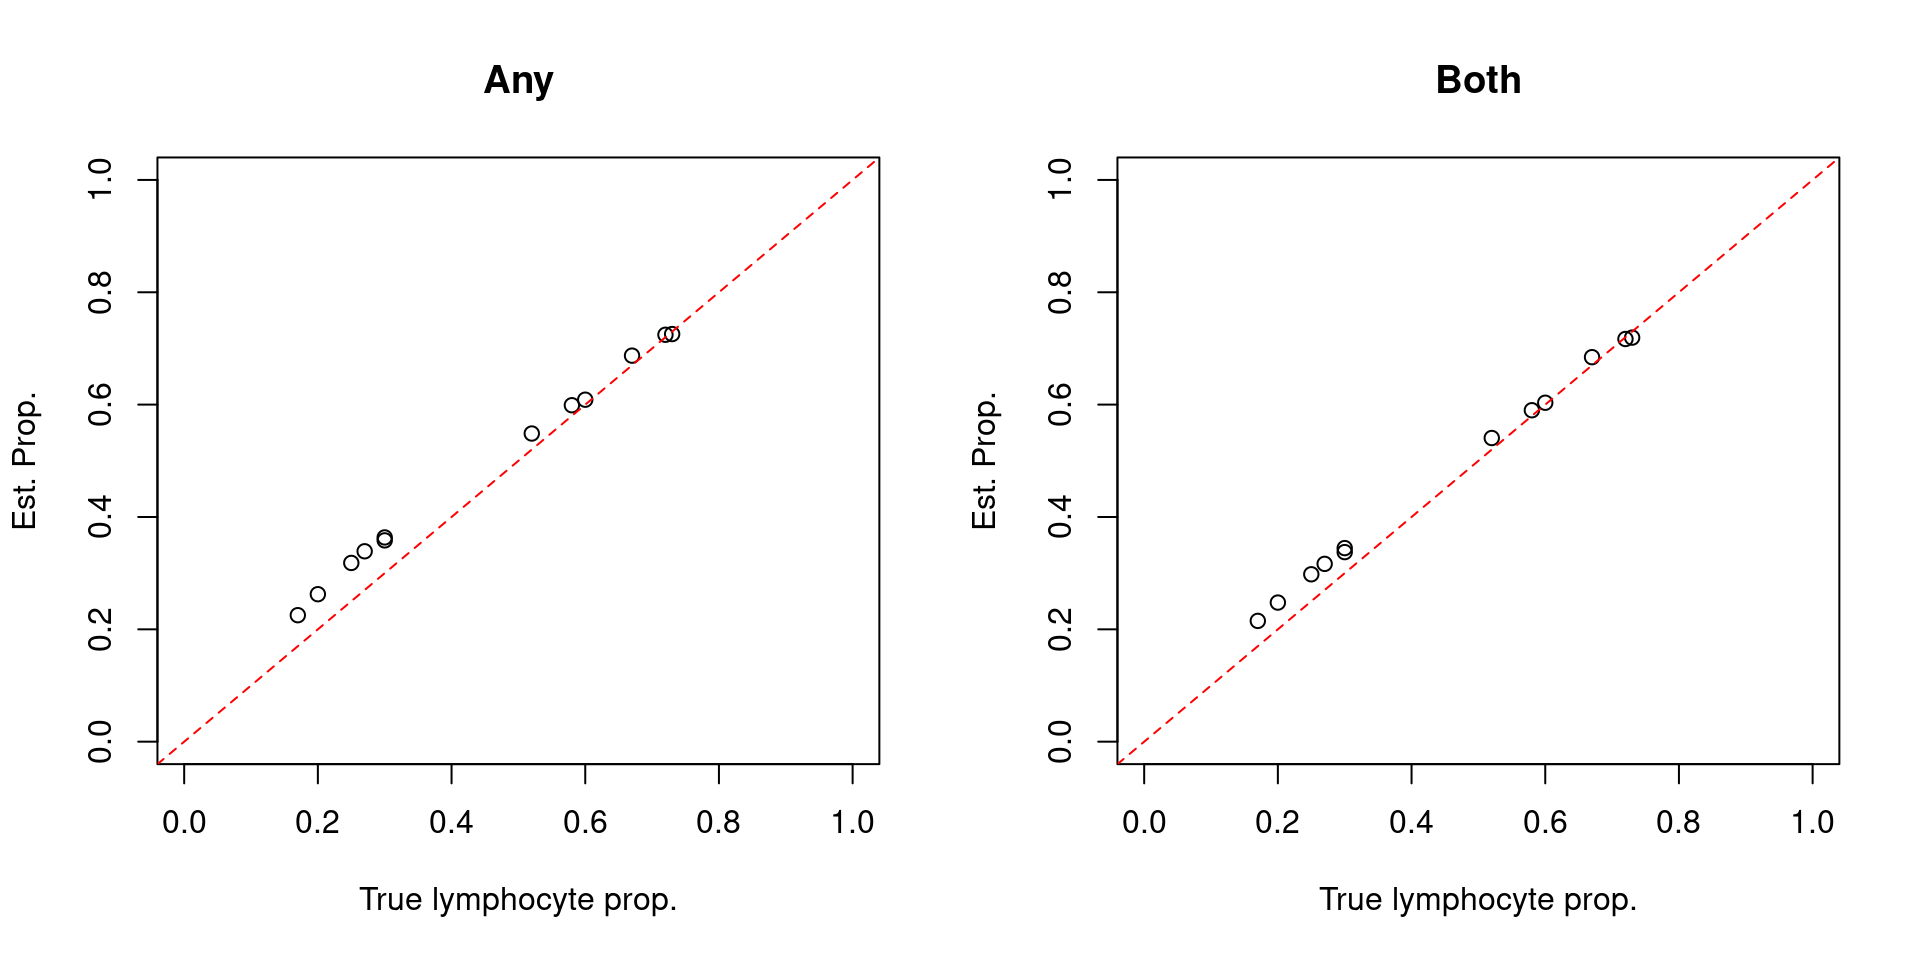
| Version | Author | Date |
|---|---|---|
| 4e14664 | Jovana Maksimovic | 2020-03-16 |
sessionInfo()R version 3.6.1 (2019-07-05)
Platform: x86_64-pc-linux-gnu (64-bit)
Running under: CentOS Linux 7 (Core)
Matrix products: default
BLAS: /config/RStudio/R/3.6.1/lib64/R/lib/libRblas.so
LAPACK: /config/RStudio/R/3.6.1/lib64/R/lib/libRlapack.so
locale:
[1] LC_CTYPE=en_AU.UTF-8 LC_NUMERIC=C
[3] LC_TIME=en_AU.UTF-8 LC_COLLATE=en_AU.UTF-8
[5] LC_MONETARY=en_AU.UTF-8 LC_MESSAGES=en_AU.UTF-8
[7] LC_PAPER=en_AU.UTF-8 LC_NAME=C
[9] LC_ADDRESS=C LC_TELEPHONE=C
[11] LC_MEASUREMENT=en_AU.UTF-8 LC_IDENTIFICATION=C
attached base packages:
[1] stats4 parallel stats graphics grDevices utils datasets
[8] methods base
other attached packages:
[1] reshape2_1.4.3
[2] reshape_0.8.8
[3] cowplot_1.0.0
[4] ggplot2_3.3.0
[5] NMF_0.22.0
[6] cluster_2.1.0
[7] rngtools_1.4
[8] pkgmaker_0.27
[9] registry_0.5-1
[10] FlowSorted.Blood.EPIC_1.4.1
[11] ExperimentHub_1.12.0
[12] AnnotationHub_2.18.0
[13] BiocFileCache_1.10.2
[14] dbplyr_1.4.2
[15] nlme_3.1-145
[16] quadprog_1.5-8
[17] genefilter_1.68.0
[18] IlluminaHumanMethylationEPICmanifest_0.3.0
[19] IlluminaHumanMethylationEPICanno.ilm10b4.hg19_0.6.0
[20] minfiData_0.32.0
[21] IlluminaHumanMethylation450kanno.ilmn12.hg19_0.6.0
[22] IlluminaHumanMethylation450kmanifest_0.4.0
[23] missMethyl_1.20.4
[24] RColorBrewer_1.1-2
[25] minfi_1.32.0
[26] bumphunter_1.26.0
[27] locfit_1.5-9.1
[28] iterators_1.0.12
[29] foreach_1.4.8
[30] Biostrings_2.54.0
[31] XVector_0.24.0
[32] SummarizedExperiment_1.16.1
[33] DelayedArray_0.12.2
[34] BiocParallel_1.20.1
[35] matrixStats_0.56.0
[36] Biobase_2.46.0
[37] GenomicRanges_1.36.1
[38] GenomeInfoDb_1.22.0
[39] IRanges_2.20.2
[40] S4Vectors_0.24.3
[41] BiocGenerics_0.32.0
[42] limma_3.42.2
[43] here_0.1
[44] workflowr_1.6.1
loaded via a namespace (and not attached):
[1] backports_1.1.5 plyr_1.8.6
[3] splines_3.6.1 gridBase_0.4-7
[5] digest_0.6.25 htmltools_0.4.0
[7] GO.db_3.8.2 magrittr_1.5
[9] memoise_1.1.0 doParallel_1.0.15
[11] readr_1.3.1 annotate_1.62.0
[13] askpass_1.1 siggenes_1.60.0
[15] prettyunits_1.0.2 colorspace_1.4-1
[17] blob_1.2.0 rappdirs_0.3.1
[19] BiasedUrn_1.07 xfun_0.12
[21] dplyr_0.8.3 crayon_1.3.4
[23] RCurl_1.95-4.12 GEOquery_2.54.1
[25] survival_2.44-1.1 glue_1.3.2
[27] ruv_0.9.7.1 gtable_0.3.0
[29] zlibbioc_1.30.0 Rhdf5lib_1.6.1
[31] HDF5Array_1.14.3 scales_1.1.0
[33] DBI_1.0.0 bibtex_0.4.2
[35] Rcpp_1.0.3 xtable_1.8-4
[37] progress_1.2.2 bit_1.1-14
[39] mclust_5.4.5 preprocessCore_1.48.0
[41] httr_1.4.1 farver_2.0.3
[43] pkgconfig_2.0.3 XML_3.98-1.20
[45] labeling_0.3 tidyselect_0.2.5
[47] rlang_0.4.5 later_1.0.0
[49] AnnotationDbi_1.46.1 BiocVersion_3.10.1
[51] munsell_0.5.0 tools_3.6.1
[53] RSQLite_2.1.2 evaluate_0.14
[55] stringr_1.4.0 yaml_2.2.1
[57] org.Hs.eg.db_3.8.2 knitr_1.28
[59] bit64_0.9-7 fs_1.3.2
[61] beanplot_1.2 scrime_1.3.5
[63] methylumi_2.30.0 purrr_0.3.3
[65] doRNG_1.7.1 mime_0.9
[67] whisker_0.4 nor1mix_1.3-0
[69] xml2_1.2.5 biomaRt_2.42.0
[71] compiler_3.6.1 interactiveDisplayBase_1.22.0
[73] curl_4.3 tibble_2.1.3
[75] statmod_1.4.32 stringi_1.4.6
[77] GenomicFeatures_1.36.4 lattice_0.20-40
[79] Matrix_1.2-18 multtest_2.40.0
[81] vctrs_0.2.4 pillar_1.4.3
[83] lifecycle_0.2.0 BiocManager_1.30.10
[85] data.table_1.12.8 bitops_1.0-6
[87] httpuv_1.5.2 rtracklayer_1.44.4
[89] R6_2.4.1 promises_1.1.0
[91] gridExtra_2.3 codetools_0.2-16
[93] MASS_7.3-51.5 assertthat_0.2.1
[95] rhdf5_2.28.0 openssl_1.4.1
[97] rprojroot_1.3-2 withr_2.1.2
[99] GenomicAlignments_1.20.1 Rsamtools_2.0.1
[101] GenomeInfoDbData_1.2.1 hms_0.5.3
[103] grid_3.6.1 tidyr_1.0.2
[105] base64_2.0 rmarkdown_2.1
[107] DelayedMatrixStats_1.8.0 illuminaio_0.28.0
[109] git2r_0.26.1 shiny_1.3.2