Differential methylation analysis
Jovana Maksimovic
12/17/2018
Last updated: 2020-12-22
Checks: 7 0
Knit directory: paed-cf-methylation/
This reproducible R Markdown analysis was created with workflowr (version 1.6.2). The Checks tab describes the reproducibility checks that were applied when the results were created. The Past versions tab lists the development history.
Great! Since the R Markdown file has been committed to the Git repository, you know the exact version of the code that produced these results.
Great job! The global environment was empty. Objects defined in the global environment can affect the analysis in your R Markdown file in unknown ways. For reproduciblity it's best to always run the code in an empty environment.
The command set.seed(20200224) was run prior to running the code in the R Markdown file. Setting a seed ensures that any results that rely on randomness, e.g. subsampling or permutations, are reproducible.
Great job! Recording the operating system, R version, and package versions is critical for reproducibility.
Nice! There were no cached chunks for this analysis, so you can be confident that you successfully produced the results during this run.
Great job! Using relative paths to the files within your workflowr project makes it easier to run your code on other machines.
Great! You are using Git for version control. Tracking code development and connecting the code version to the results is critical for reproducibility.
The results in this page were generated with repository version 2f428c8. See the Past versions tab to see a history of the changes made to the R Markdown and HTML files.
Note that you need to be careful to ensure that all relevant files for the analysis have been committed to Git prior to generating the results (you can use wflow_publish or wflow_git_commit). workflowr only checks the R Markdown file, but you know if there are other scripts or data files that it depends on. Below is the status of the Git repository when the results were generated:
Ignored files:
    Ignored:    .DS_Store
    Ignored:    .Rhistory
    Ignored:    .Rproj.user/
    Ignored:    code/DNAm-based-age-predictor/
    Ignored:    data/.DS_Store
    Ignored:    data/1-year-old-cohort-with-data.csv
    Ignored:    data/9-year-old-cohort-as-pairs-with-data.csv
    Ignored:    data/9-year-old-cohort-as-pairs.xlsx
    Ignored:    data/BMI-Data.csv
    Ignored:    data/BMI-Data.xlsx
    Ignored:    data/CFGeneModifiers.csv
    Ignored:    data/Flow-Data-for-Reference-Panel-Original copy.csv
    Ignored:    data/Flow-Data-for-Reference-Panel-Original.csv
    Ignored:    data/Flow-Data-for-Reference-Panel-Scaled copy.csv
    Ignored:    data/Flow-Data-for-Reference-Panel-Scaled.csv
    Ignored:    data/Flow-Data-for-Reference-Panel.xls
    Ignored:    data/Horvath-27k-probes.csv
    Ignored:    data/Horvath-coefficients.csv
    Ignored:    data/Horvath-methylation-data.csv
    Ignored:    data/Horvath-mini-annotation.csv
    Ignored:    data/Horvath-sample-data.csv
    Ignored:    data/ageFile-final.txt
    Ignored:    data/arsq.rds
    Ignored:    data/idat-new/
    Ignored:    data/idat/
    Ignored:    data/loglrt.rds
    Ignored:    data/processedData.RData
    Ignored:    data/processedDataNew-old.RData
    Ignored:    data/processedDataNew.RData
    Ignored:    data/rawPatientBetas.rds
    Ignored:    data/~$9-year-old-cohort-as-pairs.xlsx
    Ignored:    output/Horvath-output.csv
    Ignored:    output/Horvath-output2.csv
    Ignored:    output/age.pred
    Ignored:    output/case-ctrl-oneyr-ruv-sig-adj-betas-expanded.csv
    Ignored:    output/case-ctrl-oneyr-ruv-sig-adj-betas.csv
    Ignored:    output/case-ctrl-oneyr-ruv.csv
    Ignored:    output/case-ctrl-oneyr.csv
    Ignored:    output/case-ctrl-paired.csv
    Ignored:    output/stderr.txt
    Ignored:    output/stdout.txt

Untracked files:
    Untracked:  MethylResolver.txt
    Untracked:  code/test.R
Note that any generated files, e.g. HTML, png, CSS, etc., are not included in this status report because it is ok for generated content to have uncommitted changes.
These are the previous versions of the repository in which changes were made to the R Markdown (analysis/ruvAnalysis.Rmd) and HTML (docs/ruvAnalysis.html) files. If you've configured a remote Git repository (see ?wflow_git_remote), click on the hyperlinks in the table below to view the files as they were in that past version.
| File | Version | Author | Date | Message |
|---|---|---|---|---|
| Rmd | 2f428c8 | JovMaksimovic | 2020-12-22 | wflow_publish("analysis/ruvAnalysis.Rmd") |
| html | a14c5e5 | JovMaksimovic | 2020-12-18 | Build site. |
| Rmd | 9c9a461 | JovMaksimovic | 2020-12-18 | wflow_publish(c("analysis/ruvAnalysis.Rmd", "analysis/dataExploreNew.Rmd")) |
| html | 4d80118 | JovMaksimovic | 2020-12-18 | Build site. |
| Rmd | 369ed18 | JovMaksimovic | 2020-12-18 | wflow_publish(c("analysis/ruvAnalysis.Rmd")) |
| Rmd | a8eb262 | JovMaksimovic | 2020-07-24 | Added new cohort data exploration and processing. |
| html | e0ca843 | Jovana Maksimovic | 2020-03-16 | Build site. |
| html | bb534b3 | Jovana Maksimovic | 2020-03-16 | Build site. |
| Rmd | d72d26d | Jovana Maksimovic | 2020-03-16 | wflow_publish("analysis/ruvAnalysis.Rmd") |
Differential methylation between cases and controls accounting for cell proportions
Load packages necessary for analysis.
library(here)
library(workflowr)
#Load Packages Required for Analysis
library(limma)
library(minfi)
library(RColorBrewer)
library(missMethyl)
library(matrixStats)
library(minfiData)
library(IlluminaHumanMethylationEPICanno.ilm10b4.hg19)
library(IlluminaHumanMethylationEPICmanifest)
library(FlowSorted.Blood.EPIC)
library(NMF)
library(ruv)
library(ggplot2)
Load raw and processed data objects generated by exploratory analysis.
load(here("data/processedDataNew.RData"))
source(here("code/functions.R"))
Identify cell type discriminating probes using the any and both method (both selects an equal number (50) of probes (with F-stat p-value < 1E-8) with the greatest magnitude of effect from the hyper and hypo methylated sides; or any, which selects the 100 probes (with F-stat p-value < 1E-8) with the greatest magnitude of difference regardless of direction of effect.).
mSetSqFlt$CellType <- as.character(targets$Sample_Group)
noSexProbes <- rownames(mSetSqFlt) %in% rownames(mValsNoXY)

pAny <- minfi:::pickCompProbes(mSet = mSetSqFlt[noSexProbes, cells],
                               probeSelect = "any",
                       numProbes = 50, compositeCellType = "Lavage",
                       cellTypes = unique(targets$Sample_Group[cells]))
pBoth <- minfi:::pickCompProbes(mSet = mSetSqFlt[noSexProbes, cells],
                                probeSelect = "both",
                       numProbes = 50, compositeCellType = "Lavage",
                       cellTypes = unique(targets$Sample_Group[cells]))
Use a heatmap to visulalise the methylation of the cell type discriminating probes in the cell sorted samples.
par(mfrow=c(1,2))
aheatmap(bValsNoXY[rownames(bValsNoXY) %in% rownames(pAny$coefEsts), cells],
         annCol = as.character(targets$Sample_Group[cells]), labCol = NA, labRow = NA,
         main="Any")

aheatmap(bValsNoXY[rownames(bValsNoXY) %in% rownames(pBoth$coefEsts), cells],
         annCol = as.character(targets$Sample_Group[cells]), labCol = NA, labRow = NA,
         main="Both")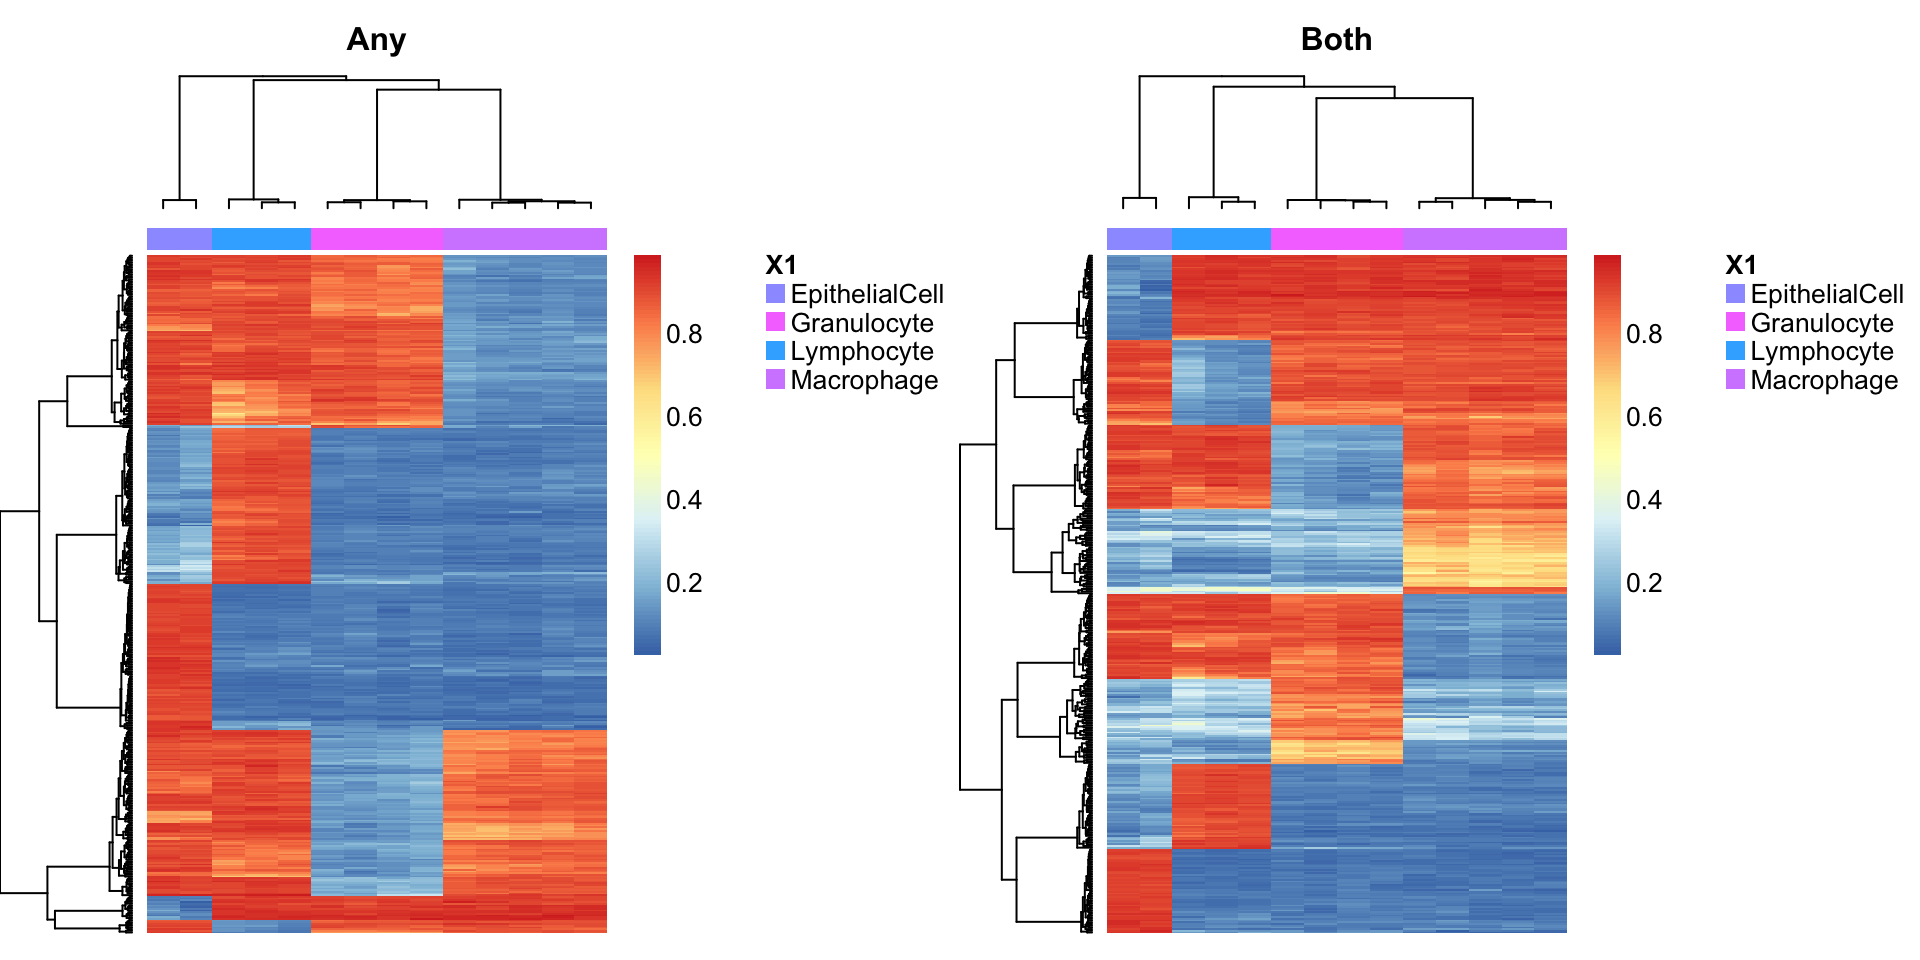
Use a heatmap to visualise the methylation of the cell type discriminating probes in the patient samples.
patients <- patients & targets$Sample_run == "Old"
par(mfrow=c(1,2))
aheatmap(bValsNoXY[rownames(bValsNoXY) %in% rownames(pAny$coefEsts), patients],
         annCol = as.character(targets$Sample_Group[patients]), labCol = NA, labRow = NA,
         main="Any")
aheatmap(bValsNoXY[rownames(bValsNoXY) %in% rownames(pBoth$coefEsts), patients],
         annCol = as.character(targets$Sample_Group[patients]), labCol = NA, labRow = NA,
         main="Both")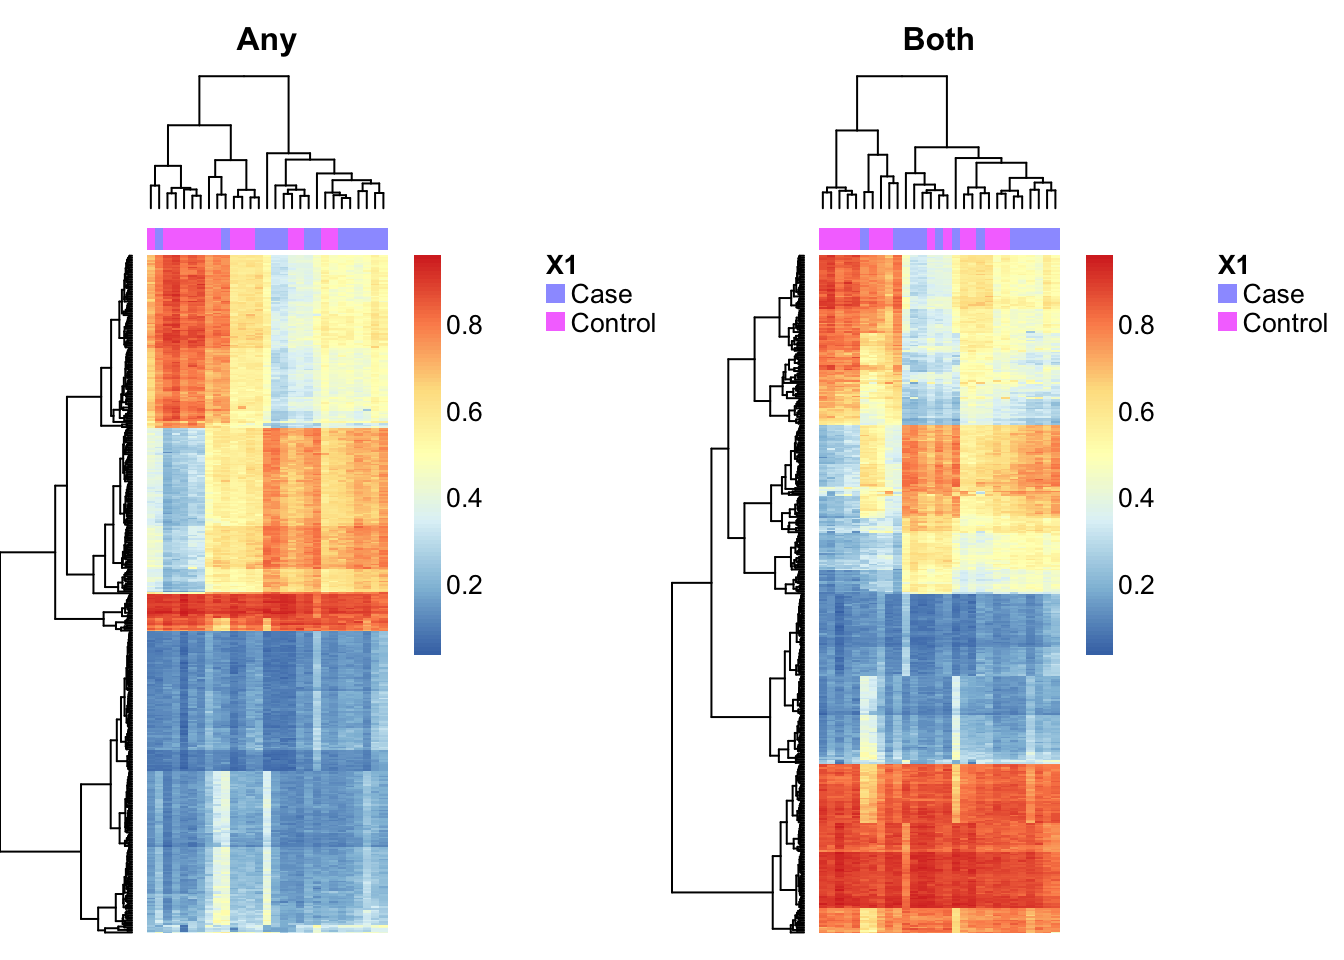
Combine the any and both sets of cell type discriminating probes into a single, non-redundant set of cell type discriminating probes.
pAll <- union(rownames(pAny$coefEsts),rownames(pBoth$coefEsts))
par(mfrow=c(1,2))
aheatmap(bValsNoXY[rownames(bValsNoXY) %in% pAll, cells],
         annCol = as.character(targets$Sample_Group[cells]), labCol = NA, labRow = NA,
         main="All (Sorted cells)")
aheatmap(bValsNoXY[rownames(bValsNoXY) %in% pAll, patients],
         annCol = as.character(targets$Sample_Group[patients]), labCol = NA, labRow = NA,
         main="All (Patients)")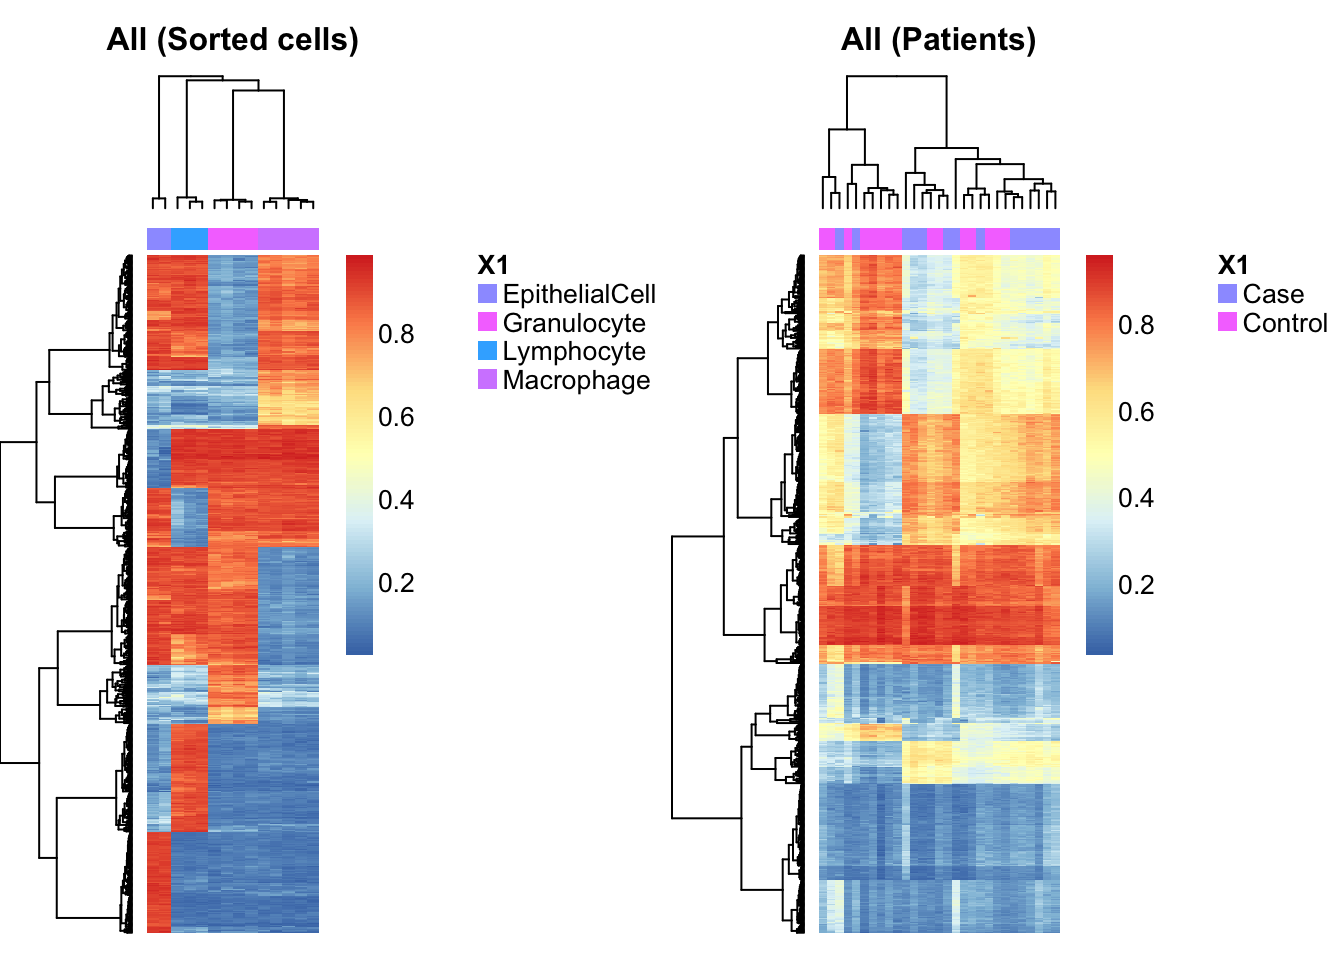
length(pAll)[1] 576aheatmap(bValsNoXY[rownames(bValsNoXY) %in% pAll, cells],
annCol = list(CellType=as.character(targets$Sample_Group[cells])),
labCol = NA, labRow = NA)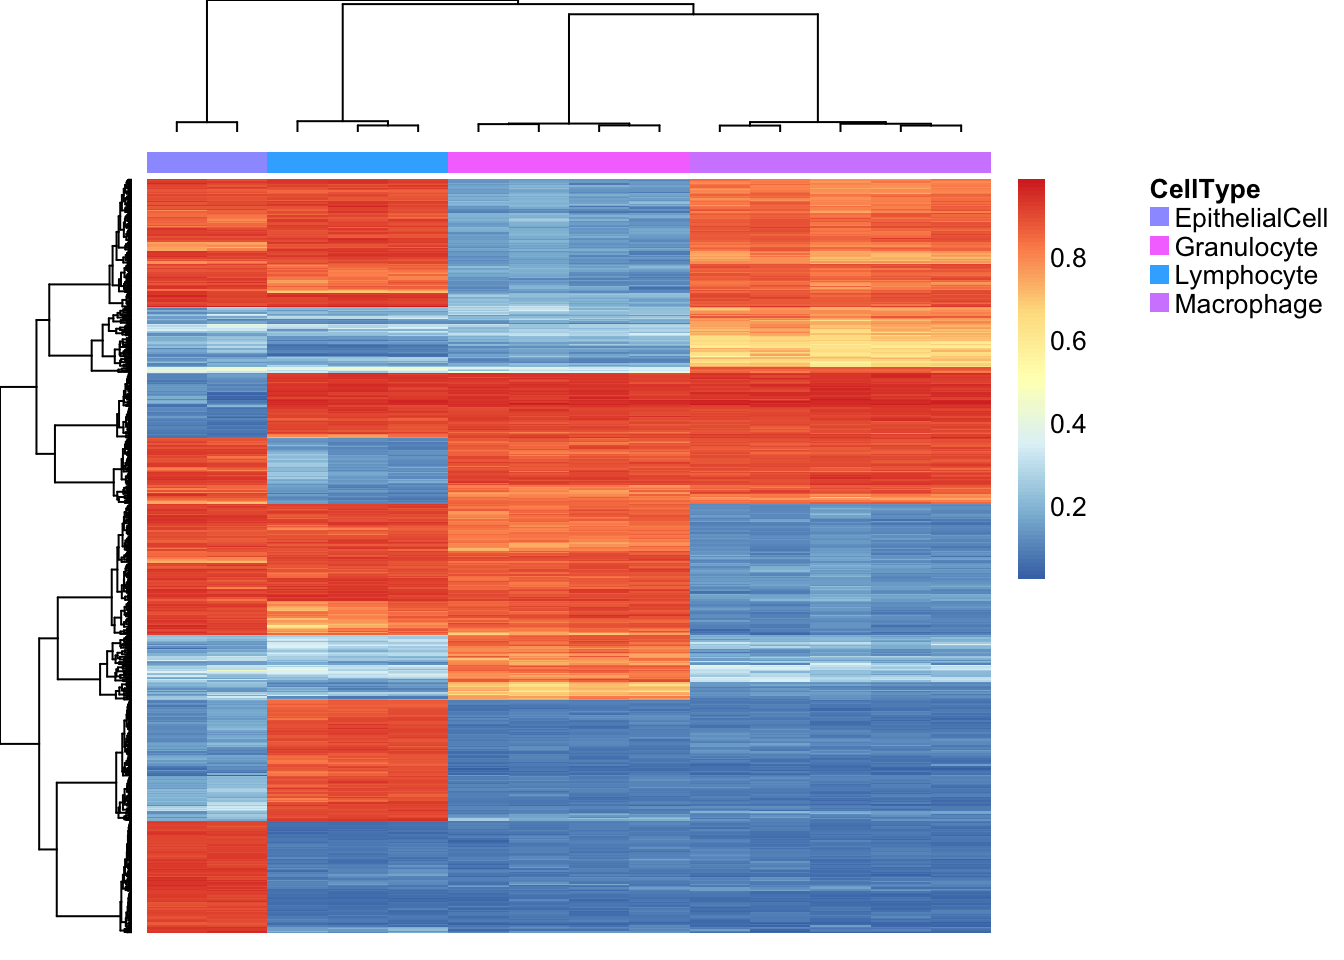
| Version | Author | Date |
|---|---|---|
| 4d80118 | JovMaksimovic | 2020-12-18 |
RUV analysis
Data exploration
Using a relative log expression (RLE) plot, we look for any batch effects or obvious sources of technical variation in the data. As all of our arrays were processed and run in a single batch, we do not observed any significant technical artifacts in the data (medians line up and bars are fairly uniform across samples).
YA <- t(mValsNoXY[,patients])Looking at the top 2 principal compontents calculated based on ALL probes, we see that there is a tendency for the samples to group by case/control status but not sex.
gg_additions <- list(aes(color = targets$Sample_Group[patients],
                         shape = targets$Sex[patients],
                         size = 5, alpha = .7),
                     labs(color = "Status", shape = "Sex"),
                     scale_size_identity(guide = "none"),
                     scale_alpha(guide = "none"),
                     theme(legend.text = element_text(size = 12),
                           legend.title = element_text(size = 16)),
                     guides(color = guide_legend(override.aes = list(size = 4)),
                            shape = guide_legend(override.aes = list(size = 4))))
options(repr.plot.width = 8, repr.plot.height = 6)
ruv_svdplot(YA) + gg_additions
Warning: Removed 1 rows containing missing values (geom_point).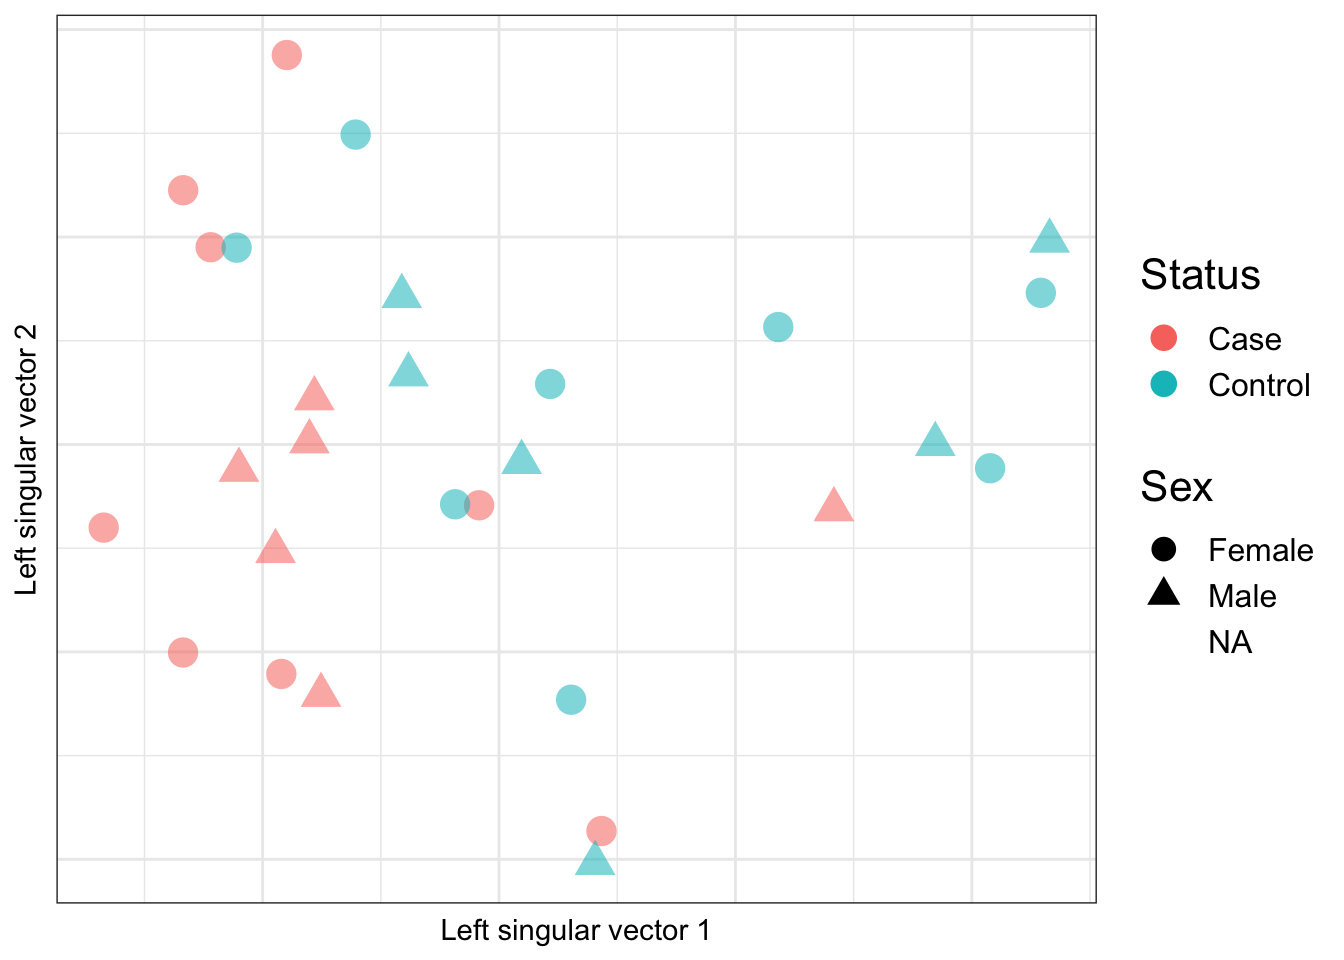
Looking at the top 2 principal compontents calculated based on the negative control cell type discriminating probes, we see that there is also tendency for the samples to group by case/control status but not sex. This suggests that case/control status is associated with cell type proportion. We already saw from the previous analysis that granulocyte and macrophage proportions are significantly different between cases and controls.
ctl <- rownames(mValsNoXY) %in% pAll
ruv_svdplot(YA[,ctl]) + gg_additions
Warning: Removed 1 rows containing missing values (geom_point).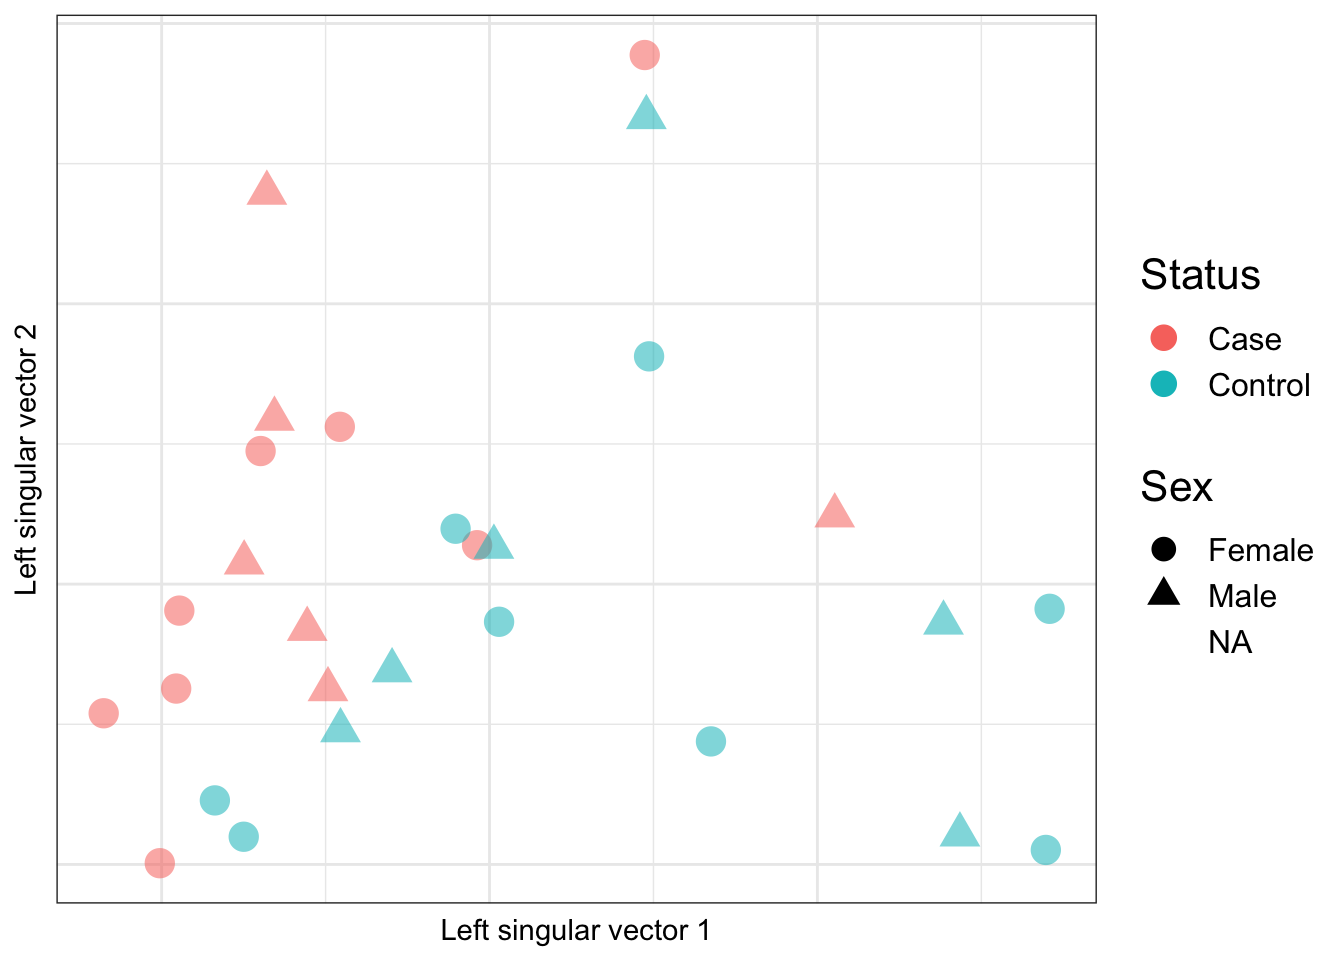
Use scree plots to examine how much of the variation is explained by the various components in the data. For ALL the probes, most of the variation is captured by about the top 5 principal components. For just the cell discriminating probes, most of the variation is captured by about the top 3 principal components.
caseCtrl <- factor(targets$Sample_Group[patients])
design <- model.matrix(~caseCtrl, data=targets)

table(ctl)
ctl
FALSE TRUE
695188 576 ruv_scree(YA)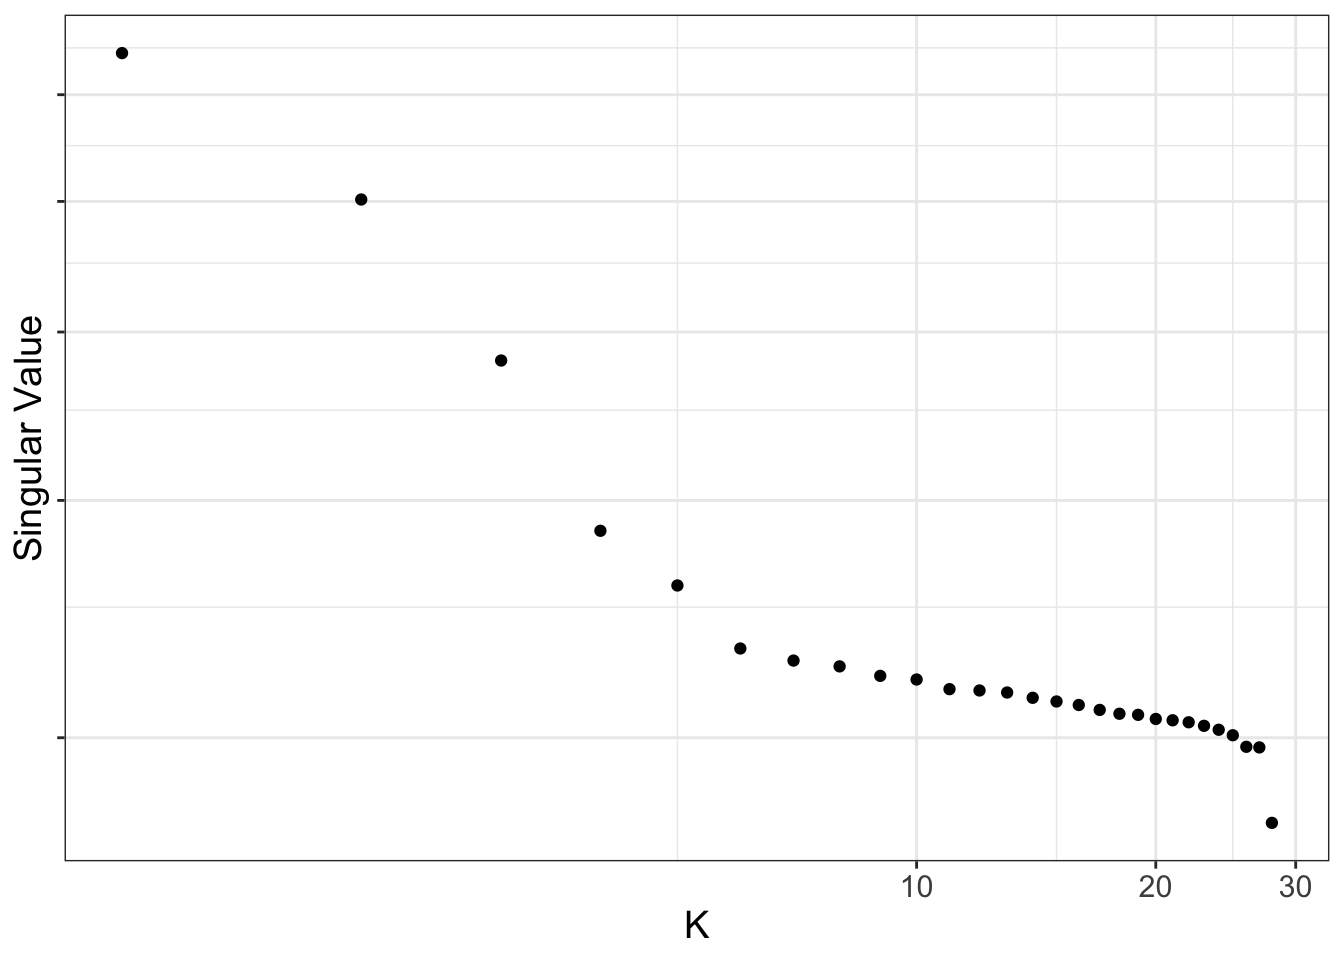
ruv_scree(YA[,ctl])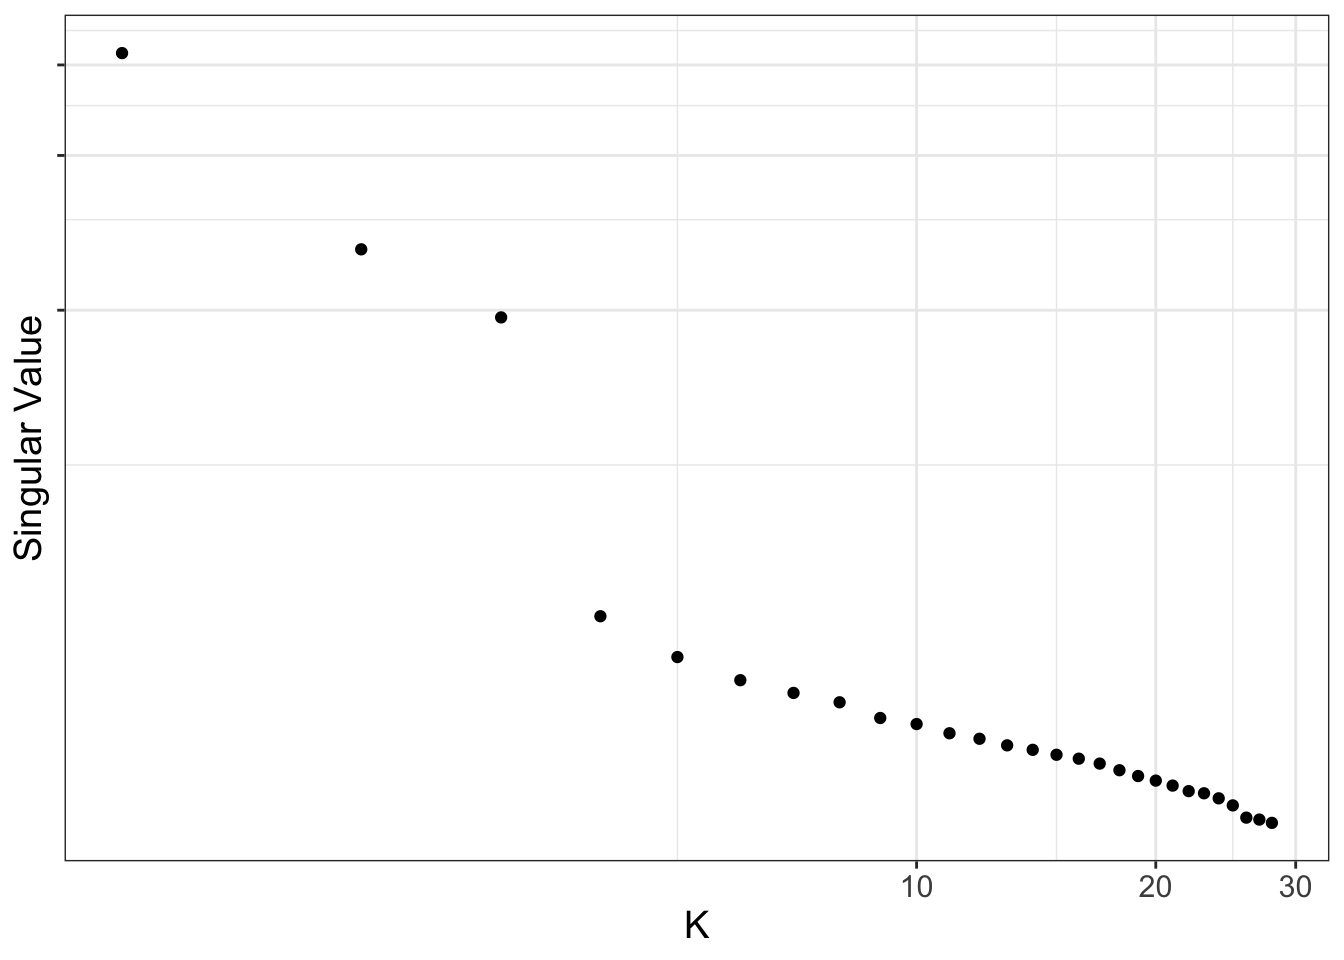
| Version | Author | Date |
|---|---|---|
| 4d80118 | JovMaksimovic | 2020-12-18 |
In order to select an optimal value for k, we should plot, for each value of k, the square of the first canonical correlation between case/control status and the first K principal components in the data and just the cell type probes. We can see that the first principal component is more highly correlated with case/ctonrol status in the cell type probes than full data set and then the second and third component show about equal correlation with case/control status in both the complete data and cell type probes.
ruv_cancorplot(YA, caseCtrl, ctl)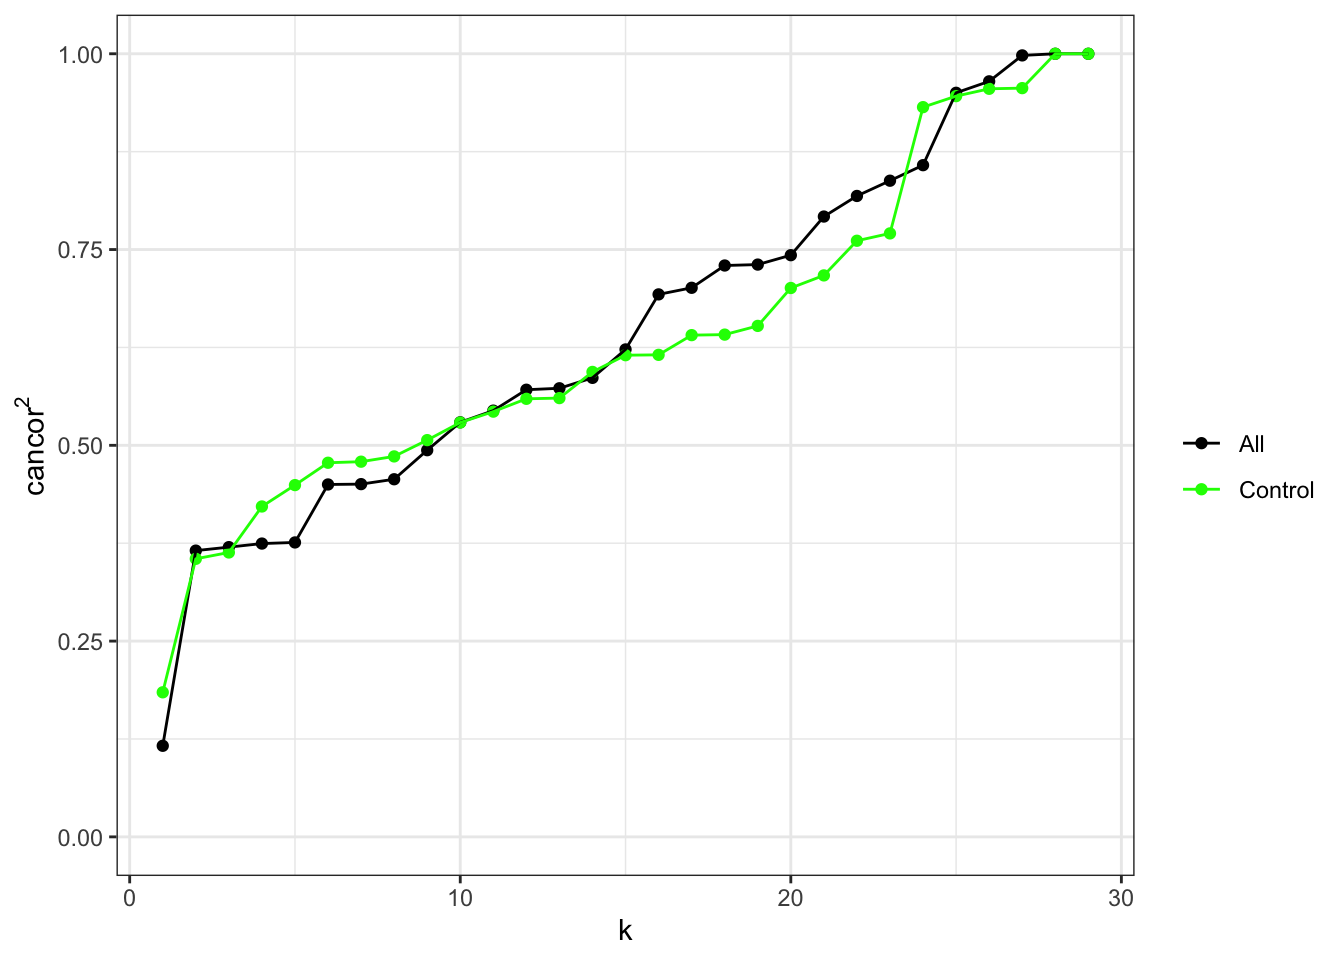
| Version | Author | Date |
|---|---|---|
| 4d80118 | JovMaksimovic | 2020-12-18 |
Unadjusted analysis
We first run and unadjusted differential methylation analysis comparing cases and controls. We see that 140 of our cell type probes are associated with case/control status at FDR < 0.1. We will therefore exclude these from our cell type probe set.
fit_unadj <- RUV4(YA, X = caseCtrl, ctl = ctl, k = 0)
annSub <- annEPIC[match(rownames(mValsNoXY),annEPIC$Name),]
fit_unadj.summary <- ruv_summary(YA, fit_unadj, colinfo = annSub)

table(fit_unadj.summary$C$p.BH_X1.Control < 0.1)
 FALSE   TRUE
673683  22081
table(fit_unadj.summary$C$fit.ctl[fit_unadj.summary$C$p.BH_X1.Control < 0.1])
FALSE TRUE
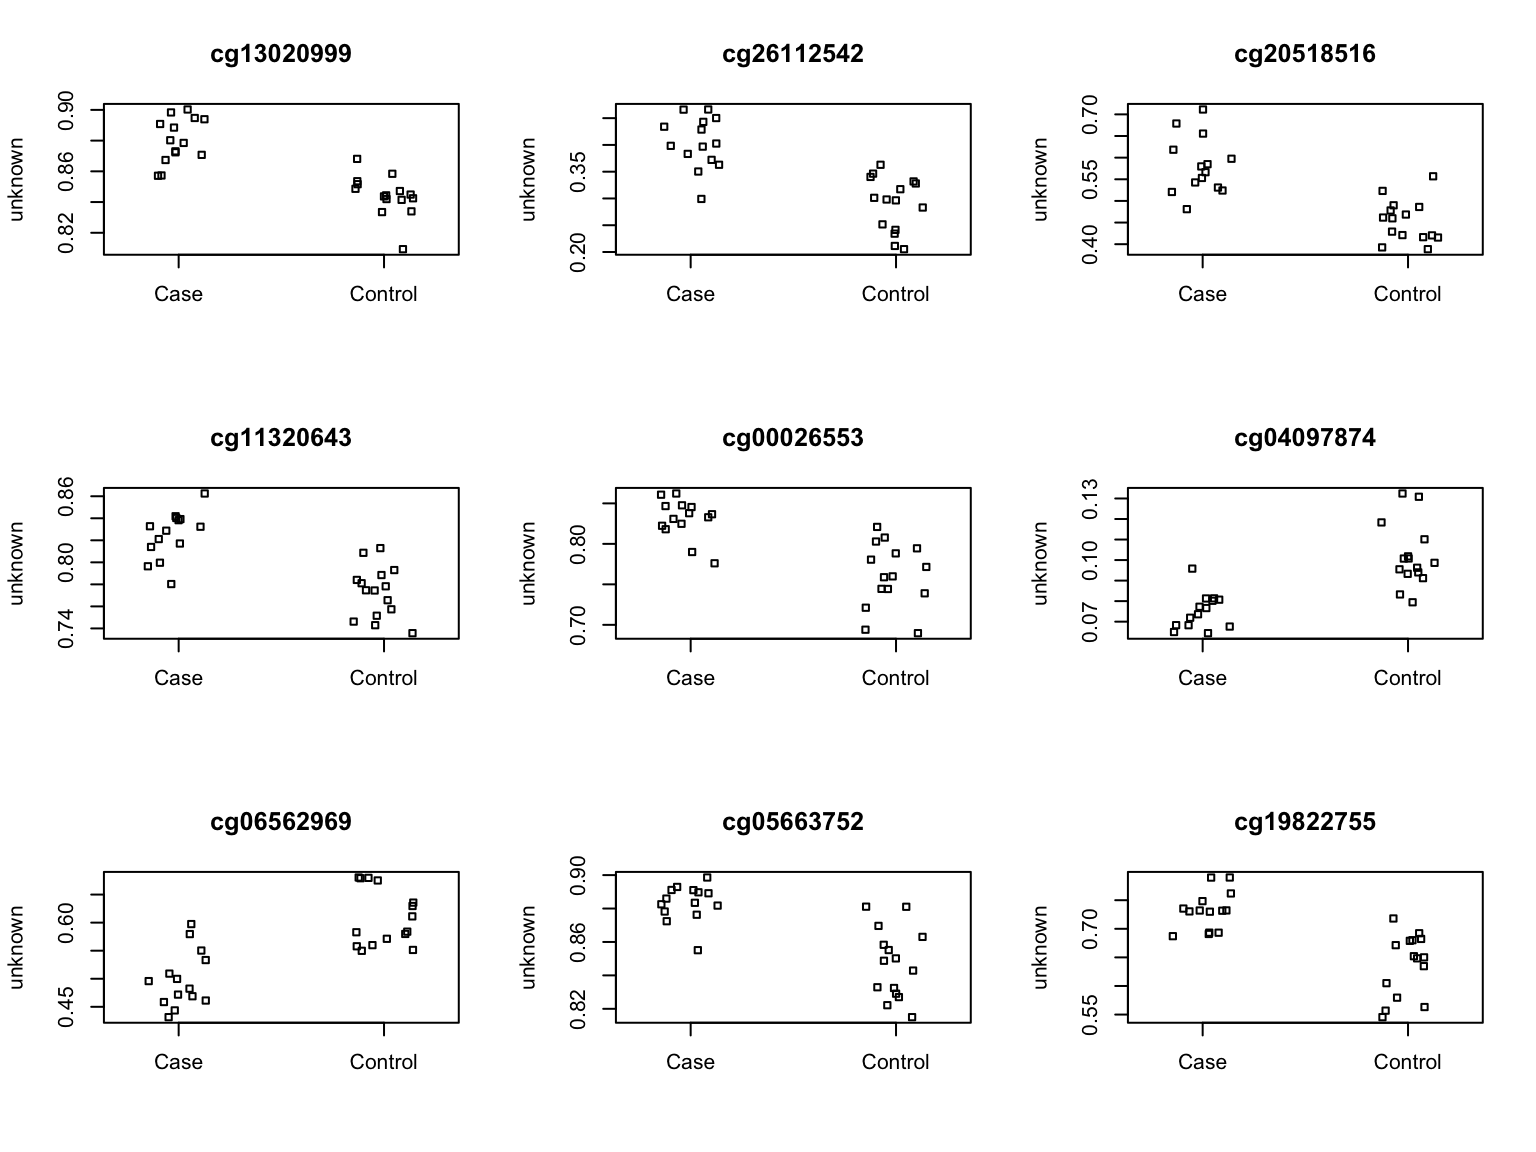
21926 155 Top 9 ranked CpGs for unadjusted analysis.
par(mfrow=c(3,3))
sapply(1:9,function(i){
  plotCpg(bValsNoXY[,patients],cpg=rownames(fit_unadj.summary$C)[i],pheno=caseCtrl)
})
| Version | Author | Date |
|---|---|---|
| 4d80118 | JovMaksimovic | 2020-12-18 |
[[1]]
NULL

[[2]]
NULL

[[3]]
NULL

[[4]]
NULL

[[5]]
NULL

[[6]]
NULL

[[7]]
NULL

[[8]]
NULL

[[9]]
NULL
Exclude cell type probes significantly associated with case/control status from the negative control set prior to performing an adjusted analysis.
keep <- !pAll %in% rownames(fit_unadj.summary$C)[fit_unadj.summary$C$fit.ctl == TRUE &
                                                   fit_unadj.summary$C$p.BH_X1.Control < 0.1]
pKeep <- pAll[keep]
length(pKeep)
[1] 421RUV4-adjusted analysis
Repeat canonical correlation plot now that CpGs associated with case/control in unadjusted analysis have been excluded from the set of negative control cell type probes.
ctl <- rownames(mValsNoXY) %in% pKeep
ruv_cancorplot(YA, caseCtrl, ctl)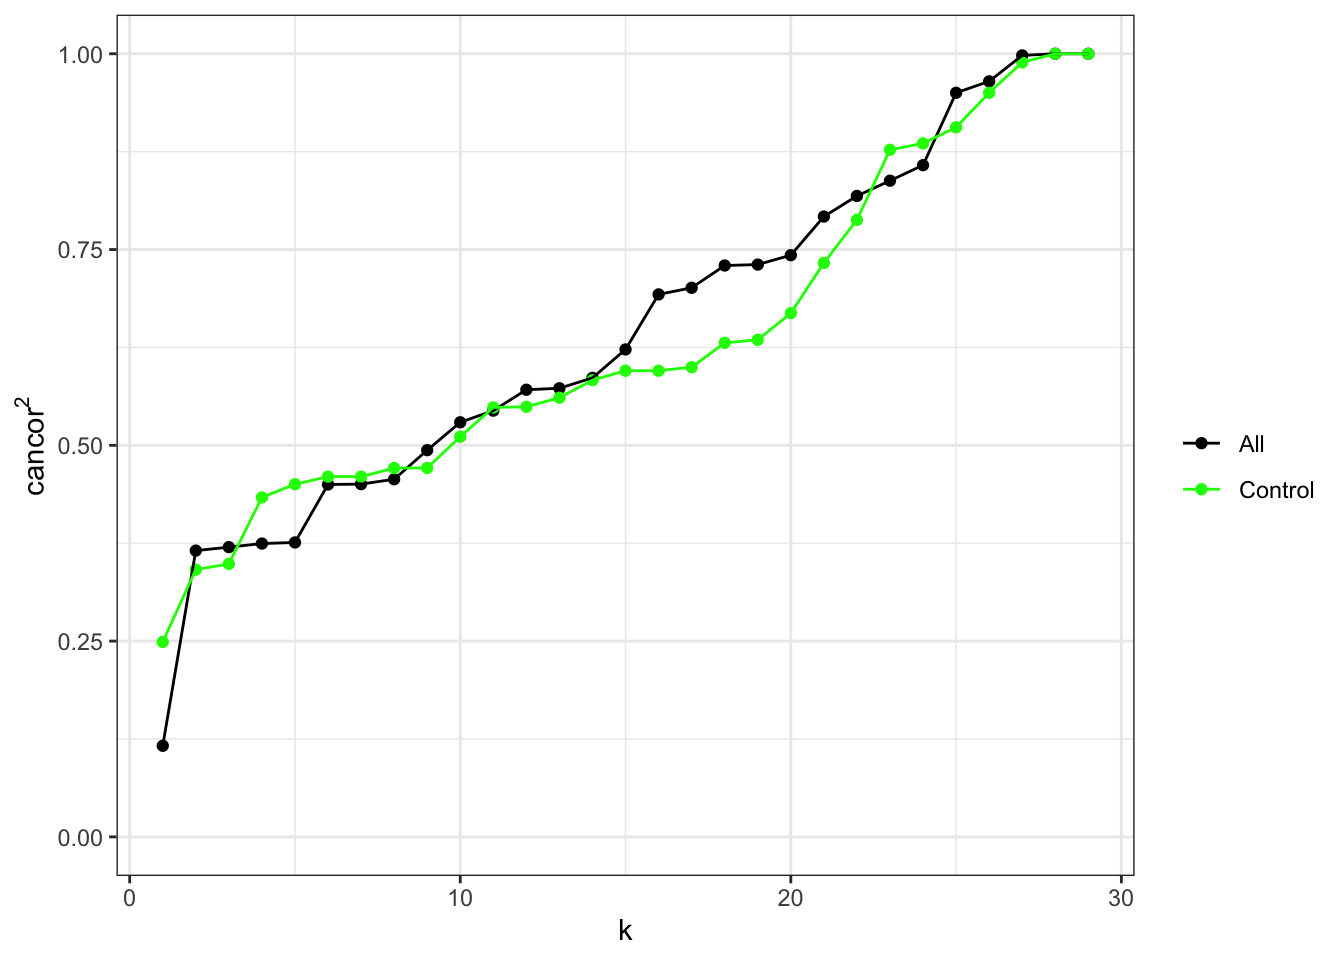
| Version | Author | Date |
|---|---|---|
| 4d80118 | JovMaksimovic | 2020-12-18 |
RUV4 adjusted analysis for k=3.
fit <- RUV4(YA, X = caseCtrl, ctl = ctl, k = 3, Z = 1, eta = NULL,
            fullW0 = NULL, inputcheck = TRUE)

fitsum <- ruv_summary(YA, fit, colinfo = annSub[,c("chr","pos","strand",
                                                   "UCSC_RefGene_Name",
                                                   "UCSC_RefGene_Group")])
head(fitsum$C,10)
F.p F.p.BH p_X1.Control p.BH_X1.Control b_X1.Control
cg09069203 9.164167e-07 0.3833844 9.164167e-07 0.3833844 -0.4449318
cg14573826 1.644671e-06 0.3833844 1.644671e-06 0.3833844 0.5069386
cg06440065 1.653080e-06 0.3833844 1.653080e-06 0.3833844 0.6770298
cg24545338 2.916152e-06 0.4069494 2.916152e-06 0.4069494 -0.6848828
cg13349671 3.388332e-06 0.4069494 3.388332e-06 0.4069494 0.5228843
cg14527280 3.815051e-06 0.4069494 3.815051e-06 0.4069494 -0.7601811
cg26586287 4.094270e-06 0.4069494 4.094270e-06 0.4069494 0.4594433
cg25963583 5.006228e-06 0.4353941 5.006228e-06 0.4353941 -0.6175816
cg17410093 6.566973e-06 0.4515460 6.566973e-06 0.4515460 0.3636232
cg12202341 6.619903e-06 0.4515460 6.619903e-06 0.4515460 0.3929656
sigma2 var.b_X1.Control fit.ctl mean chr pos strand
cg09069203 0.02419181 0.005077728 FALSE 1.841098 chr1 214251836 -
cg14573826 0.03370886 0.007075304 FALSE 2.666418 chr14 65409667 +
cg06440065 0.06016182 0.012627636 FALSE -2.394294 chr19 30206617 -
cg24545338 0.06608186 0.013870219 FALSE -2.777350 chr14 31343687 +
cg13349671 0.03925970 0.008240394 FALSE -3.289752 chr12 120105332 +
cg14527280 0.08424962 0.017683531 FALSE -3.090168 chr6 3458119 -
cg26586287 0.03105616 0.006518517 FALSE 3.786366 chr11 94613673 +
cg25963583 0.05759780 0.012089461 FALSE 1.122894 chr14 65539104 -
cg17410093 0.02069317 0.004343382 FALSE 2.447854 chr2 232650620 +
cg12202341 0.02419332 0.005078044 FALSE 3.223121 chr9 131977681 -
UCSC_RefGene_Name
cg09069203
cg14573826 GPX2;GPX2;GPX2;CHURC1-FNTB;CHURC1-FNTB
cg06440065 C19orf12;C19orf12
cg24545338 COCH;COCH
cg13349671 PRKAB1
cg14527280 SLC22A23
cg26586287
cg25963583 MAX;MAX
cg17410093 COPS7B;COPS7B;COPS7B;COPS7B;COPS7B;COPS7B
cg12202341
UCSC_RefGene_Group
cg09069203
cg14573826 TSS200;TSS200;TSS200;Body;Body
cg06440065 TSS200;TSS1500
cg24545338 TSS200;TSS200
cg13349671 TSS1500
cg14527280 TSS1500
cg26586287
cg25963583 Body;Body
cg17410093 TSS1500;TSS1500;TSS1500;TSS1500;5'UTR;Body
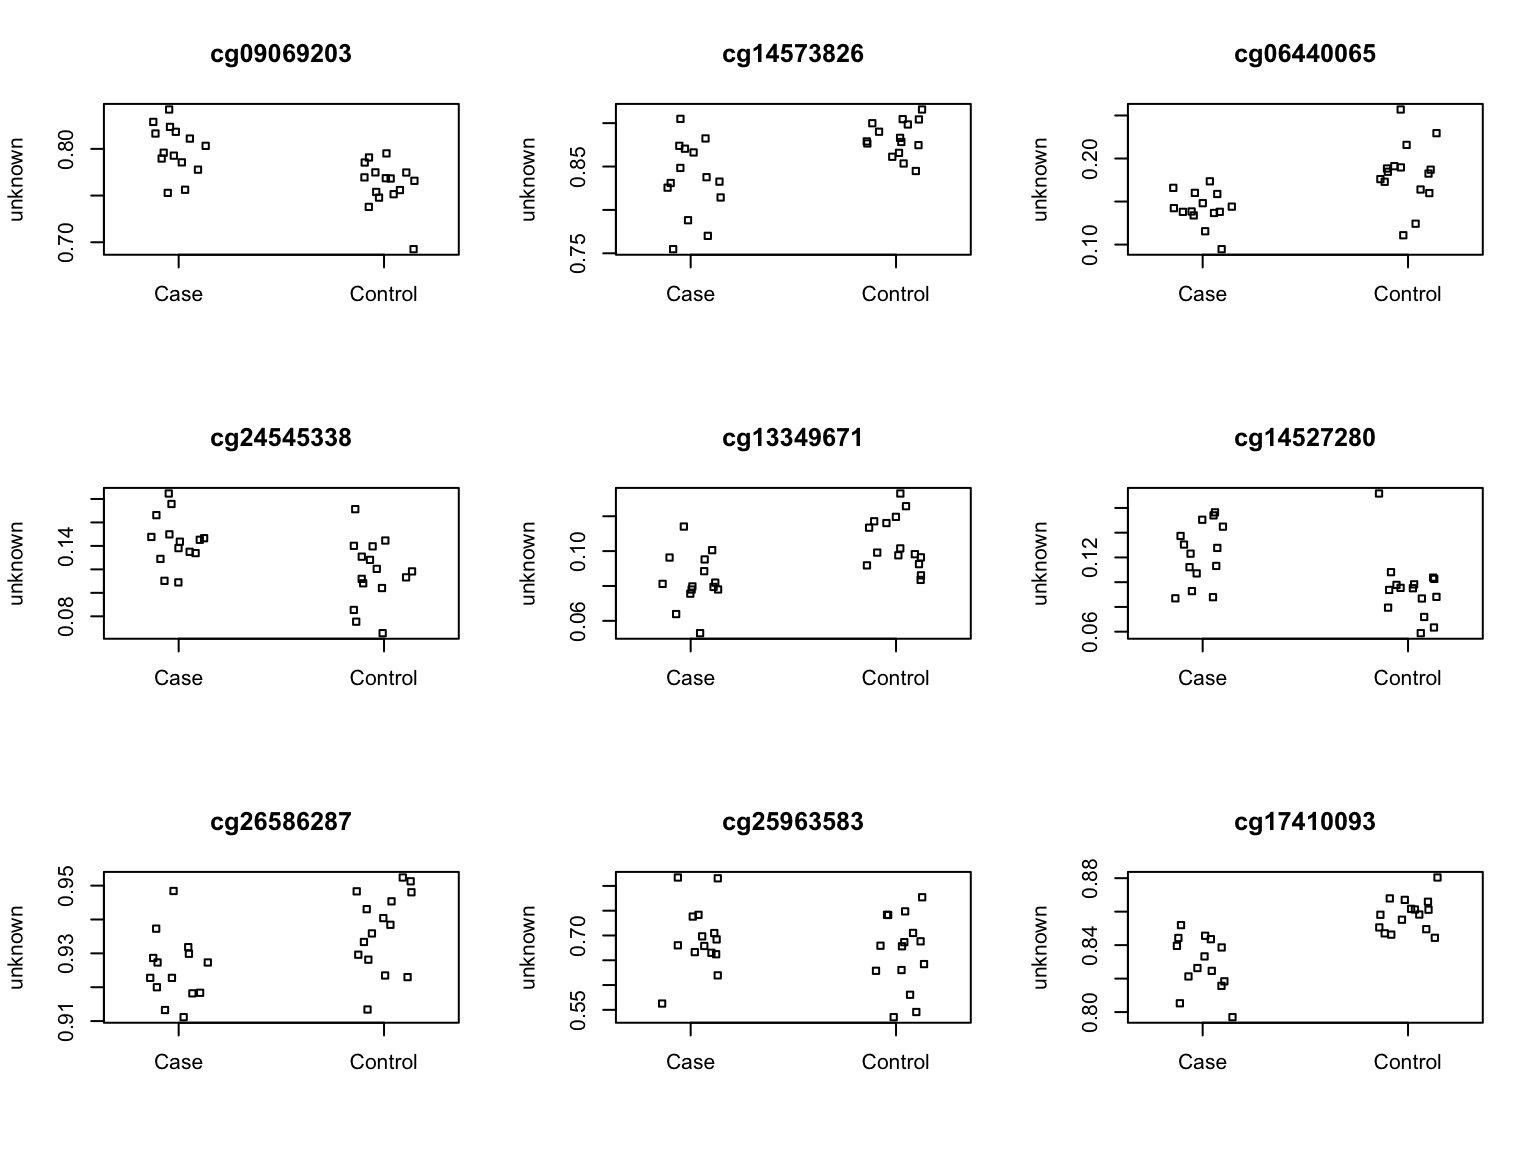
cg12202341 Top 9 ranked CpGs for k=3.
par(mfrow=c(3,3))
sapply(1:9,function(i){
  plotCpg(bValsNoXY[,patients],cpg=rownames(fitsum$C)[i],pheno=caseCtrl)
})
| Version | Author | Date |
|---|---|---|
| 4d80118 | JovMaksimovic | 2020-12-18 |
[[1]]
NULL

[[2]]
NULL

[[3]]
NULL

[[4]]
NULL

[[5]]
NULL

[[6]]
NULL

[[7]]
NULL

[[8]]
NULL

[[9]]
NULL
RUV4-adjusted analysis: only CF gene modifiers
cfGenes <- read.csv(here("data/CFGeneModifiers.csv"), stringsAsFactors = FALSE)

flatAnn <- missMethyl:::.getFlatAnnotation(array.type = "EPIC",
                                           anno = annEPIC)
subAnn <- flatAnn[flatAnn$symbol %in% cfGenes$Gene,]

mValSub <- t(mValsNoXY[rownames(mValsNoXY) %in% unique(union(subAnn$cpg, pKeep)),
                 patients])
ctl <- colnames(mValSub) %in% pKeep

fit <- RUV4(mValSub, X = caseCtrl, ctl = ctl, k = 5, Z = 1, eta = NULL,
            fullW0 = NULL, inputcheck = TRUE)

fitsum <- ruv_summary(mValSub, fit, colinfo = annSub[annSub$Name %in% colnames(mValSub),
                                                     c("chr","pos","strand",
                                                   "UCSC_RefGene_Name",
                                                   "UCSC_RefGene_Group")])
head(fitsum$C,n=10)
F.p F.p.BH p_X1.Control p.BH_X1.Control b_X1.Control
cg16636767 0.0005268029 0.4879727 0.0005268029 0.4879727 0.2430327
cg11012463 0.0013711082 0.4879727 0.0013711082 0.4879727 -0.2407009
cg21883598 0.0014110094 0.4879727 0.0014110094 0.4879727 -0.2566826
cg18898017 0.0016757516 0.4879727 0.0016757516 0.4879727 0.2128519
cg10593292 0.0020185550 0.4879727 0.0020185550 0.4879727 0.2826402
cg14645244 0.0022499096 0.4879727 0.0022499096 0.4879727 -0.6061063
cg24767336 0.0022940289 0.4879727 0.0022940289 0.4879727 0.5765023
cg09330885 0.0050990711 0.7486010 0.0050990711 0.7486010 0.6123106
cg24622817 0.0052909138 0.7486010 0.0052909138 0.7486010 -0.1963949
cg09152047 0.0054080981 0.7486010 0.0054080981 0.7486010 0.3522835
sigma2 var.b_X1.Control fit.ctl mean chr pos
cg16636767 0.01750993 0.003765788 TRUE 0.5790899 chr11 13694647
cg11012463 0.02092180 0.004499564 TRUE -2.1069535 chr1 33804514
cg21883598 0.02394248 0.005149211 FALSE -2.5780640 chr15 45404157
cg18898017 0.01710562 0.003678834 FALSE 2.3128086 chr17 39681660
cg10593292 0.03146888 0.006767883 FALSE 1.5974498 chr3 195539133
cg14645244 0.14841761 0.031919564 FALSE 0.4023847 chr6 32552205
cg24767336 0.13488780 0.029009763 FALSE -2.7719695 chr19 41860095
cg09330885 0.18592748 0.039986657 FALSE 1.0235882 chr3 195536485
cg24622817 0.01931851 0.004154752 TRUE -2.8003555 chr22 40859826
cg09152047 0.06252729 0.013447486 FALSE -3.6501088 chr1 110282835
strand UCSC_RefGene_Name
cg16636767 + FAR1
cg11012463 + PHC2;PHC2
cg21883598 + DUOX2
cg18898017 + KRT19
cg10593292 + MUC4;MUC4;MUC4;MUC4;MUC4;MUC4
cg14645244 - HLA-DRB1
cg24767336 - TGFB1
cg09330885 - MUC4;MUC4;MUC4
cg24622817 - MKL1;MKL1;MKL1;MKL1
cg09152047 + GSTM3;GSTM3
UCSC_RefGene_Group
cg16636767 5'UTR
cg11012463 5'UTR;Body
cg21883598 Body
cg18898017 Body
cg10593292 5'UTR;1stExon;5'UTR;1stExon;1stExon;5'UTR
cg14645244 Body
cg24767336 TSS1500
cg09330885 Body;Body;Body
cg24622817 TSS1500;5'UTR;5'UTR;5'UTR
cg09152047 Body;Body
sessionInfo()R version 4.0.3 (2020-10-10)
Platform: x86_64-apple-darwin17.0 (64-bit)
Running under: macOS Mojave 10.14.6
Matrix products: default
BLAS: /Library/Frameworks/R.framework/Versions/4.0/Resources/lib/libRblas.dylib
LAPACK: /Library/Frameworks/R.framework/Versions/4.0/Resources/lib/libRlapack.dylib
locale:
[1] en_AU.UTF-8/en_AU.UTF-8/en_AU.UTF-8/C/en_AU.UTF-8/en_AU.UTF-8
attached base packages:
[1] stats4 parallel stats graphics grDevices utils datasets
[8] methods base
other attached packages:
[1] ggplot2_3.3.2
[2] ruv_0.9.7.1
[3] NMF_0.23.0
[4] cluster_2.1.0
[5] rngtools_1.5
[6] pkgmaker_0.32.2
[7] registry_0.5-1
[8] FlowSorted.Blood.EPIC_1.8.0
[9] ExperimentHub_1.16.0
[10] AnnotationHub_2.22.0
[11] BiocFileCache_1.14.0
[12] dbplyr_2.0.0
[13] nlme_3.1-151
[14] quadprog_1.5-8
[15] genefilter_1.72.0
[16] IlluminaHumanMethylationEPICmanifest_0.3.0
[17] minfiData_0.36.0
[18] IlluminaHumanMethylation450kmanifest_0.4.0
[19] missMethyl_1.24.0
[20] IlluminaHumanMethylationEPICanno.ilm10b4.hg19_0.6.0
[21] IlluminaHumanMethylation450kanno.ilmn12.hg19_0.6.0
[22] RColorBrewer_1.1-2
[23] minfi_1.36.0
[24] bumphunter_1.32.0
[25] locfit_1.5-9.4
[26] iterators_1.0.13
[27] foreach_1.5.1
[28] Biostrings_2.58.0
[29] XVector_0.30.0
[30] SummarizedExperiment_1.20.0
[31] Biobase_2.50.0
[32] MatrixGenerics_1.2.0
[33] matrixStats_0.57.0
[34] GenomicRanges_1.42.0
[35] GenomeInfoDb_1.26.2
[36] IRanges_2.24.1
[37] S4Vectors_0.28.1
[38] BiocGenerics_0.36.0
[39] limma_3.46.0
[40] here_1.0.1
[41] workflowr_1.6.2
loaded via a namespace (and not attached):
[1] plyr_1.8.6 splines_4.0.3
[3] BiocParallel_1.24.1 gridBase_0.4-7
[5] digest_0.6.27 htmltools_0.5.0
[7] magrittr_2.0.1 memoise_1.1.0
[9] doParallel_1.0.16 readr_1.4.0
[11] annotate_1.68.0 askpass_1.1
[13] siggenes_1.64.0 prettyunits_1.1.1
[15] colorspace_2.0-0 blob_1.2.1
[17] rappdirs_0.3.1 xfun_0.19
[19] dplyr_1.0.2 crayon_1.3.4
[21] RCurl_1.98-1.2 GEOquery_2.58.0
[23] survival_3.2-7 glue_1.4.2
[25] gtable_0.3.0 zlibbioc_1.36.0
[27] DelayedArray_0.16.0 Rhdf5lib_1.12.0
[29] HDF5Array_1.18.0 scales_1.1.1
[31] DBI_1.1.0 Rcpp_1.0.5
[33] xtable_1.8-4 progress_1.2.2
[35] bit_4.0.4 mclust_5.4.7
[37] preprocessCore_1.52.0 httr_1.4.2
[39] ellipsis_0.3.1 farver_2.0.3
[41] pkgconfig_2.0.3 reshape_0.8.8
[43] XML_3.99-0.5 labeling_0.4.2
[45] reshape2_1.4.4 tidyselect_1.1.0
[47] rlang_0.4.9 later_1.1.0.1
[49] AnnotationDbi_1.52.0 munsell_0.5.0
[51] BiocVersion_3.12.0 tools_4.0.3
[53] generics_0.1.0 RSQLite_2.2.1
[55] fastmap_1.0.1 evaluate_0.14
[57] stringr_1.4.0 yaml_2.2.1
[59] org.Hs.eg.db_3.12.0 knitr_1.30
[61] bit64_4.0.5 fs_1.5.0
[63] beanplot_1.2 scrime_1.3.5
[65] purrr_0.3.4 doRNG_1.8.2
[67] sparseMatrixStats_1.2.0 mime_0.9
[69] whisker_0.4 nor1mix_1.3-0
[71] xml2_1.3.2 biomaRt_2.46.0
[73] compiler_4.0.3 rstudioapi_0.13
[75] curl_4.3 interactiveDisplayBase_1.28.0
[77] tibble_3.0.4 statmod_1.4.35
[79] stringi_1.5.3 GenomicFeatures_1.42.1
[81] lattice_0.20-41 Matrix_1.2-18
[83] multtest_2.46.0 vctrs_0.3.6
[85] pillar_1.4.7 lifecycle_0.2.0
[87] rhdf5filters_1.2.0 BiocManager_1.30.10
[89] data.table_1.13.4 bitops_1.0-6
[91] httpuv_1.5.4 rtracklayer_1.50.0
[93] R6_2.5.0 promises_1.1.1
[95] gridExtra_2.3 codetools_0.2-18
[97] MASS_7.3-53 assertthat_0.2.1
[99] rhdf5_2.34.0 openssl_1.4.3
[101] rprojroot_2.0.2 withr_2.3.0
[103] GenomicAlignments_1.26.0 Rsamtools_2.6.0
[105] GenomeInfoDbData_1.2.4 hms_0.5.3
[107] grid_4.0.3 tidyr_1.1.2
[109] base64_2.0 rmarkdown_2.6
[111] DelayedMatrixStats_1.12.1 illuminaio_0.32.0
[113] git2r_0.27.1 shiny_1.5.0