Age-related changes in cell-type compositions
Propeller Analysis
Gunjan Dixit
June 21, 2024
Last updated: 2024-06-21
Checks: 5 2
Knit directory: paed-airway-allTissues/
This reproducible R Markdown analysis was created with workflowr (version 1.7.1). The Checks tab describes the reproducibility checks that were applied when the results were created. The Past versions tab lists the development history.
The R Markdown file has unstaged changes. To know which version of
the R Markdown file created these results, you’ll want to first commit
it to the Git repo. If you’re still working on the analysis, you can
ignore this warning. When you’re finished, you can run
wflow_publish to commit the R Markdown file and build the
HTML.
Great job! The global environment was empty. Objects defined in the global environment can affect the analysis in your R Markdown file in unknown ways. For reproduciblity it’s best to always run the code in an empty environment.
The command set.seed(20230811) was run prior to running
the code in the R Markdown file. Setting a seed ensures that any results
that rely on randomness, e.g. subsampling or permutations, are
reproducible.
Great job! Recording the operating system, R version, and package versions is critical for reproducibility.
Nice! There were no cached chunks for this analysis, so you can be confident that you successfully produced the results during this run.
Using absolute paths to the files within your workflowr project makes it difficult for you and others to run your code on a different machine. Change the absolute path(s) below to the suggested relative path(s) to make your code more reproducible.
| absolute | relative |
|---|---|
| ~/projects/paed-airway-atlas/airway-atlas-allTissues/paed-airway-allTissues/output/RDS/AllBatches_Clustering_SEUs/ | output/RDS/AllBatches_Clustering_SEUs |
Great! You are using Git for version control. Tracking code development and connecting the code version to the results is critical for reproducibility.
The results in this page were generated with repository version 4fa7db5. See the Past versions tab to see a history of the changes made to the R Markdown and HTML files.
Note that you need to be careful to ensure that all relevant files for
the analysis have been committed to Git prior to generating the results
(you can use wflow_publish or
wflow_git_commit). workflowr only checks the R Markdown
file, but you know if there are other scripts or data files that it
depends on. Below is the status of the Git repository when the results
were generated:
Ignored files:
    Ignored:    .DS_Store
    Ignored:    .RData
    Ignored:    .Rhistory
    Ignored:    .Rproj.user/
    Ignored:    analysis/.DS_Store
    Ignored:    analysis/figure/
    Ignored:    data/.DS_Store
    Ignored:    data/RDS/
    Ignored:    output/.DS_Store
    Ignored:    output/CSV/.DS_Store
    Ignored:    output/G000231_Neeland_batch1/
    Ignored:    output/G000231_Neeland_batch2_1/
    Ignored:    output/G000231_Neeland_batch2_2/
    Ignored:    output/G000231_Neeland_batch3/
    Ignored:    output/G000231_Neeland_batch4/
    Ignored:    output/G000231_Neeland_batch5/
    Ignored:    output/G000231_Neeland_batch9_1/
    Ignored:    output/RDS/
    Ignored:    output/plots/

Untracked files:
    Untracked:  analysis/03_Batch_Integration.Rmd
    Untracked:  analysis/Age_proportions.Rmd
    Untracked:  analysis/Age_proportions_AllBatches.Rmd
    Untracked:  analysis/Batch_Integration_&_Downstream_analysis.Rmd
    Untracked:  analysis/Batch_correction_&_Downstream.Rmd
    Untracked:  analysis/Cell_cycle_regression.Rmd
    Untracked:  analysis/Preprocessing_Batch1_Nasal_brushings.Rmd
    Untracked:  analysis/Preprocessing_Batch2_Tonsils.Rmd
    Untracked:  analysis/Preprocessing_Batch3_Adenoids.Rmd
    Untracked:  analysis/Preprocessing_Batch4_Bronchial_brushings.Rmd
    Untracked:  analysis/Preprocessing_Batch5_Nasal_brushings.Rmd
    Untracked:  analysis/Preprocessing_Batch6_BAL.Rmd
    Untracked:  analysis/Preprocessing_Batch7_Bronchial_brushings.Rmd
    Untracked:  analysis/Preprocessing_Batch8_Adenoids.Rmd
    Untracked:  analysis/Preprocessing_Batch9_Tonsils.Rmd
    Untracked:  analysis/cell_cycle_regression.R
    Untracked:  analysis/test.Rmd
    Untracked:  analysis/testing_age_all.Rmd
    Untracked:  data/Cell_labels_Mel/
    Untracked:  data/Hs.c2.cp.reactome.v7.1.entrez.rds
    Untracked:  data/Raw_feature_bc_matrix/
    Untracked:  data/celltypes_Mel_GD_v3.xlsx
    Untracked:  data/celltypes_Mel_GD_v4_no_dups.xlsx
    Untracked:  data/celltypes_Mel_modified.xlsx
    Untracked:  data/celltypes_Mel_v2.csv
    Untracked:  data/celltypes_Mel_v2.xlsx
    Untracked:  data/celltypes_Mel_v2_MN.xlsx
    Untracked:  data/celltypes_for_mel_MN.xlsx
    Untracked:  data/earlyAIR_sample_sheets_combined.xlsx
    Untracked:  output/CSV/Bronchial_brushings_Marker_gene_clusters.limmaTrendRNA_snn_res.0.4/

Unstaged changes:
    Deleted:    02_QC_exploratoryPlots.Rmd
    Deleted:    02_QC_exploratoryPlots.html
    Modified:   analysis/00_AllBatches_overview.Rmd
    Modified:   analysis/01_QC_emptyDrops.Rmd
    Modified:   analysis/02_QC_exploratoryPlots.Rmd
    Modified:   analysis/Adenoids.Rmd
    Modified:   analysis/Age_modeling.Rmd
    Modified:   analysis/AllBatches_QCExploratory.Rmd
    Modified:   analysis/Tonsils.Rmd
Note that any generated files, e.g. HTML, png, CSS, etc., are not included in this status report because it is ok for generated content to have uncommitted changes.
These are the previous versions of the repository in which changes were
made to the R Markdown (analysis/Age_modeling.Rmd) and HTML
(docs/Age_modeling.html) files. If you’ve configured a
remote Git repository (see ?wflow_git_remote), click on the
hyperlinks in the table below to view the files as they were in that
past version.
| File | Version | Author | Date | Message |
|---|---|---|---|---|
| Rmd | 0a358ce | Gunjan Dixit | 2024-05-24 | Added QC analysis |
| html | 0a358ce | Gunjan Dixit | 2024-05-24 | Added QC analysis |
| Rmd | 14f8a5e | Gunjan Dixit | 2024-05-24 | Added age analysis |
| html | 14f8a5e | Gunjan Dixit | 2024-05-24 | Added age analysis |
Introduction
This analysis investigates age-related changes in cell-type
proportions across different tissues of the earlyAIR project. Cell-type
proportions are determined using the propeller package.
Linear models are applied to transformed proportions and raw proportions
to examine the effect of continuous age, sex, and batch.
suppressPackageStartupMessages({
  library(here)
  library(glue)
  library(patchwork)
  library(Seurat)
  library(dplyr)
  library(tidyverse)
  library(gridExtra)
  library(paletteer)
  library(viridis)
  library(ggforce)
  library(tidyverse)
  library(scran)
  library(ggridges)
  library(speckle)
  library(edgeR)
  library(kableExtra)
  library(dplyr)
  library(limma)
  library(knitr)
  library(openxlsx)
})
Load data
data_path <- here("output/RDS/AllBatches_Azimuth_noDoublets_SEUs/")
rds_files <- list.files(data_path, pattern = "\\.rds$", full.names = TRUE)

tissues <- c("Nasal_brushings", "Tonsils", "Adenoids", "Bronchial_brushings", "Nasal_brushings", "BAL", "Bronchial_brushings", "Adenoids", "Tonsils" )

seurat_objects <- lapply(rds_files, function(file) {
  seu <- readRDS(file)
  seu$tissue <- tools::file_path_sans_ext(basename(file))
  return(seu)
})

names(seurat_objects) <- tissues
merge_batches <- function(tissue_name, batches) {
objs_to_merge <- seurat_objects[batches]
merged <- Reduce(function(x, y) merge(x, y, add.cell.ids = batches), objs_to_merge)
return(merged)
}
# Merge batches for each tissue
adenoids <- merge_batches("Adenoids", c(3, 8))
tonsils <- merge_batches("Tonsils", c(2, 9))
nasal_brushings <- merge_batches("Nasal_brushings", c(1, 5))
bronchial_brushings <- seurat_objects[[which(tissues == "Bronchial_brushings")[1]]]
bal <- seurat_objects[[which(tissues == "BAL")[1]]]
merged_list <- list(
"Adenoids" = adenoids,
"Tonsils" = tonsils,
"Nasal_brushings" = nasal_brushings,
"Bronchial_brushings" = bronchial_brushings,
"BAL" = bal
)
merged_list## For BAL (Samples aggregated into one)
#head(merged_list[["BAL"]]@meta.data)
merged_list[["BAL"]]@meta.data$Sample <- sub("_\\d+$", "", merged_list[["BAL"]]@meta.data$Sample)
#head(merged_list[["BAL"]]@meta.data)Sample-wise Proportions of batch-integrated data
data_path <- here("~/projects/paed-airway-atlas/airway-atlas-allTissues/paed-airway-allTissues/output/RDS/AllBatches_Clustering_SEUs/")
batch_corrected <- list.files(data_path, pattern = "\\.rds$", full.names = TRUE)

ordered_tissues <- c("Adenoids", "Tonsils", "Nasal_brushings", "Bronchial_brushings", "BAL")

batch_corrected <- batch_corrected[order(match(sapply(strsplit(basename(batch_corrected), "_"), `[`, 3), ordered_tissues))]

palette1 <- paletteer::paletteer_d("ggthemes::Classic_20")
palette2 <- paletteer::paletteer_d("Polychrome::light")
combined_palette <- unique(c(palette1, palette2))

labels <- c("Broad_cell_label_1", "Broad_cell_label_2", "Broad_cell_label_3", "cell_labels")

for (file in batch_corrected) {
  tissue_obj <- readRDS(file)
  tissue_name <- unique(tissue_obj$tissue)
  batch_name <- unique(tissue_obj$batch_name)
  tissue_plots <- list()

  for (label in labels) {
    label_plots <- list()

    for (batch in unique(tissue_obj$batch_name)) {
      batch_data <- tissue_obj@meta.data %>%
        filter(batch_name == batch)

      p1 <- ggplot(batch_data, aes(x = !!sym(label), fill = !!sym(label))) +
        geom_bar() +
        geom_text(aes(label = ..count..), stat = "count", vjust = -0.5, colour = "black", size = 2) +
        scale_y_log10() +
        theme(axis.text.x = element_blank(), axis.title.x = element_blank(), axis.ticks.x = element_blank()) +
        labs(y = "No. Cells (log scale)", title = paste(tissue_name, "-", batch)) + NoLegend()

      p2 <- batch_data %>%
        select(!!sym(label), Sample) %>%
        group_by(!!sym(label), Sample) %>%
        summarise(num = n(), .groups = 'drop') %>%
        mutate(prop = num / sum(num) * 100) %>%
        ggplot(aes(x = !!sym(label), y = prop, fill = Sample)) +
        geom_bar(stat = "identity") +
        theme(axis.text.x = element_text(angle = 90, vjust = 0.5, hjust = 1, size = 8)) +
        labs(y = "% Cells", fill = "Sample", title = paste(tissue_name, "-", batch)) +
        scale_fill_manual(values = combined_palette)

      combined_plot <- (p1 / p2) +
        theme(legend.text = element_text(size = 8), legend.key.size = unit(3, "mm"))

      label_plots[[batch]] <- combined_plot
    }

    combined_label_plots <- wrap_plots(label_plots, ncol = length(unique(tissue_obj$batch_name)))
    tissue_plots[[label]] <- combined_label_plots
  }

  cat('### ', tissue_name, '\n')
  print(tissue_plots)
}

gc()
Sample-wise Proportions without batch-integration
for (tissue_name in names(merged_list)) {
  tissue_obj <- merged_list[[tissue_name]]

  tissue_plots <- list()
  labels <- c("Broad_cell_label_1", "Broad_cell_label_2", "Broad_cell_label_3")

  for (label in labels) {
    label_plots <- list()

    for (batch in unique(tissue_obj$batch_name)) {
      batch_data <- tissue_obj@meta.data %>%
        filter(batch_name == batch)

      p1 <- ggplot(batch_data, aes(x = !!sym(label), fill = !!sym(label))) +
        geom_bar() +
        geom_text(aes(label = ..count..), stat = "count", vjust = -0.5, colour = "black", size = 2) +
        scale_y_log10() +
        theme(axis.text.x = element_blank(), axis.title.x = element_blank(), axis.ticks.x = element_blank()) +
        labs(y = "No. Cells (log scale)", title = paste(tissue_name, "-", batch)) + NoLegend()

      p2 <- batch_data %>%
        select(!!sym(label), Sample) %>%
        group_by(!!sym(label), Sample) %>%
        summarise(num = n(), .groups = 'drop') %>%
        mutate(prop = num / sum(num) * 100) %>%
        ggplot(aes(x = !!sym(label), y = prop, fill = Sample)) +
        geom_bar(stat = "identity") +
        theme(axis.text.x = element_text(angle = 90, vjust = 0.5, hjust = 1, size = 8)) +
        labs(y = "% Cells", fill = "Sample", title = paste(tissue_name, "-", batch)) +
        scale_fill_manual(values = combined_palette)

      combined_plot <- (p1 / p2) +
        theme(legend.text = element_text(size = 8), legend.key.size = unit(3, "mm"))

      label_plots[[batch]] <- combined_plot
    }

    combined_label_plots <- wrap_plots(label_plots, ncol = length(unique(tissue_obj$batch_name)))
    tissue_plots[[label]] <- combined_label_plots
  }

  cat('### ', tissue_name, '\n')
  print(tissue_plots)
}
Calculate Proportions using Propeller
data_path <- here("~/projects/paed-airway-atlas/airway-atlas-allTissues/paed-airway-allTissues/output/RDS/AllBatches_Clustering_SEUs")
batch_corrected <- list.files(data_path, pattern = "\\.rds$", full.names = TRUE)
tissues <- c("Adenoids", "BAL", "Bronchial_brushings", "Nasal_brushings", "Tonsils")
seurat_objects <- lapply(batch_corrected, function(file) {
seu <- readRDS(file)
seu$tissue <- tools::file_path_sans_ext(basename(file))
return(seu)
})
names(seurat_objects) <- tissues
for (tissue_name in names(seurat_objects)) {
tissue_obj <- seurat_objects[[tissue_name]]
props <- getTransformedProps(clusters = tissue_obj$cell_labels,
sample = tissue_obj$Sample, transform = "asin")
cat('### ', tissue_name, '\n')
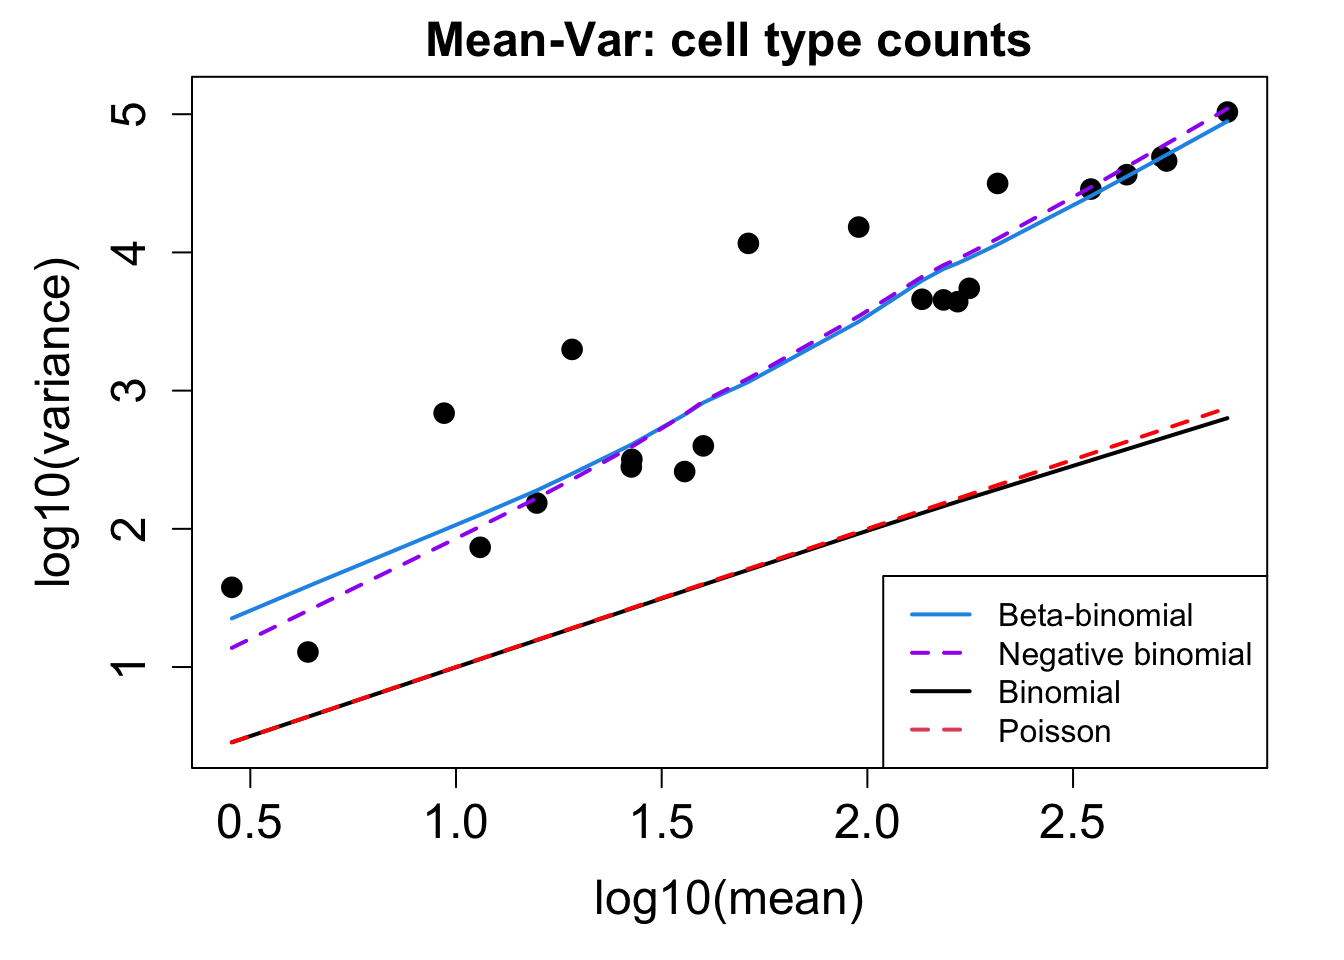
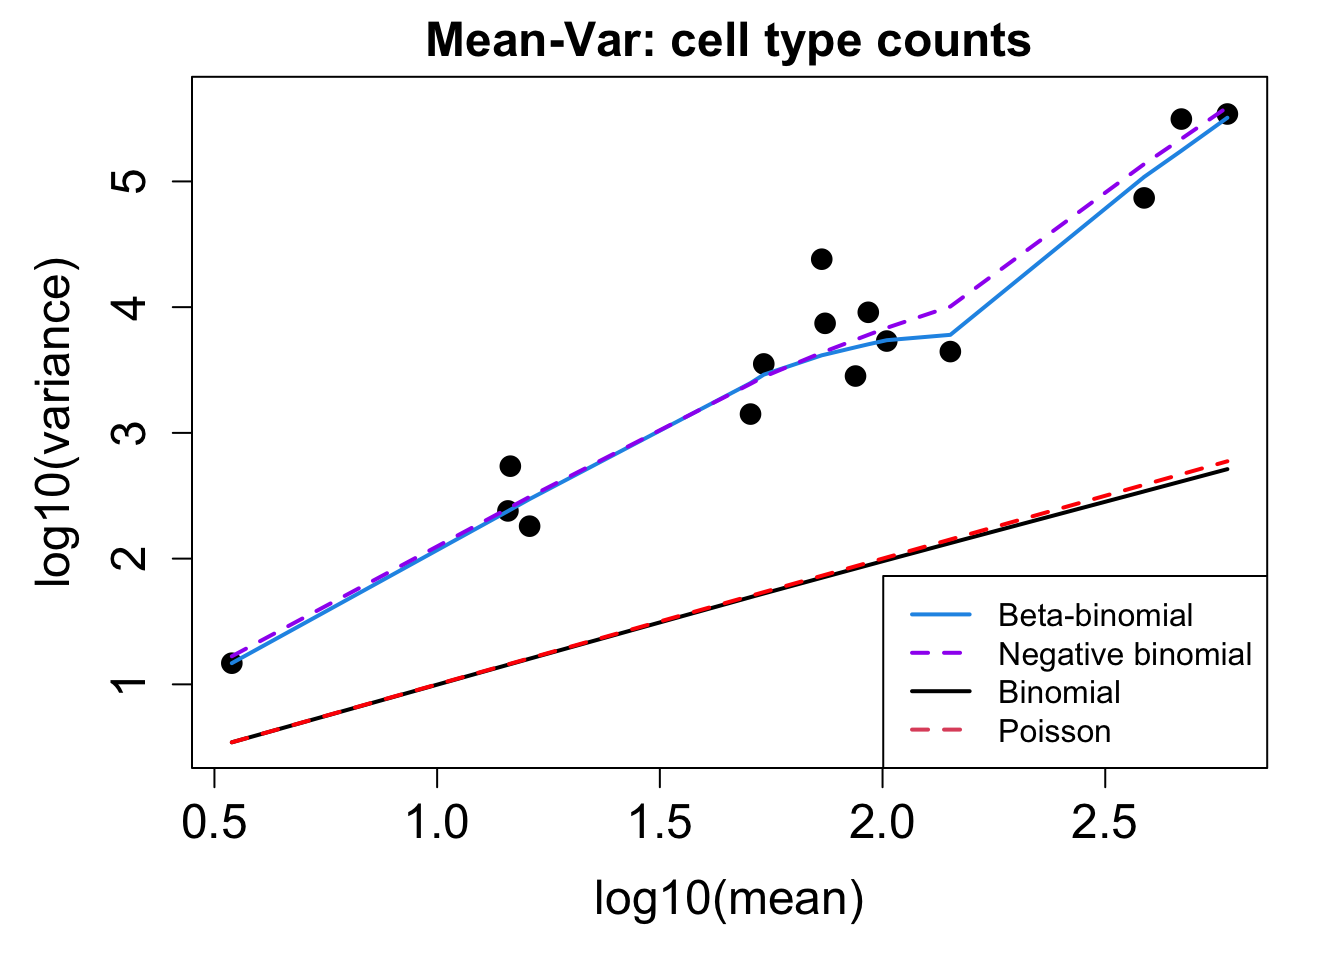
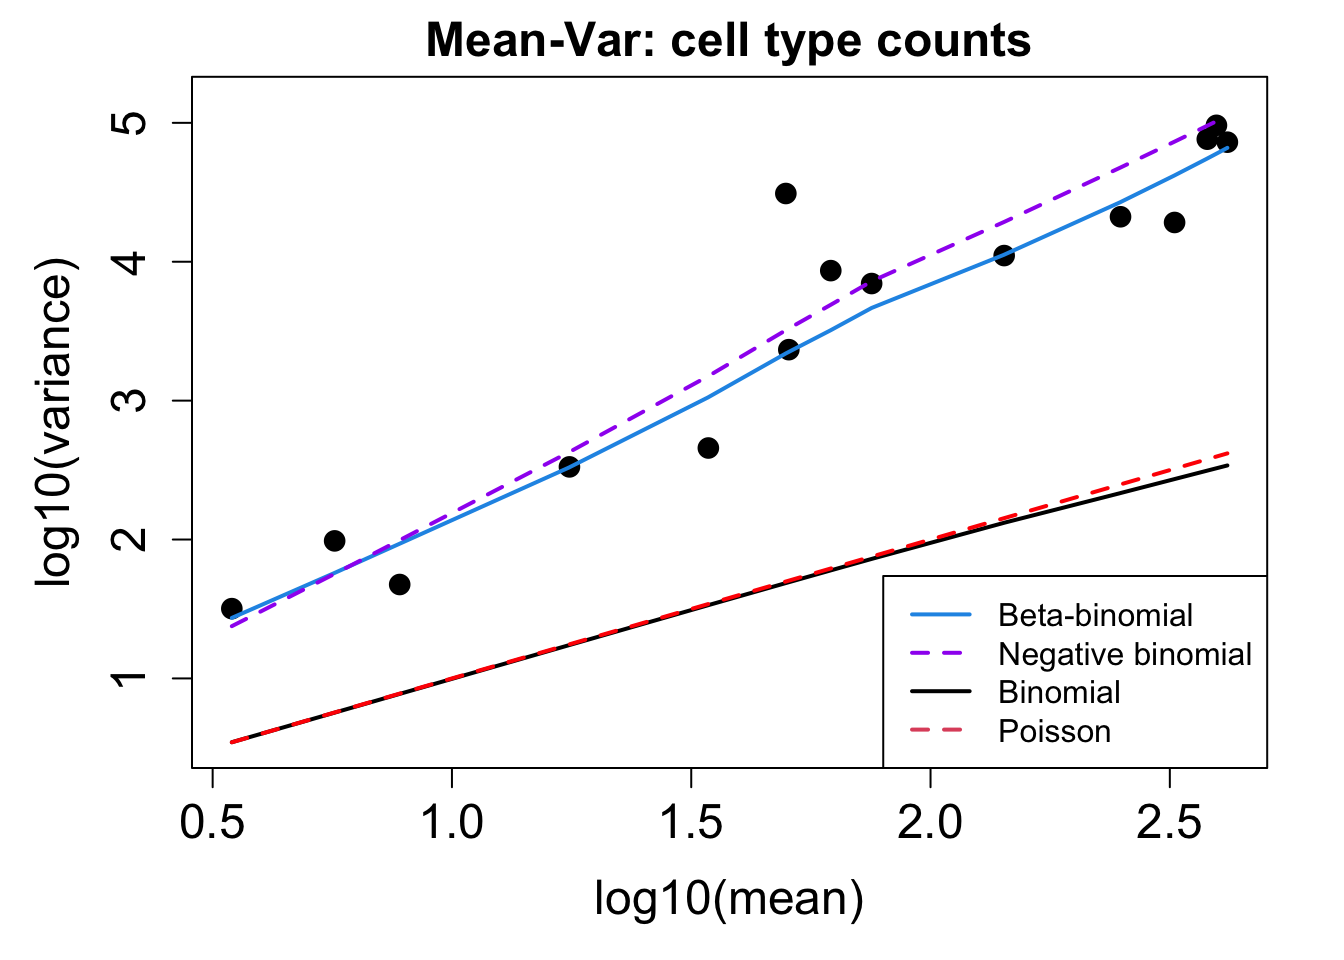
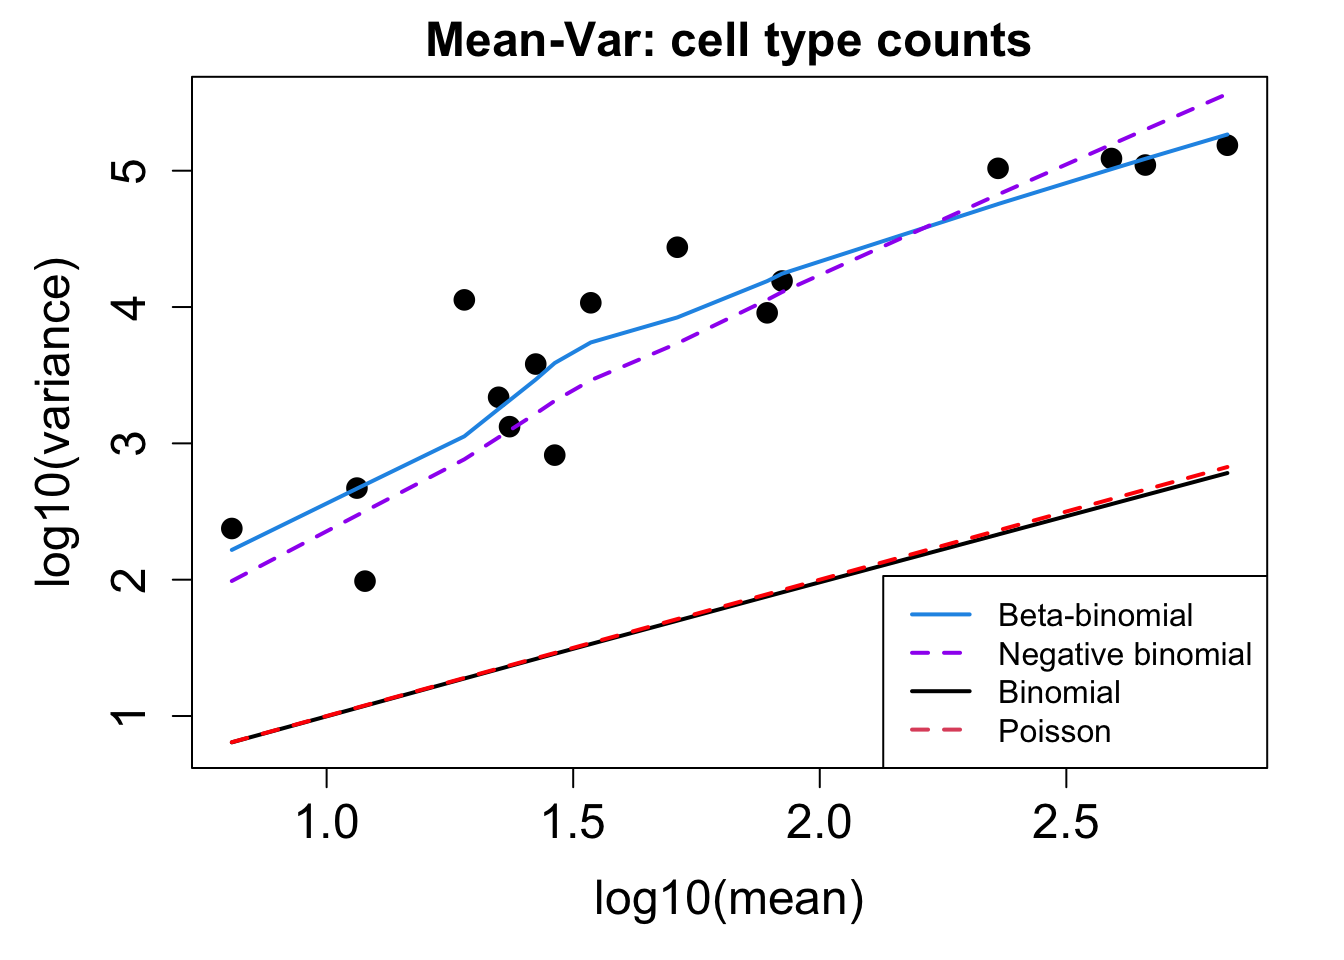
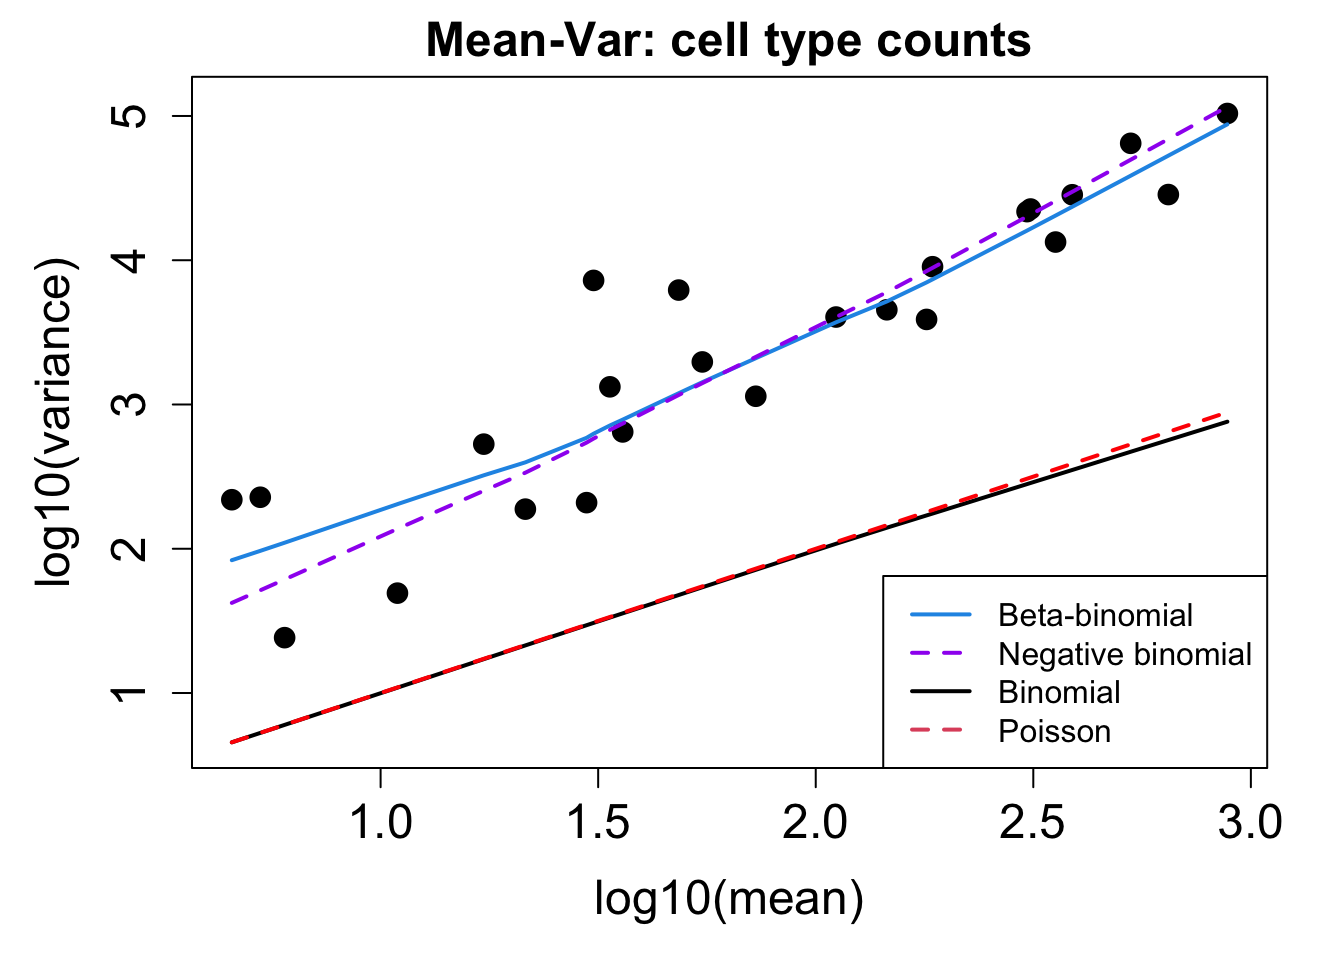
# Plot Cell Type Mean Variance
p1 <- plotCellTypeMeanVar(props$Counts)
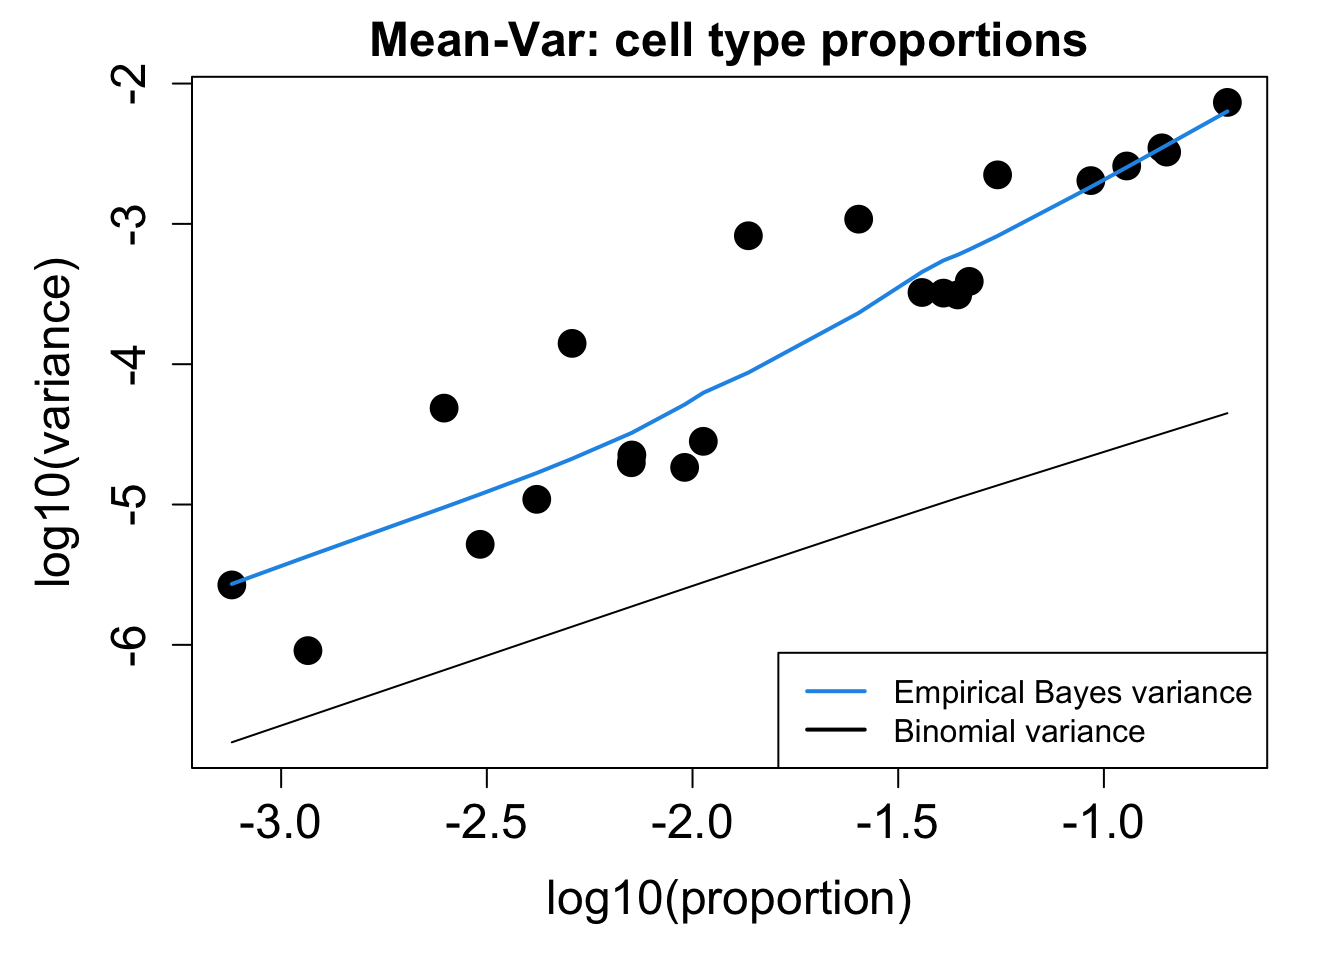
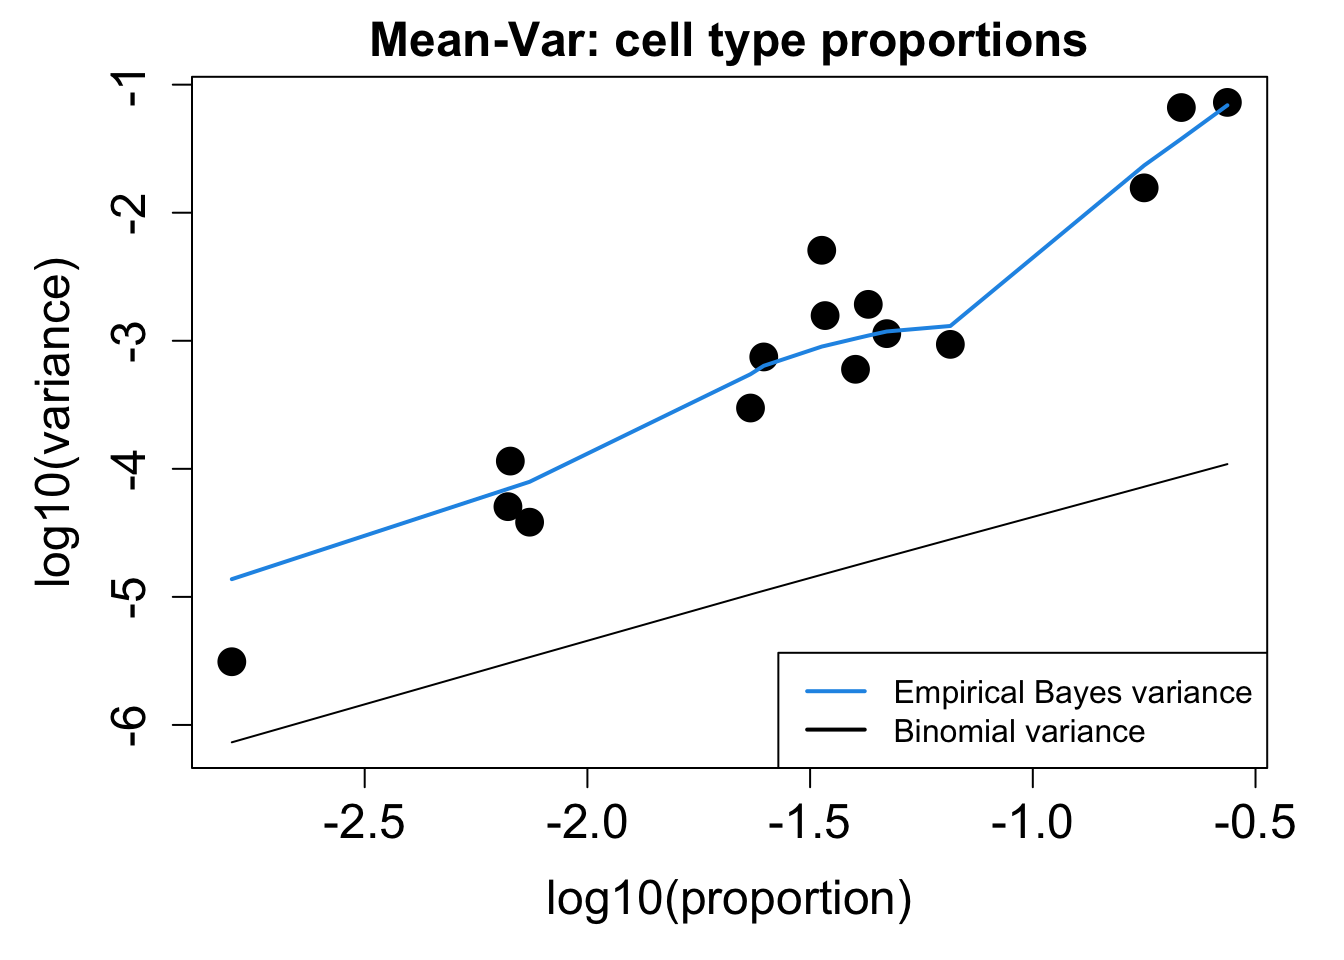
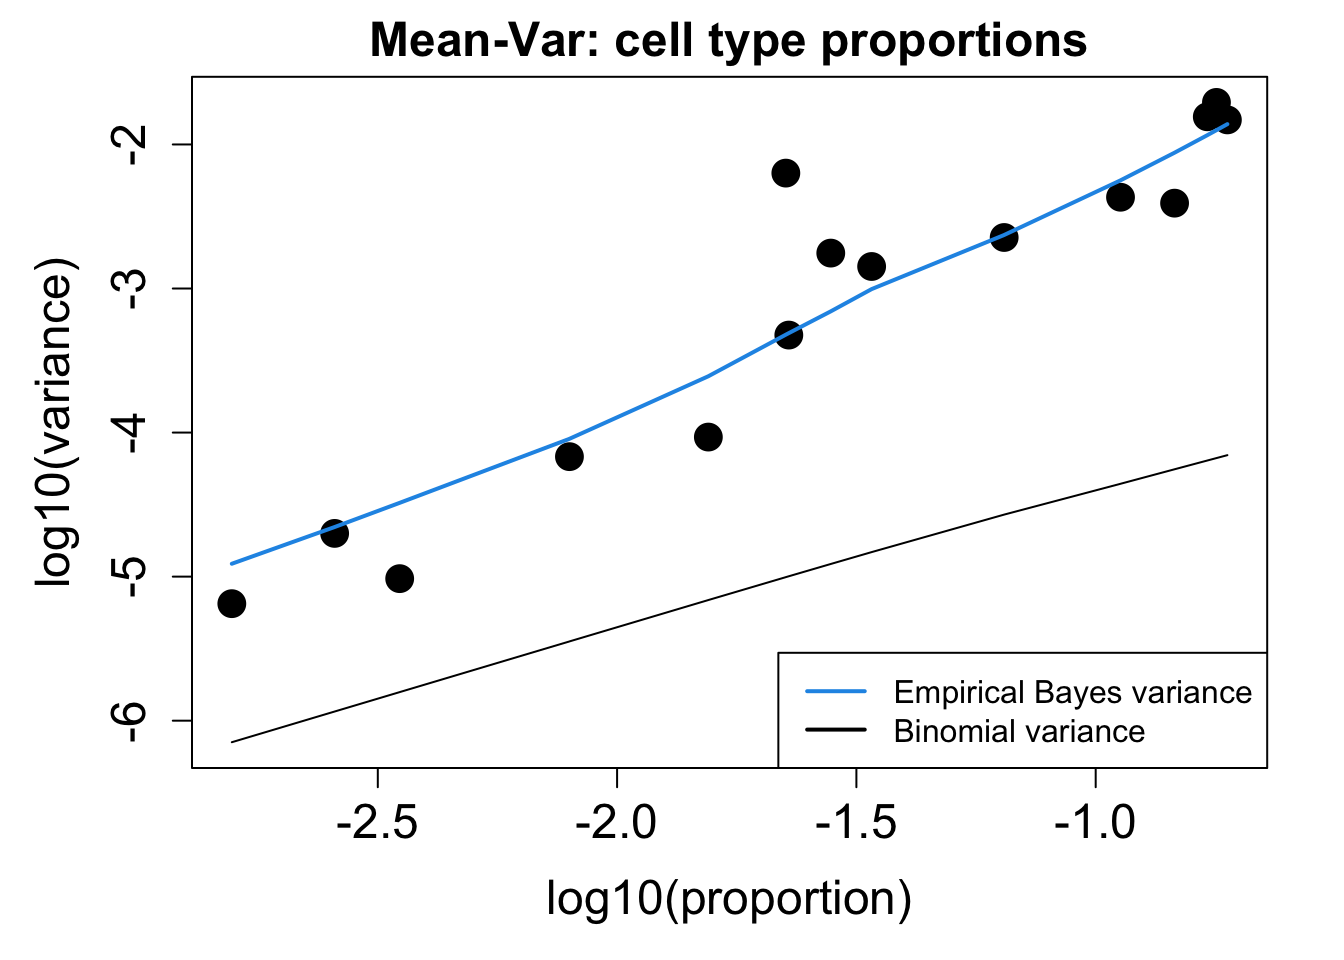
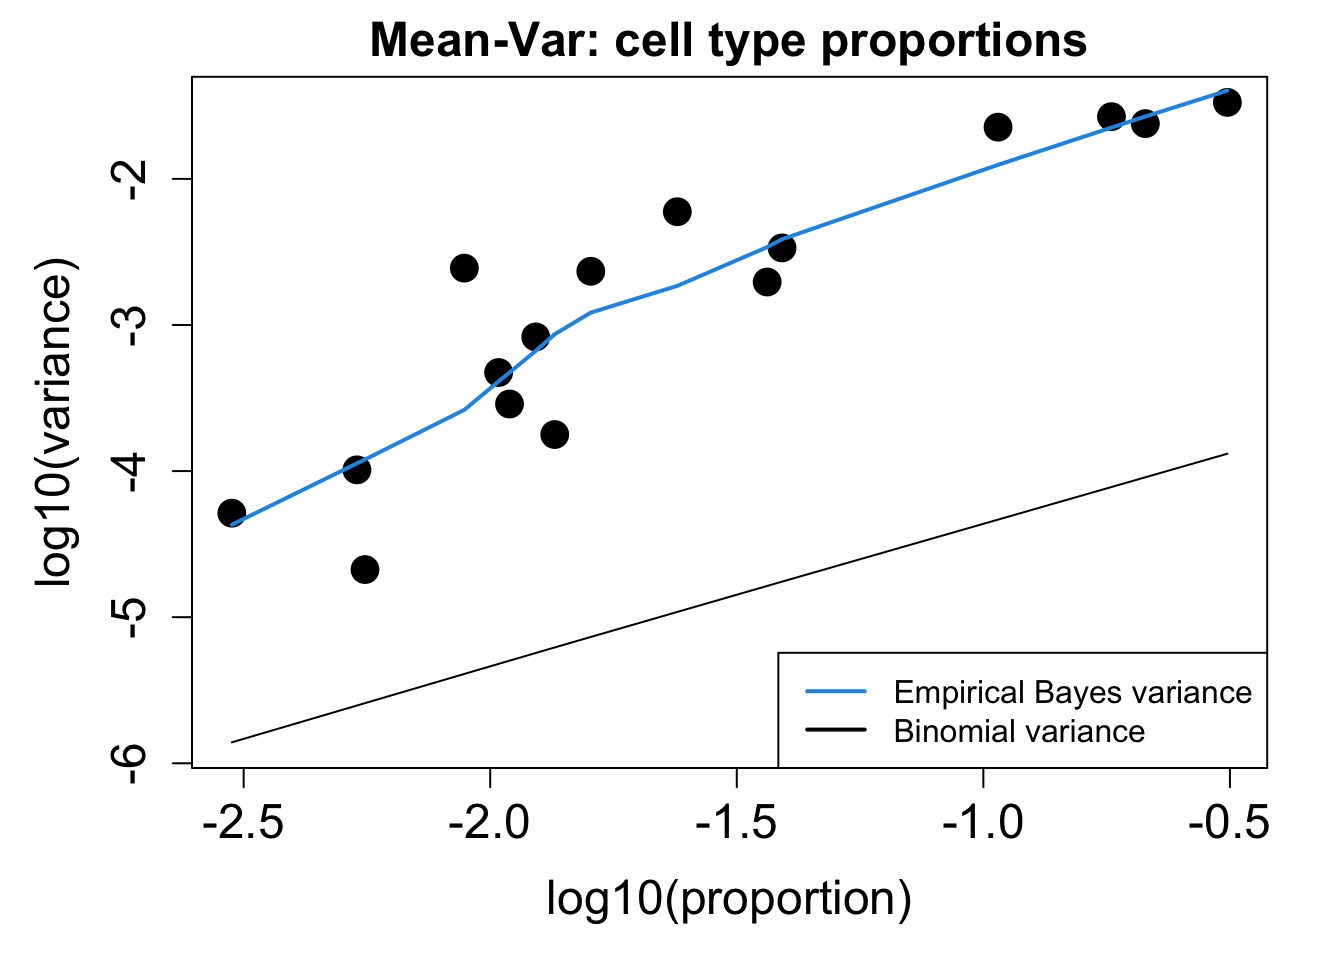
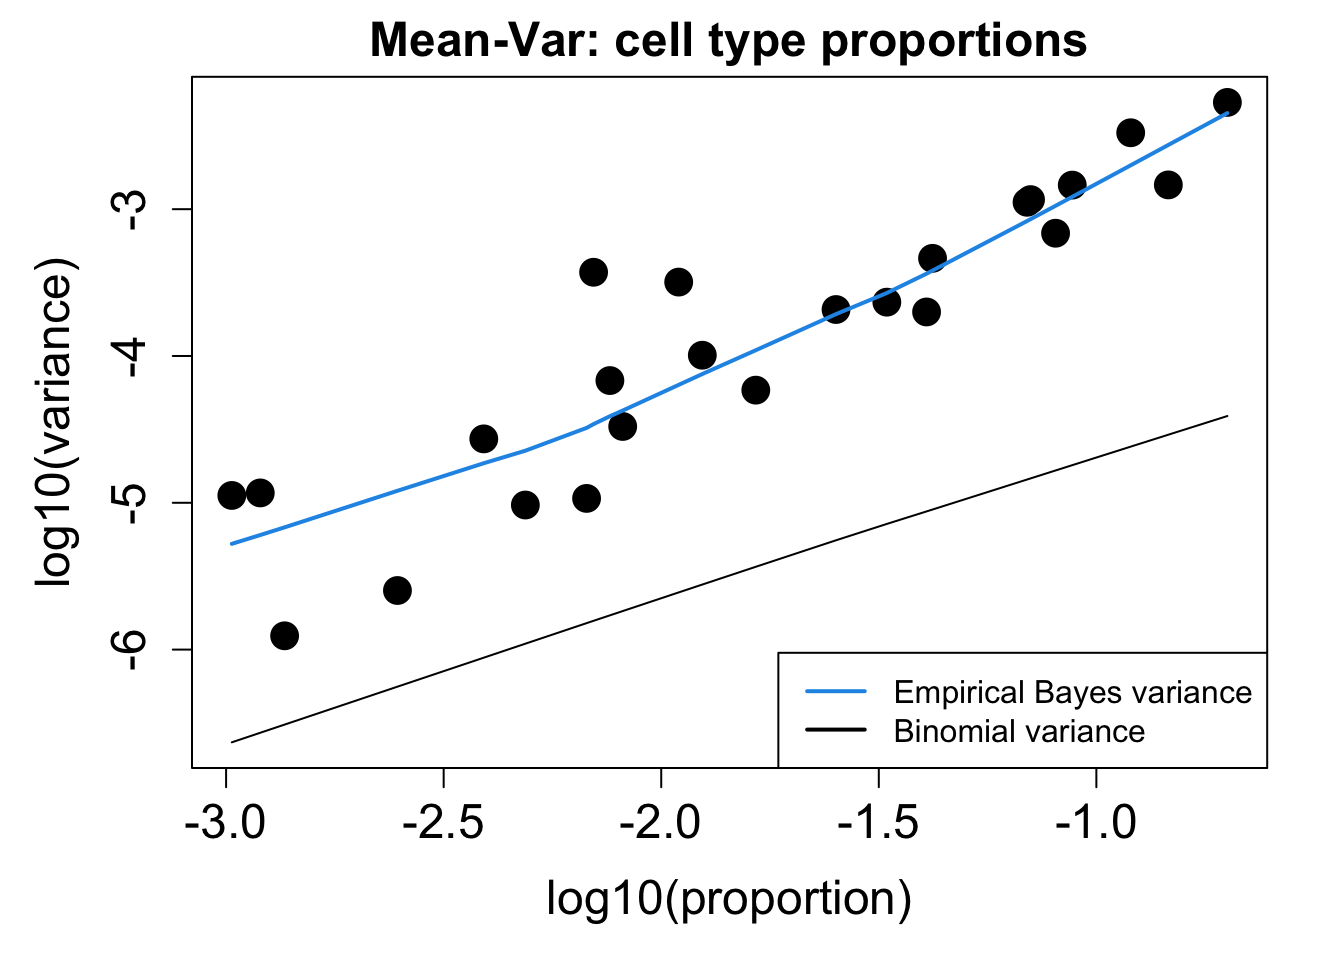
# Plot Cell Type Proportions Mean Variance
p2 <- plotCellTypePropsMeanVar(props$Counts)
p1 / p2
print(knitr::kable(props$Proportions, caption = "Cell-type proportions in samples"))
}Adenoids
| eAIR001 | eAIR003 | eAIR004 | eAIR006 | eAIR007 | eAIR008 | eAIR010 | eAIR012 | eAIR013 | eAIR014 | eAIR015 | eAIR016 | eAIR019 | eAIR020 | eAIR021 | eAIR023 | eAIR024 | eAIR025 | eAIR026 | eAIR027 | eAIR028 | eAIR031 | eAIR032 | eAIR033 | eAIR037 | eAIR038 | eAIR039 | eAIR041 | eAIR042 | eAIR043 | eAIR055 | eAIR056 | |
|---|---|---|---|---|---|---|---|---|---|---|---|---|---|---|---|---|---|---|---|---|---|---|---|---|---|---|---|---|---|---|---|---|
| naïve B cells | 0.3024634 | 0.2954311 | 0.0819335 | 0.2738669 | 0.1921956 | 0.1742466 | 0.2123181 | 0.2783908 | 0.1799141 | 0.1930647 | 0.2950285 | 0.1638024 | 0.1432012 | 0.1962645 | 0.1745396 | 0.3093500 | 0.1248548 | 0.1408228 | 0.3041978 | 0.0880373 | 0.2355917 | 0.0500194 | 0.1433584 | 0.1751133 | 0.1214560 | 0.2135794 | 0.1313186 | 0.2047907 | 0.3054930 | 0.0956383 | 0.4420691 | 0.1449383 |
| memory B cells | 0.0595572 | 0.1147372 | 0.1789510 | 0.2138380 | 0.0603274 | 0.1852055 | 0.1013514 | 0.1464368 | 0.2137487 | 0.2021243 | 0.1255094 | 0.1248657 | 0.0838625 | 0.0948710 | 0.2129704 | 0.1379910 | 0.1454704 | 0.2260021 | 0.0704428 | 0.0595546 | 0.0614273 | 0.1031408 | 0.0853801 | 0.1611042 | 0.1046278 | 0.1608438 | 0.2180248 | 0.1672421 | 0.1848267 | 0.2170868 | 0.0941019 | 0.2308642 |
| CM CD4 T cells and/or pre TFH cells | 0.0505145 | 0.1590519 | 0.2386013 | 0.0964320 | 0.0814084 | 0.1432877 | 0.1148649 | 0.0919540 | 0.1245972 | 0.1252734 | 0.0766096 | 0.2121375 | 0.1079483 | 0.0919063 | 0.1232986 | 0.1578033 | 0.1297909 | 0.2571203 | 0.1032202 | 0.1662351 | 0.1152665 | 0.1500582 | 0.0825397 | 0.1211372 | 0.0770075 | 0.1486486 | 0.2926785 | 0.1616314 | 0.0920756 | 0.2278912 | 0.0841764 | 0.2227160 |
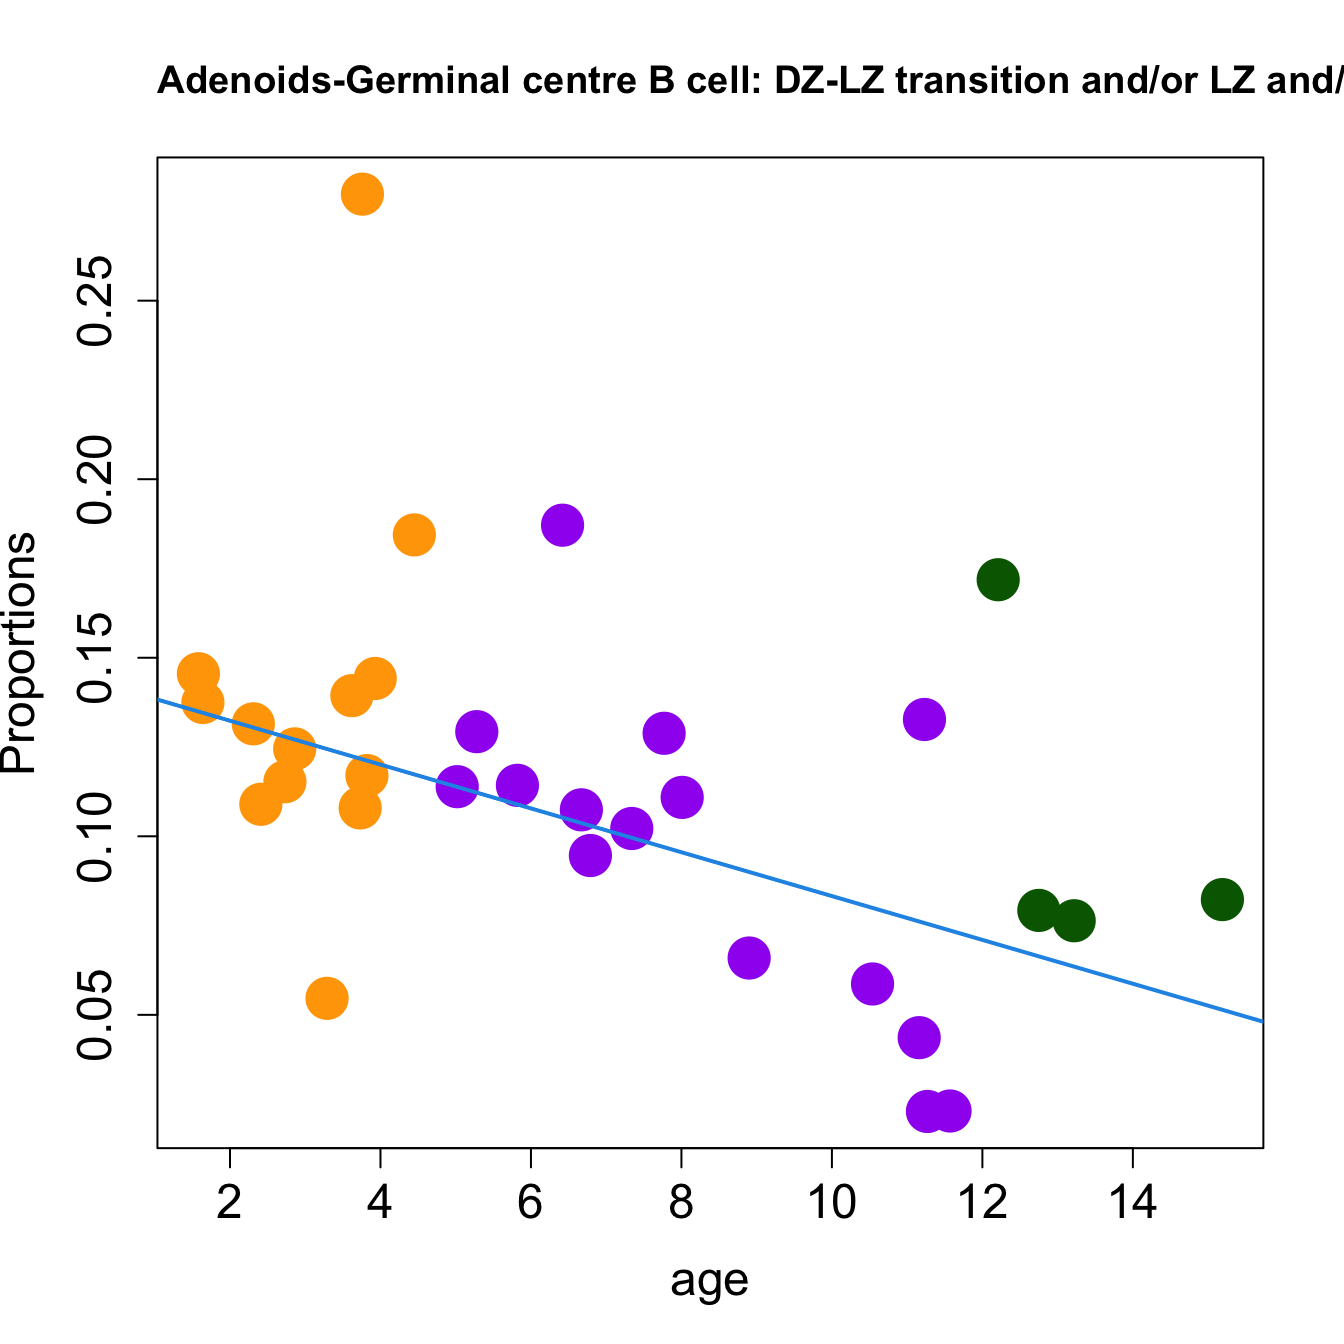
| Germinal centre B cell: DZ-LZ transition and/or LZ and/or LZ-DZ | 0.1393826 | 0.0546204 | 0.0946178 | 0.1142719 | 0.1374748 | 0.1079452 | 0.1314969 | 0.1170115 | 0.1074114 | 0.1152765 | 0.1138957 | 0.1441998 | 0.2798336 | 0.1844056 | 0.1293034 | 0.0229406 | 0.0659117 | 0.0822785 | 0.1089707 | 0.1455205 | 0.1244806 | 0.1108957 | 0.0436090 | 0.1021838 | 0.1871227 | 0.0230719 | 0.0586436 | 0.1327147 | 0.0792436 | 0.1288515 | 0.0763504 | 0.1718519 |
| T-follicular helper and/or CD4 naïve | 0.0823199 | 0.0762625 | 0.1271855 | 0.0450820 | 0.1096658 | 0.1079452 | 0.0867983 | 0.0696552 | 0.0754565 | 0.0612309 | 0.0741646 | 0.0639098 | 0.0411649 | 0.0919063 | 0.0732586 | 0.0990615 | 0.1123693 | 0.0870253 | 0.1311098 | 0.1201450 | 0.1046070 | 0.0387747 | 0.1565581 | 0.2175525 | 0.0808487 | 0.2313777 | 0.0962403 | 0.0681916 | 0.0684376 | 0.0920368 | 0.0704333 | 0.0140741 |
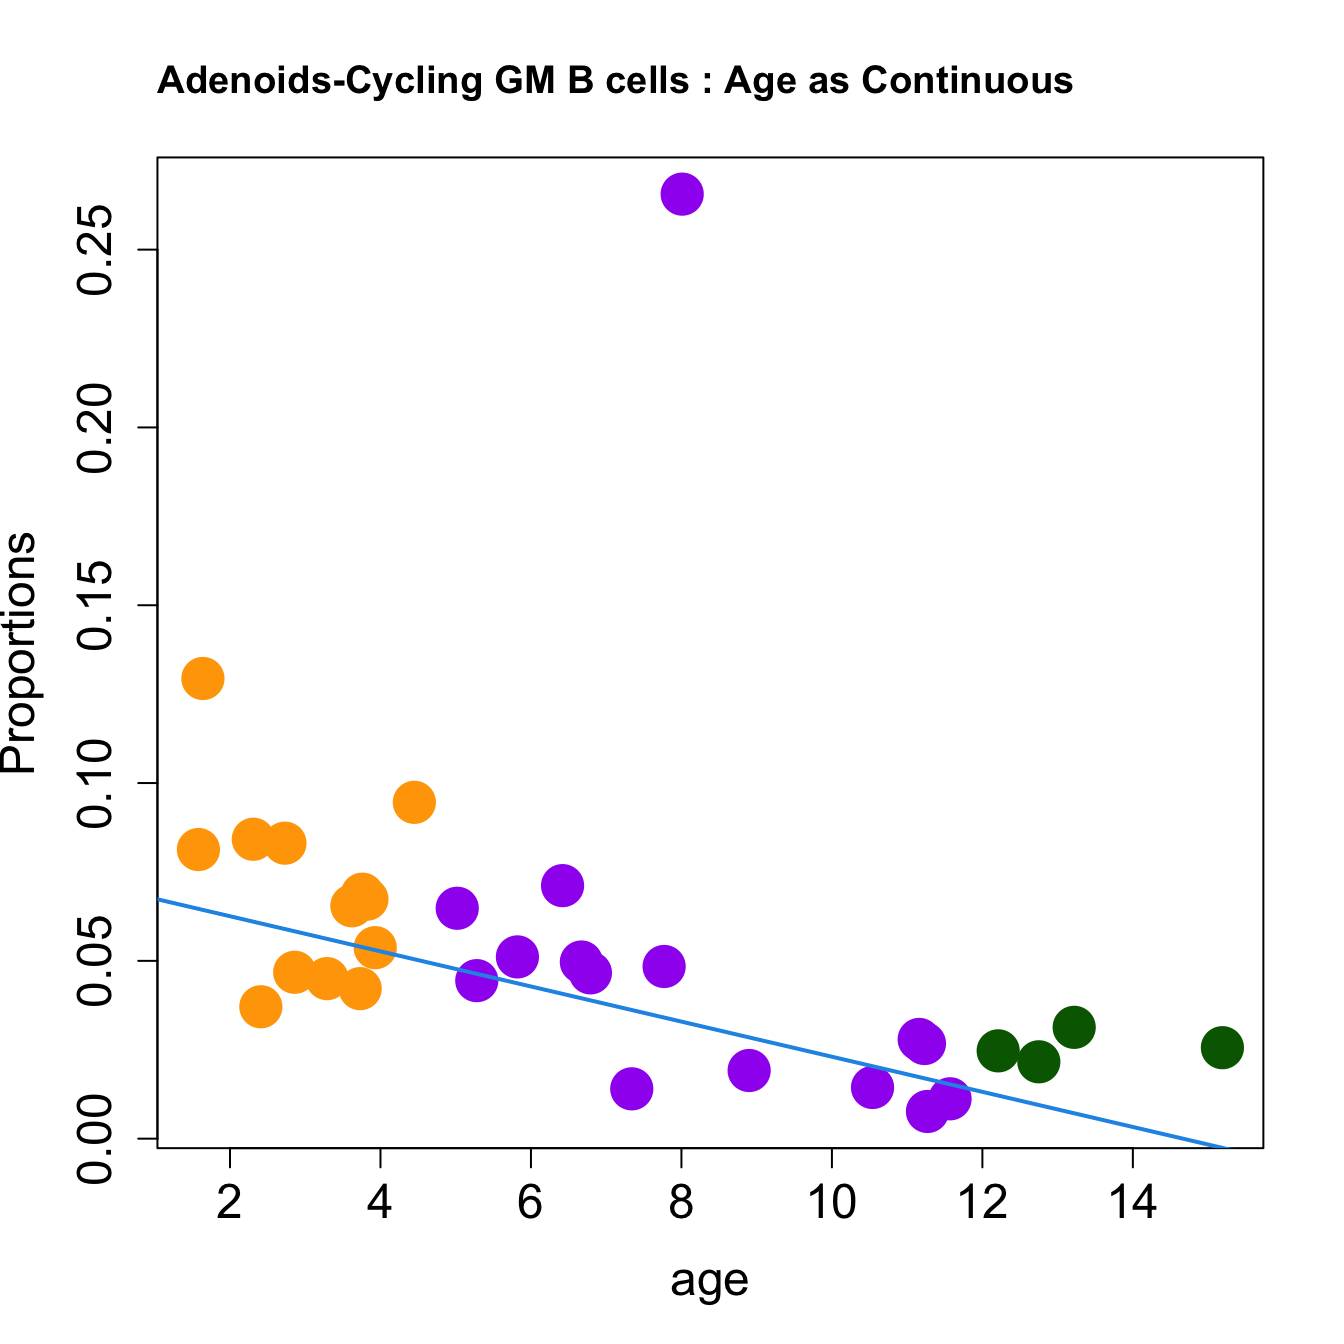
| Cycling GM B cells | 0.0654818 | 0.0450017 | 0.0466232 | 0.0511090 | 0.1294012 | 0.0421918 | 0.0841996 | 0.0673563 | 0.0496778 | 0.0830990 | 0.0647922 | 0.0537057 | 0.0687541 | 0.0945746 | 0.0444355 | 0.0076469 | 0.0191638 | 0.0255802 | 0.0370903 | 0.0813050 | 0.0467931 | 0.2656068 | 0.0279031 | 0.0140091 | 0.0711542 | 0.0112063 | 0.0143911 | 0.0267587 | 0.0216119 | 0.0484194 | 0.0313037 | 0.0246914 |
| T-follicular helper and/or T-follicular memory and/or CD4 Treg | 0.0489554 | 0.0669873 | 0.0562221 | 0.0388139 | 0.0616730 | 0.0506849 | 0.0587318 | 0.0422989 | 0.0306122 | 0.0634177 | 0.0399348 | 0.0464554 | 0.0394132 | 0.0462496 | 0.0212170 | 0.0229406 | 0.0313589 | 0.0203059 | 0.0770558 | 0.1077162 | 0.0802168 | 0.0542846 | 0.0131997 | 0.0391430 | 0.0568868 | 0.0342782 | 0.0386760 | 0.0565386 | 0.0229626 | 0.0586234 | 0.0332124 | 0.0469136 |
| Naive B cell activated | 0.0492672 | 0.0553075 | 0.0329105 | 0.0527965 | 0.0318457 | 0.0287671 | 0.0563929 | 0.0358621 | 0.0341031 | 0.0399875 | 0.0686634 | 0.0330290 | 0.0194876 | 0.0183813 | 0.0416333 | 0.0691693 | 0.0499419 | 0.0450949 | 0.0451409 | 0.0761264 | 0.0402891 | 0.0321830 | 0.0237260 | 0.0733416 | 0.0170112 | 0.0688860 | 0.0347185 | 0.0476910 | 0.0531292 | 0.0272109 | 0.0815041 | 0.0281481 |
| NK cells and/or NK- T cells and/or gamma delta T cells | 0.0224509 | 0.0250773 | 0.0411382 | 0.0226615 | 0.0228751 | 0.0339726 | 0.0163721 | 0.0183908 | 0.0518260 | 0.0221806 | 0.0313773 | 0.0512889 | 0.0523319 | 0.0302401 | 0.0360288 | 0.0667362 | 0.0508130 | 0.0635549 | 0.0238643 | 0.0315898 | 0.0220416 | 0.0360605 | 0.0917293 | 0.0436753 | 0.0523139 | 0.0672380 | 0.0545062 | 0.0636599 | 0.0562810 | 0.0362145 | 0.0271044 | 0.0380247 |
| DZ B cells (early or late phase) | 0.0520736 | 0.0195809 | 0.0308536 | 0.0306172 | 0.0603274 | 0.0312329 | 0.0418399 | 0.0370115 | 0.0429646 | 0.0412371 | 0.0332111 | 0.0424275 | 0.0632801 | 0.0969463 | 0.0392314 | 0.0100799 | 0.0238095 | 0.0245253 | 0.0316274 | 0.0445365 | 0.0467931 | 0.0504071 | 0.0142022 | 0.0160692 | 0.0568868 | 0.0052736 | 0.0206872 | 0.0325852 | 0.0254390 | 0.0346138 | 0.0202329 | 0.0355556 |
| interferon-activated naïve B cells | 0.0589336 | 0.0223291 | 0.0133699 | 0.0161524 | 0.0459744 | 0.0386301 | 0.0298857 | 0.0402299 | 0.0093985 | 0.0118713 | 0.0307661 | 0.0008056 | 0.0142325 | 0.0026682 | 0.0260208 | 0.0038234 | 0.0818815 | 0.0013186 | 0.0209891 | 0.0165717 | 0.0220416 | 0.0065917 | 0.1547201 | 0.0016481 | 0.0881654 | 0.0016480 | 0.0032380 | 0.0019422 | 0.0418730 | 0.0008003 | 0.0015270 | 0.0009877 |
| interferon-activated T cells | 0.0121609 | 0.0065270 | 0.0102845 | 0.0024108 | 0.0076250 | 0.0063014 | 0.0046778 | 0.0105747 | 0.0021482 | 0.0024992 | 0.0061125 | 0.0016112 | 0.0094154 | 0.0005929 | 0.0096077 | 0.0027807 | 0.1263066 | 0.0013186 | 0.0094882 | 0.0124288 | 0.0074074 | 0.0007755 | 0.1067669 | 0.0016481 | 0.0535943 | 0.0016480 | 0.0032380 | 0.0017264 | 0.0130572 | 0.0014006 | 0.0005726 | 0.0007407 |
| monocytes/macrophages | 0.0115373 | 0.0171762 | 0.0102845 | 0.0103664 | 0.0199596 | 0.0087671 | 0.0161123 | 0.0071264 | 0.0126208 | 0.0096845 | 0.0073350 | 0.0123523 | 0.0192687 | 0.0106730 | 0.0172138 | 0.0076469 | 0.0069686 | 0.0044831 | 0.0080506 | 0.0108752 | 0.0088528 | 0.0255913 | 0.0188805 | 0.0041203 | 0.0074995 | 0.0062624 | 0.0026983 | 0.0069055 | 0.0108059 | 0.0058023 | 0.0078259 | 0.0061728 |
| innate lymphocytes | 0.0077954 | 0.0133975 | 0.0157696 | 0.0057859 | 0.0031397 | 0.0112329 | 0.0064969 | 0.0055172 | 0.0072503 | 0.0059356 | 0.0052975 | 0.0120838 | 0.0091964 | 0.0056330 | 0.0164131 | 0.0152937 | 0.0078397 | 0.0105485 | 0.0115009 | 0.0062144 | 0.0028907 | 0.0124079 | 0.0185464 | 0.0123609 | 0.0042071 | 0.0121951 | 0.0181687 | 0.0099266 | 0.0092301 | 0.0110044 | 0.0064898 | 0.0064198 |
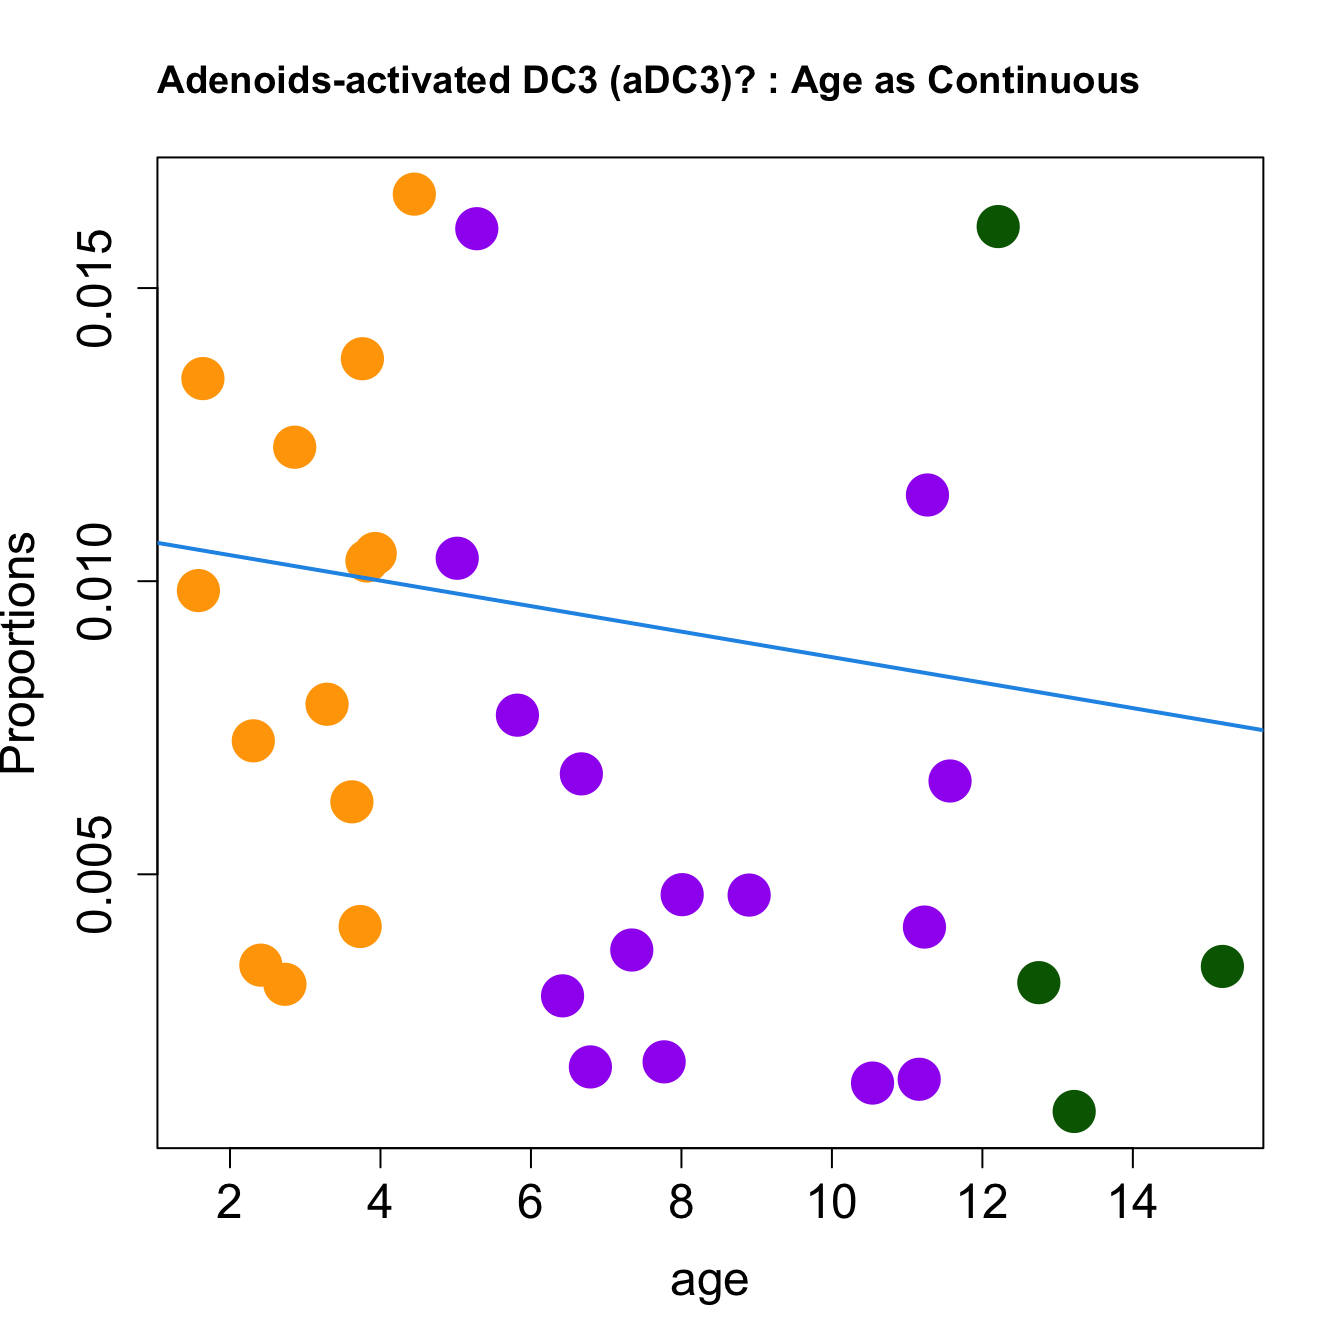
| activated DC3 (aDC3)? | 0.0062364 | 0.0079011 | 0.0017141 | 0.0077146 | 0.0134559 | 0.0041096 | 0.0072765 | 0.0103448 | 0.0067132 | 0.0031240 | 0.0103912 | 0.0104726 | 0.0137946 | 0.0166024 | 0.0160128 | 0.0114703 | 0.0046458 | 0.0034283 | 0.0034503 | 0.0098395 | 0.0122855 | 0.0046530 | 0.0015038 | 0.0037083 | 0.0029267 | 0.0065920 | 0.0014391 | 0.0041001 | 0.0031517 | 0.0018007 | 0.0009544 | 0.0160494 |
| plasma cells | 0.0090427 | 0.0085881 | 0.0051423 | 0.0098843 | 0.0089706 | 0.0104110 | 0.0059771 | 0.0126437 | 0.0061762 | 0.0096845 | 0.0103912 | 0.0072503 | 0.0087585 | 0.0059294 | 0.0084067 | 0.0069517 | 0.0072590 | 0.0010549 | 0.0037378 | 0.0062144 | 0.0052394 | 0.0263668 | 0.0041771 | 0.0037083 | 0.0045729 | 0.0019776 | 0.0055765 | 0.0034527 | 0.0049527 | 0.0018007 | 0.0074442 | 0.0054321 |
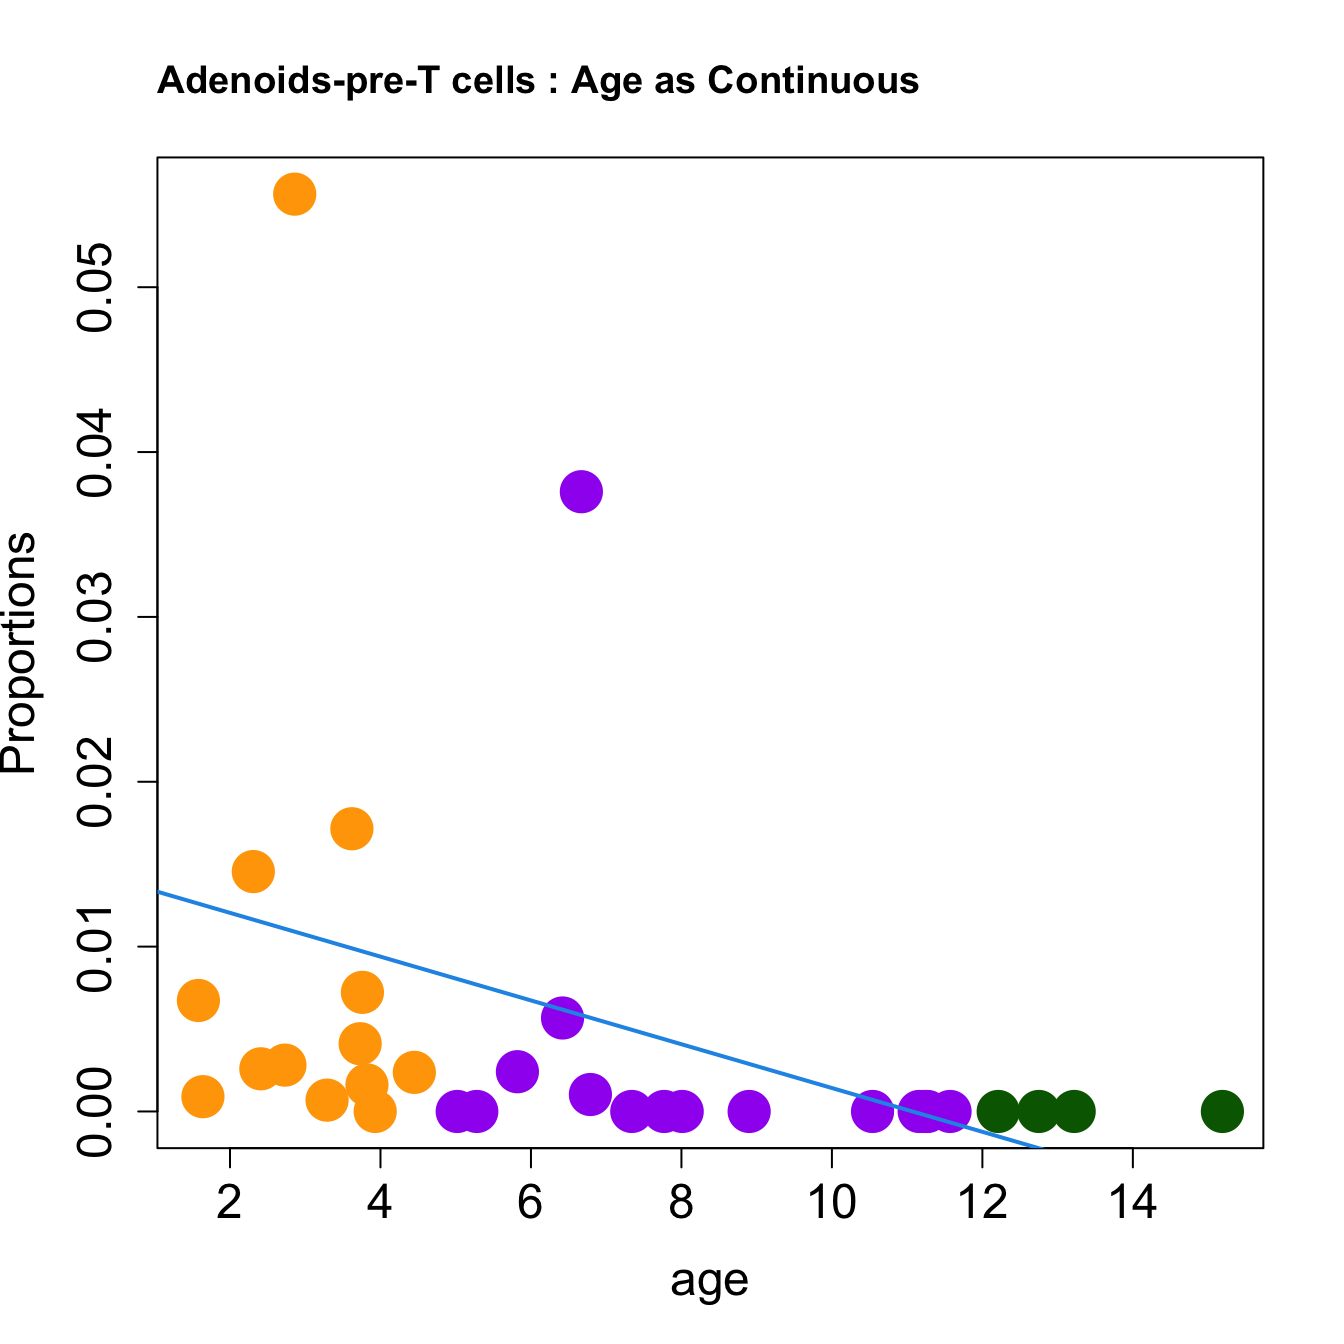
| pre-T cells | 0.0171500 | 0.0006870 | 0.0010285 | 0.0024108 | 0.0008971 | 0.0041096 | 0.0145530 | 0.0016092 | 0.0375940 | 0.0028116 | 0.0000000 | 0.0000000 | 0.0072257 | 0.0023718 | 0.0000000 | 0.0000000 | 0.0000000 | 0.0000000 | 0.0025877 | 0.0067323 | 0.0556459 | 0.0000000 | 0.0000000 | 0.0000000 | 0.0056704 | 0.0000000 | 0.0000000 | 0.0000000 | 0.0000000 | 0.0000000 | 0.0000000 | 0.0000000 |
| plasmacytoid DCs | 0.0015591 | 0.0072140 | 0.0092561 | 0.0036162 | 0.0031397 | 0.0076712 | 0.0028586 | 0.0022989 | 0.0034909 | 0.0034364 | 0.0030562 | 0.0016112 | 0.0032844 | 0.0011859 | 0.0044035 | 0.0083420 | 0.0017422 | 0.0034283 | 0.0046003 | 0.0041429 | 0.0014453 | 0.0166731 | 0.0100251 | 0.0024722 | 0.0027437 | 0.0029664 | 0.0041374 | 0.0047475 | 0.0015759 | 0.0050020 | 0.0009544 | 0.0007407 |
| follicular dendritic cells | 0.0009355 | 0.0017176 | 0.0037710 | 0.0014465 | 0.0087464 | 0.0016438 | 0.0044179 | 0.0032184 | 0.0029538 | 0.0018744 | 0.0014262 | 0.0053706 | 0.0072257 | 0.0056330 | 0.0024019 | 0.0010428 | 0.0002904 | 0.0010549 | 0.0011501 | 0.0025893 | 0.0032520 | 0.0096937 | 0.0008354 | 0.0012361 | 0.0038412 | 0.0019776 | 0.0008994 | 0.0041001 | 0.0040522 | 0.0038015 | 0.0026723 | 0.0022222 |
| neutrophils | 0.0006236 | 0.0000000 | 0.0000000 | 0.0002411 | 0.0002243 | 0.0000000 | 0.0012994 | 0.0013793 | 0.0000000 | 0.0009372 | 0.0008150 | 0.0107411 | 0.0015327 | 0.0011859 | 0.0016013 | 0.0378867 | 0.0008711 | 0.0000000 | 0.0002875 | 0.0010357 | 0.0003613 | 0.0011632 | 0.0005013 | 0.0045323 | 0.0001829 | 0.0000000 | 0.0000000 | 0.0000000 | 0.0000000 | 0.0004002 | 0.0108799 | 0.0009877 |
| mast cells | 0.0003118 | 0.0024047 | 0.0003428 | 0.0002411 | 0.0004485 | 0.0005479 | 0.0015593 | 0.0004598 | 0.0002685 | 0.0006248 | 0.0010187 | 0.0018797 | 0.0021896 | 0.0008894 | 0.0012010 | 0.0010428 | 0.0002904 | 0.0007911 | 0.0011501 | 0.0015536 | 0.0025294 | 0.0046530 | 0.0018379 | 0.0012361 | 0.0007317 | 0.0003296 | 0.0007196 | 0.0008632 | 0.0018010 | 0.0006002 | 0.0001909 | 0.0024691 |
| preB cells | 0.0012473 | 0.0000000 | 0.0000000 | 0.0002411 | 0.0002243 | 0.0010959 | 0.0005198 | 0.0002299 | 0.0010741 | 0.0006248 | 0.0002037 | 0.0000000 | 0.0045982 | 0.0008894 | 0.0008006 | 0.0000000 | 0.0084204 | 0.0002637 | 0.0002875 | 0.0010357 | 0.0005420 | 0.0000000 | 0.0000000 | 0.0000000 | 0.0005487 | 0.0000000 | 0.0000000 | 0.0004316 | 0.0000000 | 0.0010004 | 0.0000000 | 0.0000000 |
BAL
| eAIR011_1 | eAIR011_2 | eAIR035_1 | eAIR035_2 | eAIR036_1 | eAIR036_2 | eAIR045_1 | eAIR045_2 | eAIR046_1 | eAIR046_2 | eAIR054_1 | eAIR054_2 | eAIR057_1 | eAIR057_2 | eAIR059_1 | eAIR059_2 | |
|---|---|---|---|---|---|---|---|---|---|---|---|---|---|---|---|---|
| macro-alveolar | 0.0174989 | 0.0213831 | 0.0151976 | 0.0236584 | 0.4021385 | 0.4722103 | 0.1839879 | 0.1941109 | 0.7855007 | 0.7703286 | 0.1497006 | 0.1305903 | 0.1344196 | 0.1012195 | 0.0241611 | 0.0222717 |
| macro-lipid | 0.6598378 | 0.6815287 | 0.7082067 | 0.7132141 | 0.0278940 | 0.0258509 | 0.0537764 | 0.0554603 | 0.0150972 | 0.0113951 | 0.2335329 | 0.1985689 | 0.3862865 | 0.2512195 | 0.1829978 | 0.1698218 |
| macro-monocyte-derived-or-interstitial | 0.0738370 | 0.0605096 | 0.0924012 | 0.1027121 | 0.2408182 | 0.2244722 | 0.1631420 | 0.1695254 | 0.0508221 | 0.0573072 | 0.3692615 | 0.3649374 | 0.0672098 | 0.0865854 | 0.3803132 | 0.3413140 |
| CD8 T cells | 0.0546308 | 0.0491356 | 0.0401216 | 0.0288517 | 0.1022780 | 0.0831538 | 0.1172205 | 0.1183533 | 0.0437967 | 0.0544308 | 0.0319361 | 0.0393560 | 0.0543109 | 0.1085366 | 0.0523490 | 0.0662584 |
| CD4 T cells | 0.0452411 | 0.0382166 | 0.0170213 | 0.0155799 | 0.0567178 | 0.0374838 | 0.0764350 | 0.0786164 | 0.0215247 | 0.0277686 | 0.0079840 | 0.0214669 | 0.0726409 | 0.1426829 | 0.0425056 | 0.0501114 |
| B cells | 0.0418267 | 0.0436761 | 0.0085106 | 0.0109636 | 0.0701999 | 0.0491168 | 0.1498489 | 0.1392224 | 0.0068759 | 0.0081867 | 0.0199601 | 0.0357782 | 0.0305499 | 0.0451220 | 0.0125280 | 0.0111359 |
| macro-proliferating | 0.0469484 | 0.0491356 | 0.0218845 | 0.0253895 | 0.0288238 | 0.0336062 | 0.0129909 | 0.0154374 | 0.0500747 | 0.0464653 | 0.0039920 | 0.0125224 | 0.0095044 | 0.0036585 | 0.0058166 | 0.0055679 |
| ciliated epithelial cells | 0.0170721 | 0.0150136 | 0.0401216 | 0.0386613 | 0.0213854 | 0.0198190 | 0.0818731 | 0.0737564 | 0.0079223 | 0.0058635 | 0.0718563 | 0.0572451 | 0.0529532 | 0.0621951 | 0.0362416 | 0.0378619 |
| macro-CCL | 0.0000000 | 0.0000000 | 0.0000000 | 0.0011541 | 0.0046490 | 0.0064627 | 0.0299094 | 0.0317324 | 0.0004484 | 0.0003319 | 0.0059880 | 0.0107335 | 0.0115411 | 0.0060976 | 0.2000000 | 0.2282851 |
| unknown | 0.0179257 | 0.0163785 | 0.0115502 | 0.0034622 | 0.0037192 | 0.0021542 | 0.0888218 | 0.0854774 | 0.0112108 | 0.0117270 | 0.0039920 | 0.0035778 | 0.0278344 | 0.0353659 | 0.0326622 | 0.0423163 |
| secretory epithelial cells | 0.0042680 | 0.0036397 | 0.0310030 | 0.0276976 | 0.0190609 | 0.0159414 | 0.0151057 | 0.0160091 | 0.0029895 | 0.0030977 | 0.0638723 | 0.0876565 | 0.1215207 | 0.1121951 | 0.0143177 | 0.0083519 |
| cycling T cells | 0.0153649 | 0.0145587 | 0.0018237 | 0.0017311 | 0.0144119 | 0.0172340 | 0.0141994 | 0.0131504 | 0.0016442 | 0.0008851 | 0.0059880 | 0.0071556 | 0.0040733 | 0.0024390 | 0.0017897 | 0.0022272 |
| plasmacytoid DC | 0.0017072 | 0.0027298 | 0.0024316 | 0.0023081 | 0.0065086 | 0.0120638 | 0.0042296 | 0.0025729 | 0.0002990 | 0.0005532 | 0.0179641 | 0.0232558 | 0.0013578 | 0.0012195 | 0.0129754 | 0.0139198 |
| basal epithelial cells | 0.0017072 | 0.0018198 | 0.0079027 | 0.0034622 | 0.0000000 | 0.0000000 | 0.0018127 | 0.0025729 | 0.0016442 | 0.0013276 | 0.0119760 | 0.0071556 | 0.0251188 | 0.0390244 | 0.0013423 | 0.0005568 |
| plasma B cells | 0.0021340 | 0.0022748 | 0.0018237 | 0.0011541 | 0.0013947 | 0.0004308 | 0.0066465 | 0.0040023 | 0.0001495 | 0.0003319 | 0.0019960 | 0.0000000 | 0.0006789 | 0.0024390 | 0.0000000 | 0.0000000 |
Bronchial_brushings
| eAIR009 | eAIR010 | eAIR012 | eAIR013 | eAIR014 | eAIR016 | eAIR018 | eAIR020 | eAIR021 | eAIR022 | eAIR024 | eAIR025 | eAIR026 | eAIR027 | eAIR028 | eAIR031 | |
|---|---|---|---|---|---|---|---|---|---|---|---|---|---|---|---|---|
| macrophages | 0.4777019 | 0.0864048 | 0.1256757 | 0.1549398 | 0.4597278 | 0.0787021 | 0.1259690 | 0.0922935 | 0.0223958 | 0.2356198 | 0.2796574 | 0.2511468 | 0.0078405 | 0.0424779 | 0.1948052 | 0.2252027 |
| CD8 T cells | 0.1647248 | 0.2277946 | 0.3891892 | 0.2340503 | 0.1198970 | 0.1463583 | 0.1560078 | 0.4397785 | 0.2682292 | 0.0492156 | 0.1678801 | 0.0160550 | 0.2177419 | 0.1084071 | 0.0012987 | 0.0305677 |
| goblet/club/basal cells | 0.0634793 | 0.0809668 | 0.0851351 | 0.1319723 | 0.0856933 | 0.2782188 | 0.1967054 | 0.0724504 | 0.1453125 | 0.1876346 | 0.1721627 | 0.1846330 | 0.1944444 | 0.0840708 | 0.1649351 | 0.2108546 |
| monocyte and neutrophil-like | 0.0903978 | 0.1305136 | 0.0297297 | 0.0583303 | 0.1125414 | 0.0089748 | 0.0910853 | 0.0461467 | 0.1442708 | 0.0938173 | 0.0882227 | 0.2500000 | 0.1756272 | 0.2101770 | 0.1740260 | 0.0991890 |
| ciliated cells | 0.0550422 | 0.0882175 | 0.2689189 | 0.1604083 | 0.0592129 | 0.4176735 | 0.2189922 | 0.1227503 | 0.1041667 | 0.2060904 | 0.1331906 | 0.1903670 | 0.1418011 | 0.0743363 | 0.4506494 | 0.3231441 |
| B cells | 0.0369626 | 0.1589124 | 0.0378378 | 0.1148378 | 0.0386171 | 0.0334829 | 0.0862403 | 0.1084449 | 0.0770833 | 0.0895109 | 0.0149893 | 0.0080275 | 0.1178315 | 0.0942478 | 0.0000000 | 0.0131004 |
| CD4 T cells | 0.0566493 | 0.1595166 | 0.0256757 | 0.0415603 | 0.0581096 | 0.0144978 | 0.0193798 | 0.0290725 | 0.0473958 | 0.0175331 | 0.0252677 | 0.0114679 | 0.0152330 | 0.0212389 | 0.0000000 | 0.0018715 |
| neutrophils | 0.0108477 | 0.0012085 | 0.0013514 | 0.0222384 | 0.0000000 | 0.0044874 | 0.0281008 | 0.0544532 | 0.1489583 | 0.0944325 | 0.0312634 | 0.0000000 | 0.0495072 | 0.0004425 | 0.0000000 | 0.0000000 |
| monocytes | 0.0008035 | 0.0078550 | 0.0000000 | 0.0010937 | 0.0165502 | 0.0003452 | 0.0000000 | 0.0000000 | 0.0031250 | 0.0009228 | 0.0034261 | 0.0022936 | 0.0004480 | 0.3203540 | 0.0000000 | 0.0031192 |
| mast cells | 0.0024106 | 0.0078550 | 0.0216216 | 0.0535910 | 0.0308937 | 0.0058681 | 0.0251938 | 0.0041532 | 0.0145833 | 0.0107659 | 0.0526767 | 0.0688073 | 0.0103047 | 0.0075221 | 0.0000000 | 0.0492826 |
| proliferating T/NK | 0.0224990 | 0.0320242 | 0.0040541 | 0.0204156 | 0.0088268 | 0.0031067 | 0.0319767 | 0.0184587 | 0.0140625 | 0.0092279 | 0.0072805 | 0.0068807 | 0.0259857 | 0.0163717 | 0.0051948 | 0.0218341 |
| plasmacytoid DCs | 0.0008035 | 0.0126888 | 0.0027027 | 0.0010937 | 0.0044134 | 0.0006904 | 0.0155039 | 0.0059991 | 0.0067708 | 0.0018456 | 0.0029979 | 0.0034404 | 0.0318100 | 0.0168142 | 0.0077922 | 0.0118528 |
| ionocytes | 0.0004018 | 0.0030211 | 0.0067568 | 0.0029165 | 0.0044134 | 0.0072489 | 0.0029070 | 0.0013844 | 0.0000000 | 0.0009228 | 0.0111349 | 0.0068807 | 0.0015681 | 0.0035398 | 0.0000000 | 0.0031192 |
| mesothelial cells | 0.0164725 | 0.0006042 | 0.0013514 | 0.0010937 | 0.0000000 | 0.0003452 | 0.0009690 | 0.0000000 | 0.0026042 | 0.0021532 | 0.0098501 | 0.0000000 | 0.0000000 | 0.0000000 | 0.0012987 | 0.0043668 |
| plasma B cells | 0.0008035 | 0.0024169 | 0.0000000 | 0.0014583 | 0.0011033 | 0.0000000 | 0.0009690 | 0.0046147 | 0.0010417 | 0.0003076 | 0.0000000 | 0.0000000 | 0.0098566 | 0.0000000 | 0.0000000 | 0.0024953 |
Nasal_brushings
| eAIR003 | eAIR004 | eAIR005 | eAIR006 | eAIR007 | eAIR008 | eAIR009 | eAIR010 | eAIR011 | eAIR013 | eAIR014 | eAIR016 | eAIR017 | eAIR018 | eAIR019 | eAIR020 | eAIR021 | eAIR022 | eAIR023 | eAIR024 | eAIR025 | eAIR026 | eAIR027 | eAIR028 | eAIR030 | eAIR031 | eAIR032 | eAIR033 | eAIR037 | eAIR038 | eAIR042 | eAIR047 | |
|---|---|---|---|---|---|---|---|---|---|---|---|---|---|---|---|---|---|---|---|---|---|---|---|---|---|---|---|---|---|---|---|---|
| CD8 T cells | 0.0976220 | 0.2217659 | 0.3738318 | 0.2816242 | 0.0996399 | 0.7310606 | 0.4419396 | 0.2388132 | 0.2393661 | 0.1926033 | 0.3207547 | 0.0718542 | 0.1064426 | 0.2384287 | 0.1853408 | 0.4575107 | 0.2500772 | 0.3386454 | 0.1813631 | 0.0967742 | 0.0122750 | 0.0685835 | 0.2667221 | 0.0649401 | 0.0008803 | 0.0124378 | 0.0267261 | 0.2416251 | 0.2313938 | 0.2319289 | 0.3355388 | 0.1589958 |
| B cells | 0.0012516 | 0.0287474 | 0.0404984 | 0.3019261 | 0.1404562 | 0.0833333 | 0.0233943 | 0.0894942 | 0.0558799 | 0.0249760 | 0.0987791 | 0.0897301 | 0.0336134 | 0.0328867 | 0.3104575 | 0.0291845 | 0.1216425 | 0.3282426 | 0.6777050 | 0.0164223 | 0.0016367 | 0.0296960 | 0.0577482 | 0.1741399 | 0.0044014 | 0.0024876 | 0.0133630 | 0.4236161 | 0.1428958 | 0.0143023 | 0.0223693 | 0.0120874 |
| goblet/club/basal cells | 0.3591990 | 0.0061602 | 0.4922118 | 0.2675690 | 0.4669868 | 0.0672348 | 0.2384092 | 0.4139105 | 0.3261051 | 0.5374640 | 0.3235294 | 0.2323870 | 0.5462185 | 0.4199147 | 0.1783380 | 0.2257511 | 0.3491818 | 0.1367862 | 0.0581440 | 0.0563050 | 0.4705401 | 0.0525572 | 0.3444121 | 0.3254735 | 0.3855634 | 0.8097015 | 0.5534521 | 0.1420765 | 0.2167794 | 0.1785852 | 0.3260870 | 0.4923291 |
| ciliated cells | 0.5081352 | 0.5585216 | 0.0498442 | 0.0546590 | 0.1368547 | 0.0369318 | 0.2065079 | 0.1211089 | 0.2685571 | 0.1383285 | 0.0965594 | 0.2723449 | 0.1372549 | 0.1763094 | 0.0774977 | 0.1364807 | 0.1642482 | 0.0861000 | 0.0489026 | 0.0023460 | 0.4402619 | 0.1640349 | 0.1445783 | 0.0096637 | 0.5290493 | 0.0049751 | 0.0055679 | 0.0845807 | 0.1899865 | 0.5133359 | 0.1468179 | 0.3100883 |
| NK-T cells | 0.0075094 | 0.0020534 | 0.0124611 | 0.0317543 | 0.0420168 | 0.0227273 | 0.0508294 | 0.0418288 | 0.0350292 | 0.0139289 | 0.0774140 | 0.0045566 | 0.0056022 | 0.0630329 | 0.0205415 | 0.0163090 | 0.0182155 | 0.0064188 | 0.0003851 | 0.1771261 | 0.0016367 | 0.2667924 | 0.0627337 | 0.0421337 | 0.0000000 | 0.0012438 | 0.0044543 | 0.0080779 | 0.1491204 | 0.0173947 | 0.0453686 | 0.0013947 |
| monocyte and neutrophil-like | 0.0025031 | 0.0266940 | 0.0155763 | 0.0182197 | 0.0348139 | 0.0170455 | 0.0061676 | 0.0165370 | 0.0442035 | 0.0163305 | 0.0249723 | 0.0126183 | 0.0532213 | 0.0173569 | 0.0074697 | 0.0746781 | 0.0379747 | 0.0070828 | 0.0007701 | 0.2049853 | 0.0220949 | 0.1143059 | 0.0411300 | 0.0519907 | 0.0184859 | 0.0559701 | 0.1469933 | 0.0144928 | 0.0059540 | 0.0092772 | 0.0415879 | 0.0046490 |
| viral-activated cells | 0.0075094 | 0.0000000 | 0.0031153 | 0.0005206 | 0.0096038 | 0.0009470 | 0.0004254 | 0.0092412 | 0.0008340 | 0.0038425 | 0.0044395 | 0.0000000 | 0.0000000 | 0.0137028 | 0.0009337 | 0.0008584 | 0.0018524 | 0.0002213 | 0.0000000 | 0.3595308 | 0.0000000 | 0.2679708 | 0.0078936 | 0.0023193 | 0.0000000 | 0.0223881 | 0.0055679 | 0.0002376 | 0.0154263 | 0.0003865 | 0.0267801 | 0.0000000 |
| neutrophils | 0.0000000 | 0.0010267 | 0.0062305 | 0.0020822 | 0.0096038 | 0.0018939 | 0.0002127 | 0.0082685 | 0.0050042 | 0.0004803 | 0.0185905 | 0.0000000 | 0.0924370 | 0.0076127 | 0.0014006 | 0.0154506 | 0.0237728 | 0.0044267 | 0.0003851 | 0.0020528 | 0.0008183 | 0.0037709 | 0.0186955 | 0.2642056 | 0.0000000 | 0.0000000 | 0.0022272 | 0.0161559 | 0.0010825 | 0.0000000 | 0.0034657 | 0.0004649 |
| proliferating epithelial cells | 0.0000000 | 0.0010267 | 0.0031153 | 0.0062467 | 0.0108043 | 0.0018939 | 0.0197788 | 0.0252918 | 0.0016681 | 0.0302594 | 0.0102664 | 0.0133193 | 0.0140056 | 0.0185749 | 0.0018674 | 0.0017167 | 0.0108058 | 0.0033201 | 0.0000000 | 0.0052786 | 0.0090016 | 0.0124912 | 0.0245118 | 0.0365288 | 0.0457746 | 0.0534826 | 0.0256125 | 0.0102162 | 0.0083897 | 0.0042520 | 0.0141777 | 0.0088331 |
| plasma B cells | 0.0000000 | 0.0061602 | 0.0000000 | 0.0145757 | 0.0060024 | 0.0246212 | 0.0004254 | 0.0131323 | 0.0000000 | 0.0000000 | 0.0088790 | 0.0073607 | 0.0000000 | 0.0000000 | 0.1069094 | 0.0000000 | 0.0006175 | 0.0542275 | 0.0173277 | 0.0000000 | 0.0000000 | 0.0000000 | 0.0033236 | 0.0042520 | 0.0008803 | 0.0000000 | 0.0000000 | 0.0411024 | 0.0230041 | 0.0000000 | 0.0000000 | 0.0000000 |
| proliferating T/NK | 0.0012516 | 0.0010267 | 0.0031153 | 0.0176991 | 0.0060024 | 0.0066288 | 0.0089324 | 0.0131323 | 0.0075063 | 0.0028818 | 0.0044395 | 0.0084122 | 0.0000000 | 0.0030451 | 0.0966387 | 0.0231760 | 0.0114233 | 0.0214697 | 0.0042357 | 0.0214076 | 0.0008183 | 0.0049493 | 0.0099709 | 0.0115964 | 0.0017606 | 0.0074627 | 0.0111359 | 0.0130672 | 0.0078484 | 0.0015462 | 0.0176434 | 0.0000000 |
| unknown | 0.0000000 | 0.0000000 | 0.0000000 | 0.0000000 | 0.0000000 | 0.0000000 | 0.0000000 | 0.0000000 | 0.0008340 | 0.0024015 | 0.0002775 | 0.2800561 | 0.0000000 | 0.0000000 | 0.0000000 | 0.0000000 | 0.0000000 | 0.0000000 | 0.0000000 | 0.0000000 | 0.0000000 | 0.0000000 | 0.0000000 | 0.0000000 | 0.0000000 | 0.0000000 | 0.0000000 | 0.0000000 | 0.0000000 | 0.0000000 | 0.0000000 | 0.0000000 |
| mast cells | 0.0000000 | 0.0657084 | 0.0000000 | 0.0005206 | 0.0000000 | 0.0009470 | 0.0017014 | 0.0029183 | 0.0058382 | 0.0312200 | 0.0083241 | 0.0007010 | 0.0028011 | 0.0009135 | 0.0028011 | 0.0000000 | 0.0012349 | 0.0048694 | 0.0026954 | 0.0228739 | 0.0180033 | 0.0054207 | 0.0083091 | 0.0021260 | 0.0052817 | 0.0024876 | 0.1525612 | 0.0007128 | 0.0021651 | 0.0255122 | 0.0138626 | 0.0032543 |
| ionocytes | 0.0150188 | 0.0164271 | 0.0000000 | 0.0015617 | 0.0132053 | 0.0028409 | 0.0006380 | 0.0029183 | 0.0091743 | 0.0028818 | 0.0013873 | 0.0038556 | 0.0084034 | 0.0009135 | 0.0060691 | 0.0137339 | 0.0027786 | 0.0042054 | 0.0069311 | 0.0026393 | 0.0098200 | 0.0018855 | 0.0074782 | 0.0079242 | 0.0035211 | 0.0024876 | 0.0122494 | 0.0002376 | 0.0037889 | 0.0030924 | 0.0028355 | 0.0074384 |
| plasmacytoid DCs | 0.0000000 | 0.0287474 | 0.0000000 | 0.0005206 | 0.0024010 | 0.0018939 | 0.0004254 | 0.0029183 | 0.0000000 | 0.0009606 | 0.0005549 | 0.0024536 | 0.0000000 | 0.0018270 | 0.0000000 | 0.0051502 | 0.0058660 | 0.0004427 | 0.0000000 | 0.0296188 | 0.0073650 | 0.0073062 | 0.0008309 | 0.0009664 | 0.0008803 | 0.0236318 | 0.0400891 | 0.0028510 | 0.0016238 | 0.0003865 | 0.0015753 | 0.0004649 |
| melanocyte | 0.0000000 | 0.0359343 | 0.0000000 | 0.0005206 | 0.0216086 | 0.0000000 | 0.0002127 | 0.0004864 | 0.0000000 | 0.0014409 | 0.0008324 | 0.0003505 | 0.0000000 | 0.0054811 | 0.0037348 | 0.0000000 | 0.0003087 | 0.0035414 | 0.0011552 | 0.0026393 | 0.0057283 | 0.0002357 | 0.0016618 | 0.0017395 | 0.0035211 | 0.0012438 | 0.0000000 | 0.0009503 | 0.0005413 | 0.0000000 | 0.0018904 | 0.0000000 |
Tonsils
| eAIR002 | eAIR004 | eAIR006 | eAIR007 | eAIR008 | eAIR010 | eAIR012 | eAIR013 | eAIR014 | eAIR016 | eAIR017 | eAIR018 | eAIR019 | eAIR020 | eAIR021 | eAIR022 | eAIR024 | eAIR026 | eAIR027 | eAIR031 | eAIR032 | eAIR034 | eAIR037 | eAIR040 | eAIR042 | eAIR043 | eAIR044 | eAIR048 | eAIR050 | eAIR051 | eAIR055 | eAIR056 | |
|---|---|---|---|---|---|---|---|---|---|---|---|---|---|---|---|---|---|---|---|---|---|---|---|---|---|---|---|---|---|---|---|---|
| naïve B cells | 0.3812593 | 0.2196210 | 0.2189838 | 0.2051616 | 0.3004658 | 0.1997536 | 0.2632775 | 0.1382269 | 0.1101920 | 0.2129964 | 0.2473748 | 0.1290418 | 0.0934486 | 0.1555418 | 0.1968415 | 0.2256278 | 0.3394707 | 0.1516937 | 0.2679669 | 0.1978055 | 0.2877030 | 0.0981139 | 0.0968620 | 0.1856578 | 0.2524734 | 0.1128423 | 0.1464435 | 0.1504905 | 0.1459596 | 0.1748828 | 0.2992940 | 0.1954155 |
| CM CD4 T cells and/or pre TFH cells | 0.1006445 | 0.1574136 | 0.1243229 | 0.1411841 | 0.1137422 | 0.1040854 | 0.0991196 | 0.1307912 | 0.1497784 | 0.1421982 | 0.2051696 | 0.1056066 | 0.1446625 | 0.1002794 | 0.0800902 | 0.1340473 | 0.1371692 | 0.1428571 | 0.1586962 | 0.1103203 | 0.1535963 | 0.1799057 | 0.1122801 | 0.2122574 | 0.1415525 | 0.2271010 | 0.2077283 | 0.1448549 | 0.2020202 | 0.2048735 | 0.1477559 | 0.1673352 |
| Germinal centre B cell: DZ-LZ transition and/or LZ and/or LZ-DZ | 0.1311353 | 0.1250836 | 0.1697189 | 0.0923878 | 0.1199534 | 0.1597208 | 0.1178642 | 0.1199237 | 0.0986706 | 0.1466105 | 0.0795638 | 0.2272323 | 0.2311274 | 0.1974542 | 0.2053017 | 0.1872230 | 0.0708861 | 0.2306333 | 0.1338499 | 0.0747331 | 0.0581593 | 0.1282191 | 0.1052059 | 0.0264198 | 0.0616438 | 0.1355052 | 0.0703913 | 0.0434147 | 0.0670034 | 0.0886598 | 0.0335350 | 0.1002865 |
| memory B cells | 0.0369360 | 0.1302118 | 0.0595822 | 0.0724355 | 0.1207298 | 0.0398276 | 0.1167282 | 0.0890372 | 0.0977843 | 0.0549539 | 0.0775444 | 0.0344112 | 0.0425673 | 0.0493636 | 0.0679639 | 0.0468981 | 0.1272727 | 0.0379971 | 0.0537002 | 0.1651839 | 0.1040990 | 0.1559666 | 0.0613096 | 0.1272466 | 0.1236682 | 0.0979698 | 0.1417672 | 0.0632436 | 0.1117845 | 0.0980319 | 0.0796773 | 0.1308500 |
| naïve CD4 T cells | 0.0629648 | 0.0622074 | 0.0799587 | 0.0934721 | 0.0481366 | 0.1178403 | 0.0443056 | 0.1061964 | 0.1270310 | 0.0459286 | 0.0500808 | 0.0412341 | 0.0269371 | 0.0484322 | 0.0800902 | 0.0347120 | 0.0568470 | 0.0350515 | 0.0641197 | 0.0762159 | 0.0583140 | 0.0658324 | 0.0448032 | 0.1356937 | 0.0591705 | 0.0675165 | 0.0824514 | 0.1644751 | 0.1060606 | 0.0361762 | 0.1106909 | 0.0259790 |
| Cycling GM B cells | 0.0523054 | 0.0742475 | 0.0794429 | 0.0800260 | 0.0423137 | 0.0845822 | 0.0715706 | 0.0955195 | 0.0685377 | 0.1075010 | 0.0383683 | 0.1323050 | 0.1030928 | 0.1080410 | 0.0733221 | 0.0801329 | 0.0451093 | 0.1310751 | 0.0961795 | 0.1070581 | 0.0685228 | 0.0781647 | 0.0926900 | 0.0289360 | 0.0702055 | 0.1019830 | 0.0854049 | 0.0667919 | 0.0843434 | 0.1190253 | 0.0360565 | 0.0758357 |
| DZ B cells (early or late phase) | 0.0877541 | 0.0637681 | 0.0949188 | 0.0652787 | 0.0652174 | 0.0995689 | 0.0590741 | 0.0844614 | 0.0437223 | 0.0738067 | 0.0470517 | 0.1423910 | 0.1143997 | 0.1409500 | 0.1144952 | 0.1203840 | 0.0326812 | 0.1054492 | 0.0558376 | 0.0708778 | 0.0501160 | 0.0634748 | 0.0653002 | 0.0129403 | 0.0376712 | 0.0533522 | 0.0386414 | 0.0250470 | 0.0425926 | 0.0620431 | 0.0189107 | 0.0651385 |
| CD8 T cells | 0.0123946 | 0.0185061 | 0.0281145 | 0.0346996 | 0.0151398 | 0.0217614 | 0.0184607 | 0.0629171 | 0.0463811 | 0.0521460 | 0.0648223 | 0.0157223 | 0.0658464 | 0.0298044 | 0.0191765 | 0.0472674 | 0.0324511 | 0.0170839 | 0.0122896 | 0.0361803 | 0.0635731 | 0.0252086 | 0.0631235 | 0.0656003 | 0.0753425 | 0.0259679 | 0.0462712 | 0.0809852 | 0.0575758 | 0.0575445 | 0.0655572 | 0.0668577 |
| Regulatory CD4 T cells | 0.0146257 | 0.0283166 | 0.0299200 | 0.0290609 | 0.0308618 | 0.0373640 | 0.0278330 | 0.0465205 | 0.0573117 | 0.0238668 | 0.0454362 | 0.0222486 | 0.0329232 | 0.0298044 | 0.0442752 | 0.0343427 | 0.0269275 | 0.0371134 | 0.0374032 | 0.0483393 | 0.0397525 | 0.0433442 | 0.0272084 | 0.0702732 | 0.0618341 | 0.0472144 | 0.0425794 | 0.0705489 | 0.0599327 | 0.0423618 | 0.0529501 | 0.0605540 |
| Naive B cell activated | 0.0557759 | 0.0376812 | 0.0345628 | 0.0351334 | 0.0362966 | 0.0234038 | 0.0454416 | 0.0158246 | 0.0262925 | 0.0377056 | 0.0512924 | 0.0192821 | 0.0133023 | 0.0294939 | 0.0346870 | 0.0336041 | 0.0695052 | 0.0170839 | 0.0309912 | 0.0438909 | 0.0477958 | 0.0119695 | 0.0067114 | 0.0434939 | 0.0348174 | 0.0280925 | 0.0206744 | 0.0229597 | 0.0126263 | 0.0346767 | 0.0683308 | 0.0324737 |
| naïve CD8 T cells | 0.0180962 | 0.0258640 | 0.0304359 | 0.0570375 | 0.0364907 | 0.0371587 | 0.0332292 | 0.0491897 | 0.0407681 | 0.0216606 | 0.0056543 | 0.0109760 | 0.0076488 | 0.0114871 | 0.0214326 | 0.0073855 | 0.0140391 | 0.0182622 | 0.0251135 | 0.0145314 | 0.0131477 | 0.0308306 | 0.0362779 | 0.0330697 | 0.0211187 | 0.0141643 | 0.0283042 | 0.0653308 | 0.0240741 | 0.0142455 | 0.0292486 | 0.0106972 |
| activated DC3 (aDC3)? | 0.0049579 | 0.0120401 | 0.0118648 | 0.0043375 | 0.0085404 | 0.0090331 | 0.0119284 | 0.0106768 | 0.0091581 | 0.0204573 | 0.0068659 | 0.0151290 | 0.0222813 | 0.0170754 | 0.0169205 | 0.0199409 | 0.0098964 | 0.0223859 | 0.0240449 | 0.0088968 | 0.0106729 | 0.0230323 | 0.0137856 | 0.0152768 | 0.0197869 | 0.0302172 | 0.0265813 | 0.0185765 | 0.0274411 | 0.0269916 | 0.0153807 | 0.0336199 |
| monocytes/macrophages | 0.0012395 | 0.0095875 | 0.0059324 | 0.0199523 | 0.0081522 | 0.0104701 | 0.0090883 | 0.0101049 | 0.0457903 | 0.0230646 | 0.0163570 | 0.0471670 | 0.0079814 | 0.0086930 | 0.0155104 | 0.0088626 | 0.0046030 | 0.0091311 | 0.0106866 | 0.0080071 | 0.0032483 | 0.0081610 | 0.0172320 | 0.0082674 | 0.0072298 | 0.0127479 | 0.0103372 | 0.0160718 | 0.0107744 | 0.0082474 | 0.0098336 | 0.0051576 |
| interferon-activated naïve B cells | 0.0027268 | 0.0024526 | 0.0041269 | 0.0325309 | 0.0027174 | 0.0207350 | 0.0258449 | 0.0040038 | 0.0109306 | 0.0030084 | 0.0042407 | 0.0284782 | 0.0053209 | 0.0086930 | 0.0059222 | 0.0025849 | 0.0039125 | 0.0117820 | 0.0037403 | 0.0035587 | 0.0051044 | 0.0313747 | 0.0950481 | 0.0007189 | 0.0036149 | 0.0007082 | 0.0019690 | 0.0085577 | 0.0084175 | 0.0013121 | 0.0045386 | 0.0022923 |
| plasma cells | 0.0242935 | 0.0066890 | 0.0028372 | 0.0028193 | 0.0050466 | 0.0036953 | 0.0045442 | 0.0101049 | 0.0076809 | 0.0042118 | 0.0260501 | 0.0029665 | 0.0049884 | 0.0180068 | 0.0073322 | 0.0025849 | 0.0144994 | 0.0064801 | 0.0053433 | 0.0038553 | 0.0058778 | 0.0152339 | 0.0067114 | 0.0095255 | 0.0064688 | 0.0110954 | 0.0091066 | 0.0062617 | 0.0067340 | 0.0073102 | 0.0047907 | 0.0078319 |
| interferon-activated T cells | 0.0017353 | 0.0008919 | 0.0023214 | 0.0078074 | 0.0009705 | 0.0022583 | 0.0235728 | 0.0055291 | 0.0020679 | 0.0008022 | 0.0042407 | 0.0011866 | 0.0073163 | 0.0015523 | 0.0028201 | 0.0007386 | 0.0009206 | 0.0029455 | 0.0024045 | 0.0017794 | 0.0029389 | 0.0174102 | 0.1091964 | 0.0014378 | 0.0007610 | 0.0018886 | 0.0004922 | 0.0043832 | 0.0070707 | 0.0009372 | 0.0027736 | 0.0005731 |
| follicular dendritic cells | 0.0004958 | 0.0122631 | 0.0054166 | 0.0065062 | 0.0054348 | 0.0108807 | 0.0028401 | 0.0043851 | 0.0197932 | 0.0044124 | 0.0012116 | 0.0038564 | 0.0372464 | 0.0043465 | 0.0042301 | 0.0044313 | 0.0027618 | 0.0053019 | 0.0021373 | 0.0065243 | 0.0003094 | 0.0018136 | 0.0237620 | 0.0034148 | 0.0081811 | 0.0160529 | 0.0127984 | 0.0227510 | 0.0038721 | 0.0020619 | 0.0015129 | 0.0028653 |
| double negative T cells | 0.0012395 | 0.0035674 | 0.0041269 | 0.0091087 | 0.0106755 | 0.0057483 | 0.0124964 | 0.0080076 | 0.0135894 | 0.0032090 | 0.0052504 | 0.0083061 | 0.0043232 | 0.0043465 | 0.0042301 | 0.0040620 | 0.0057537 | 0.0082474 | 0.0045418 | 0.0068209 | 0.0095901 | 0.0023576 | 0.0088881 | 0.0053918 | 0.0070396 | 0.0089707 | 0.0120601 | 0.0064705 | 0.0092593 | 0.0119963 | 0.0022693 | 0.0036294 |
| NK cells and/or NK- T cells and/or gamma delta T cells | 0.0054536 | 0.0028986 | 0.0025793 | 0.0032531 | 0.0038820 | 0.0014371 | 0.0048282 | 0.0019066 | 0.0097489 | 0.0060168 | 0.0048465 | 0.0035598 | 0.0036581 | 0.0015523 | 0.0019741 | 0.0018464 | 0.0027618 | 0.0044183 | 0.0026717 | 0.0074140 | 0.0034029 | 0.0141458 | 0.0068928 | 0.0093458 | 0.0019026 | 0.0037771 | 0.0093527 | 0.0058443 | 0.0077441 | 0.0014995 | 0.0103379 | 0.0049666 |
| neutrophils | 0.0022310 | 0.0020067 | 0.0067062 | 0.0021687 | 0.0027174 | 0.0065695 | 0.0017041 | 0.0005720 | 0.0059084 | 0.0020056 | 0.0147415 | 0.0047464 | 0.0256069 | 0.0083825 | 0.0014100 | 0.0022157 | 0.0006904 | 0.0002946 | 0.0000000 | 0.0029656 | 0.0116009 | 0.0001814 | 0.0010883 | 0.0003595 | 0.0013318 | 0.0007082 | 0.0009845 | 0.0029221 | 0.0000000 | 0.0031865 | 0.0052950 | 0.0038204 |
| Pre-T follicular helper / CD4 Treg | 0.0004958 | 0.0015608 | 0.0018055 | 0.0047712 | 0.0013587 | 0.0036953 | 0.0002840 | 0.0041945 | 0.0038405 | 0.0016045 | 0.0010097 | 0.0026698 | 0.0043232 | 0.0006209 | 0.0016920 | 0.0007386 | 0.0016110 | 0.0032401 | 0.0066791 | 0.0023725 | 0.0018561 | 0.0019949 | 0.0047161 | 0.0017973 | 0.0020928 | 0.0021246 | 0.0022151 | 0.0058443 | 0.0033670 | 0.0024367 | 0.0005043 | 0.0017192 |
| plasmacytoid DCs | 0.0009916 | 0.0026756 | 0.0018055 | 0.0008675 | 0.0032997 | 0.0004106 | 0.0019881 | 0.0019066 | 0.0041359 | 0.0014039 | 0.0008078 | 0.0008899 | 0.0003326 | 0.0012419 | 0.0002820 | 0.0003693 | 0.0000000 | 0.0011782 | 0.0016030 | 0.0023725 | 0.0003094 | 0.0029017 | 0.0007256 | 0.0025162 | 0.0007610 | 0.0000000 | 0.0007384 | 0.0039658 | 0.0011785 | 0.0007498 | 0.0002521 | 0.0009551 |
| epithelial cells | 0.0002479 | 0.0004459 | 0.0005159 | 0.0000000 | 0.0178571 | 0.0000000 | 0.0005680 | 0.0000000 | 0.0000000 | 0.0002006 | 0.0000000 | 0.0002966 | 0.0006651 | 0.0086930 | 0.0000000 | 0.0000000 | 0.0002301 | 0.0002946 | 0.0000000 | 0.0002966 | 0.0003094 | 0.0003627 | 0.0001814 | 0.0003595 | 0.0013318 | 0.0000000 | 0.0027074 | 0.0002087 | 0.0001684 | 0.0007498 | 0.0005043 | 0.0011461 |
| unknown | 0.0000000 | 0.0000000 | 0.0000000 | 0.0000000 | 0.0000000 | 0.0000000 | 0.0034081 | 0.0000000 | 0.0008863 | 0.0102286 | 0.0020194 | 0.0002966 | 0.0000000 | 0.0161441 | 0.0000000 | 0.0000000 | 0.0000000 | 0.0000000 | 0.0000000 | 0.0000000 | 0.0000000 | 0.0000000 | 0.0000000 | 0.0000000 | 0.0000000 | 0.0000000 | 0.0000000 | 0.0000000 | 0.0000000 | 0.0000000 | 0.0000000 | 0.0000000 |
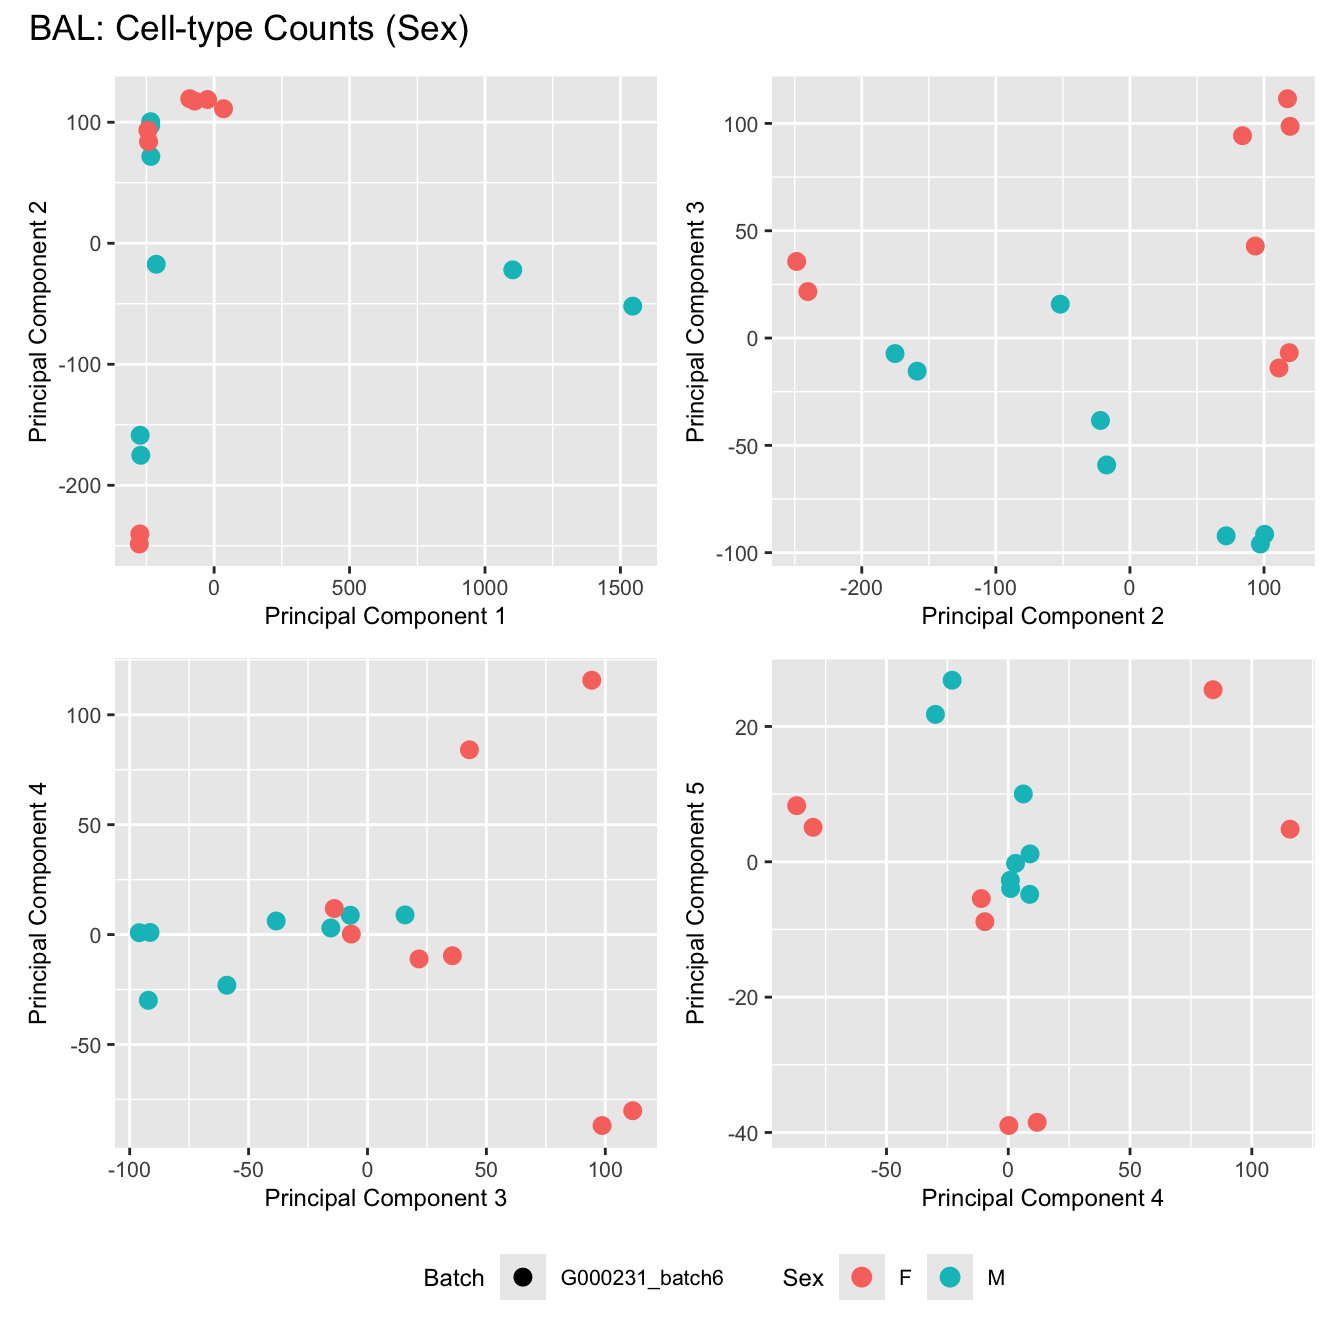
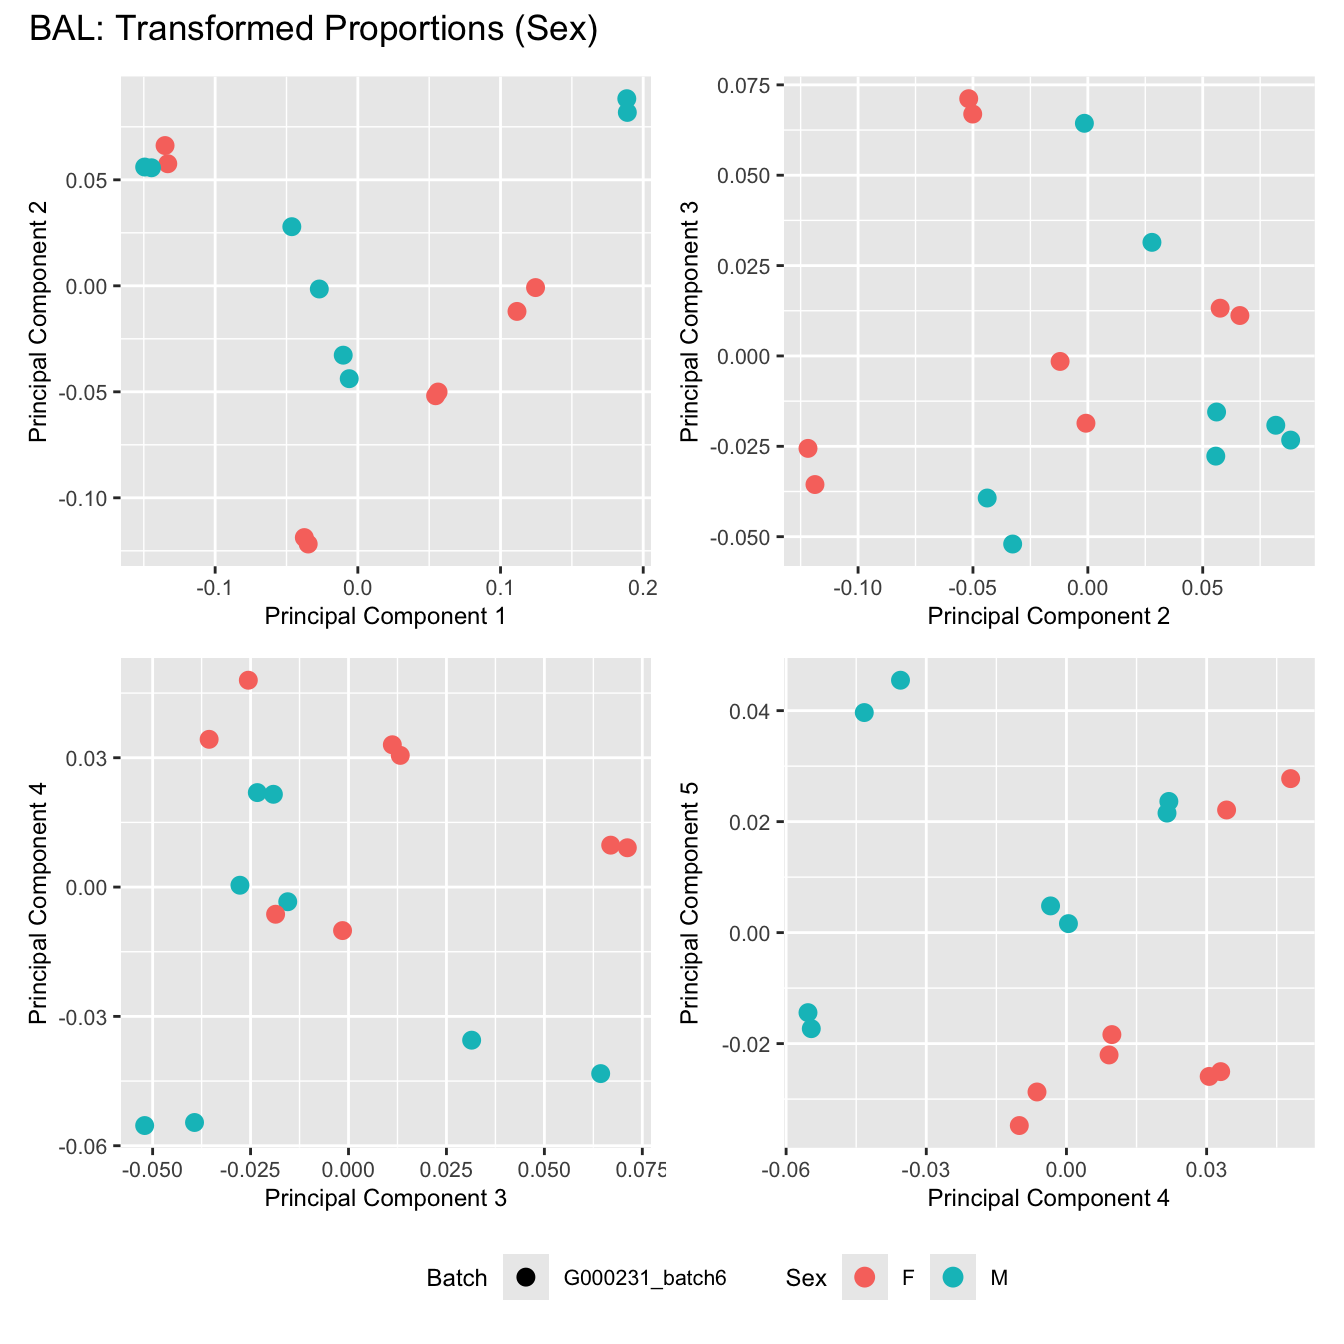
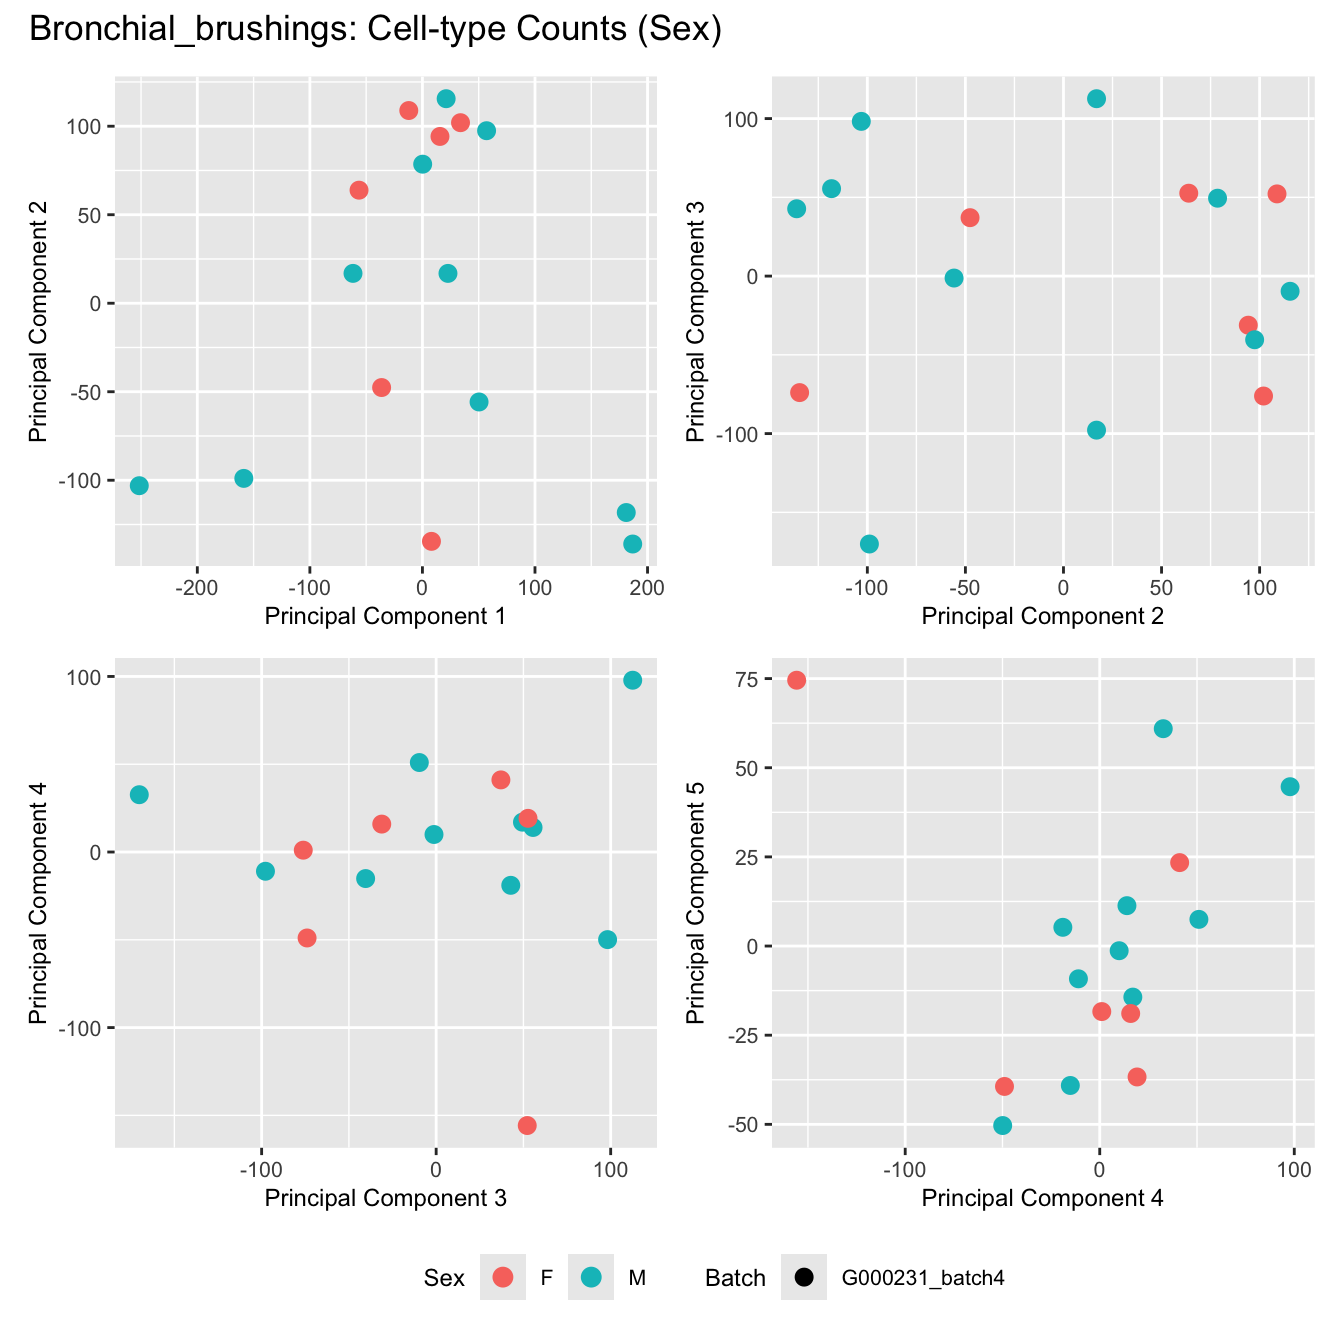
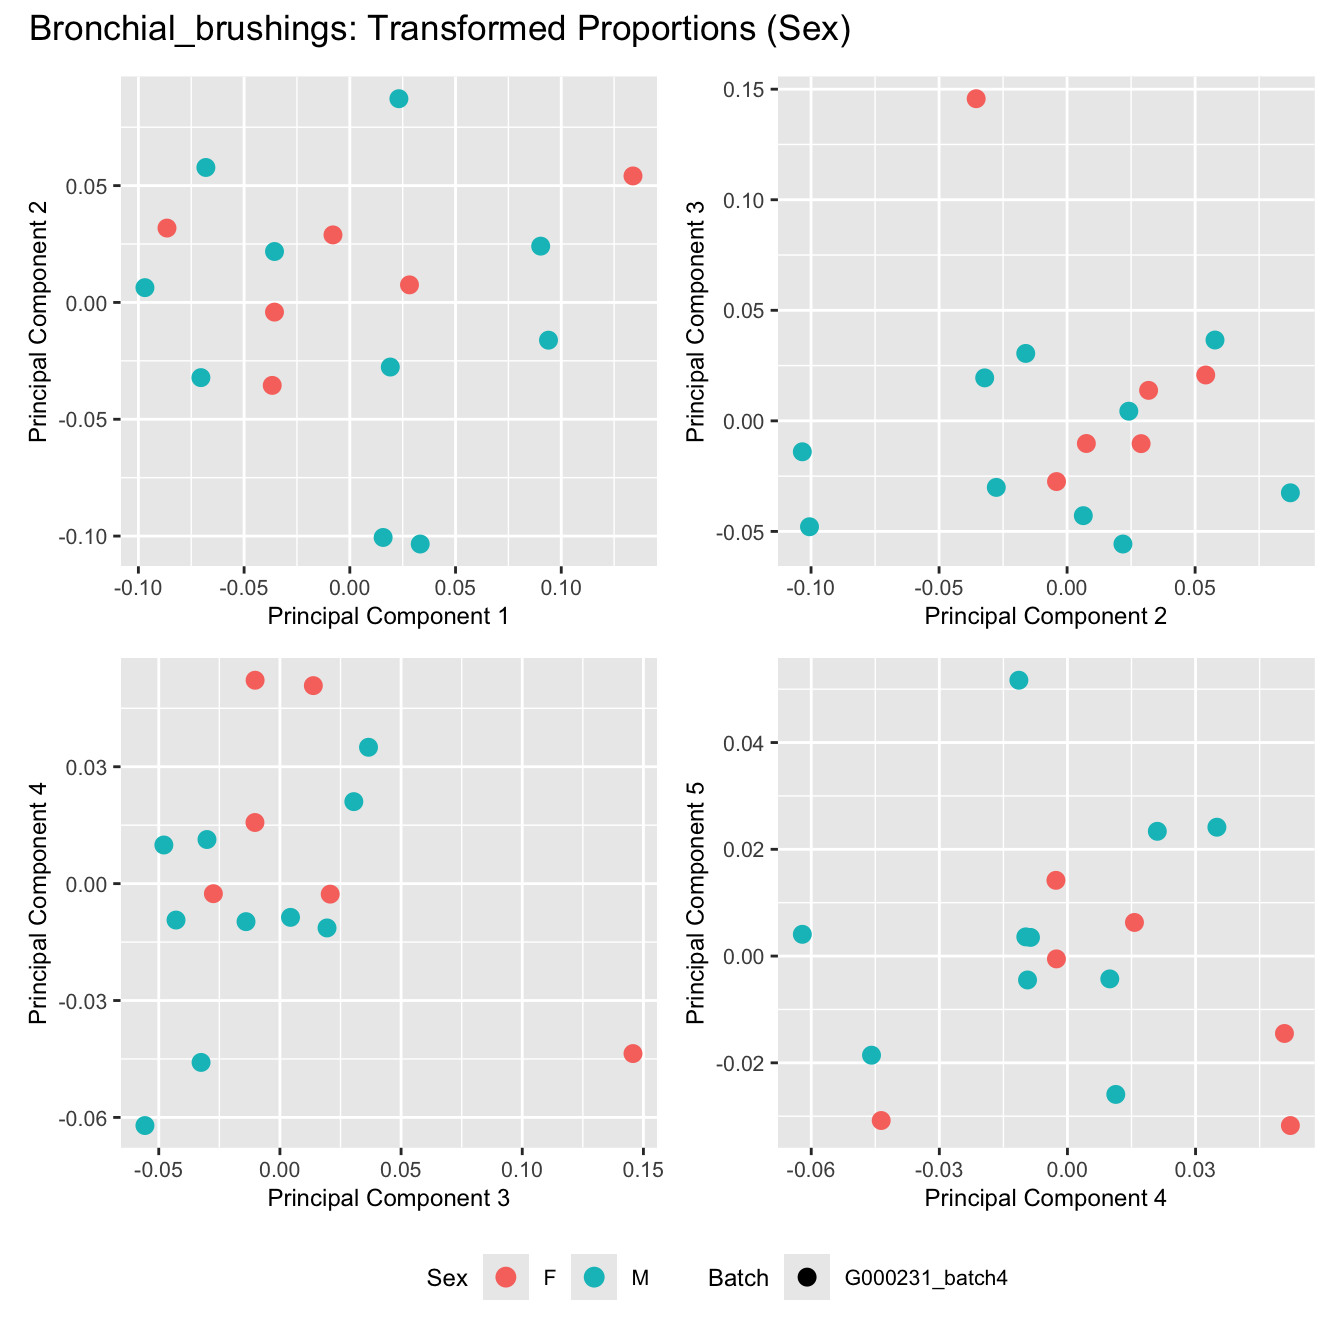
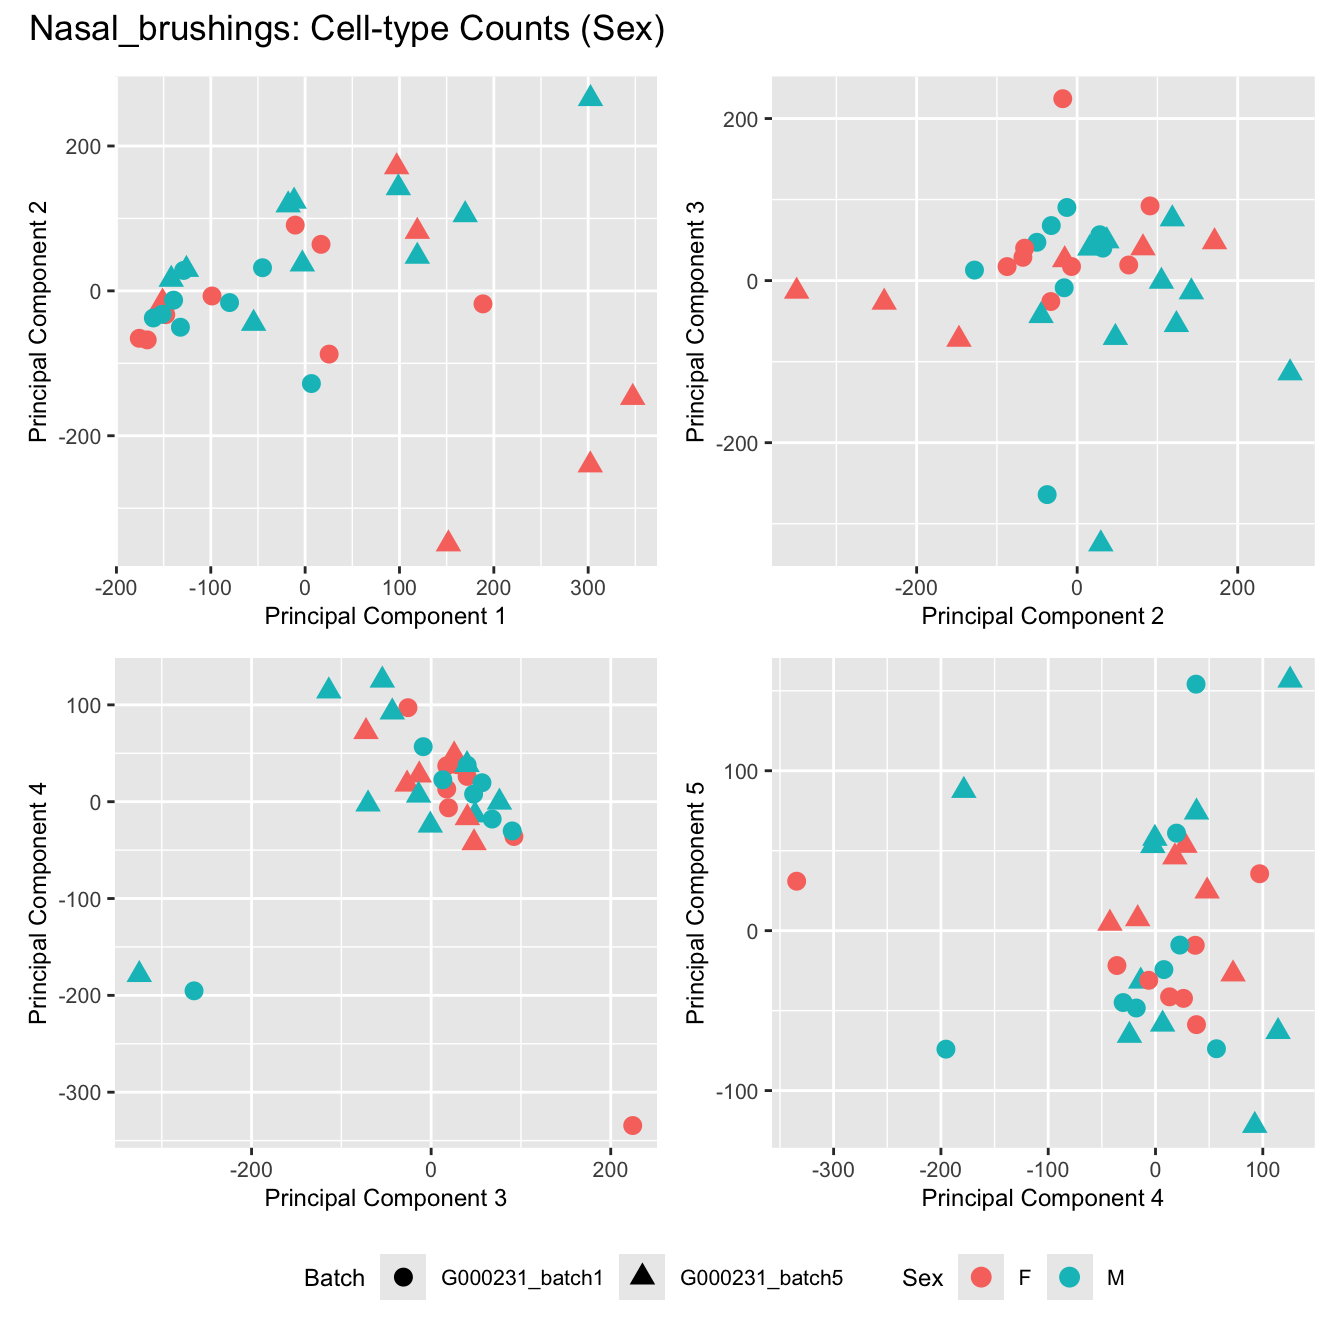
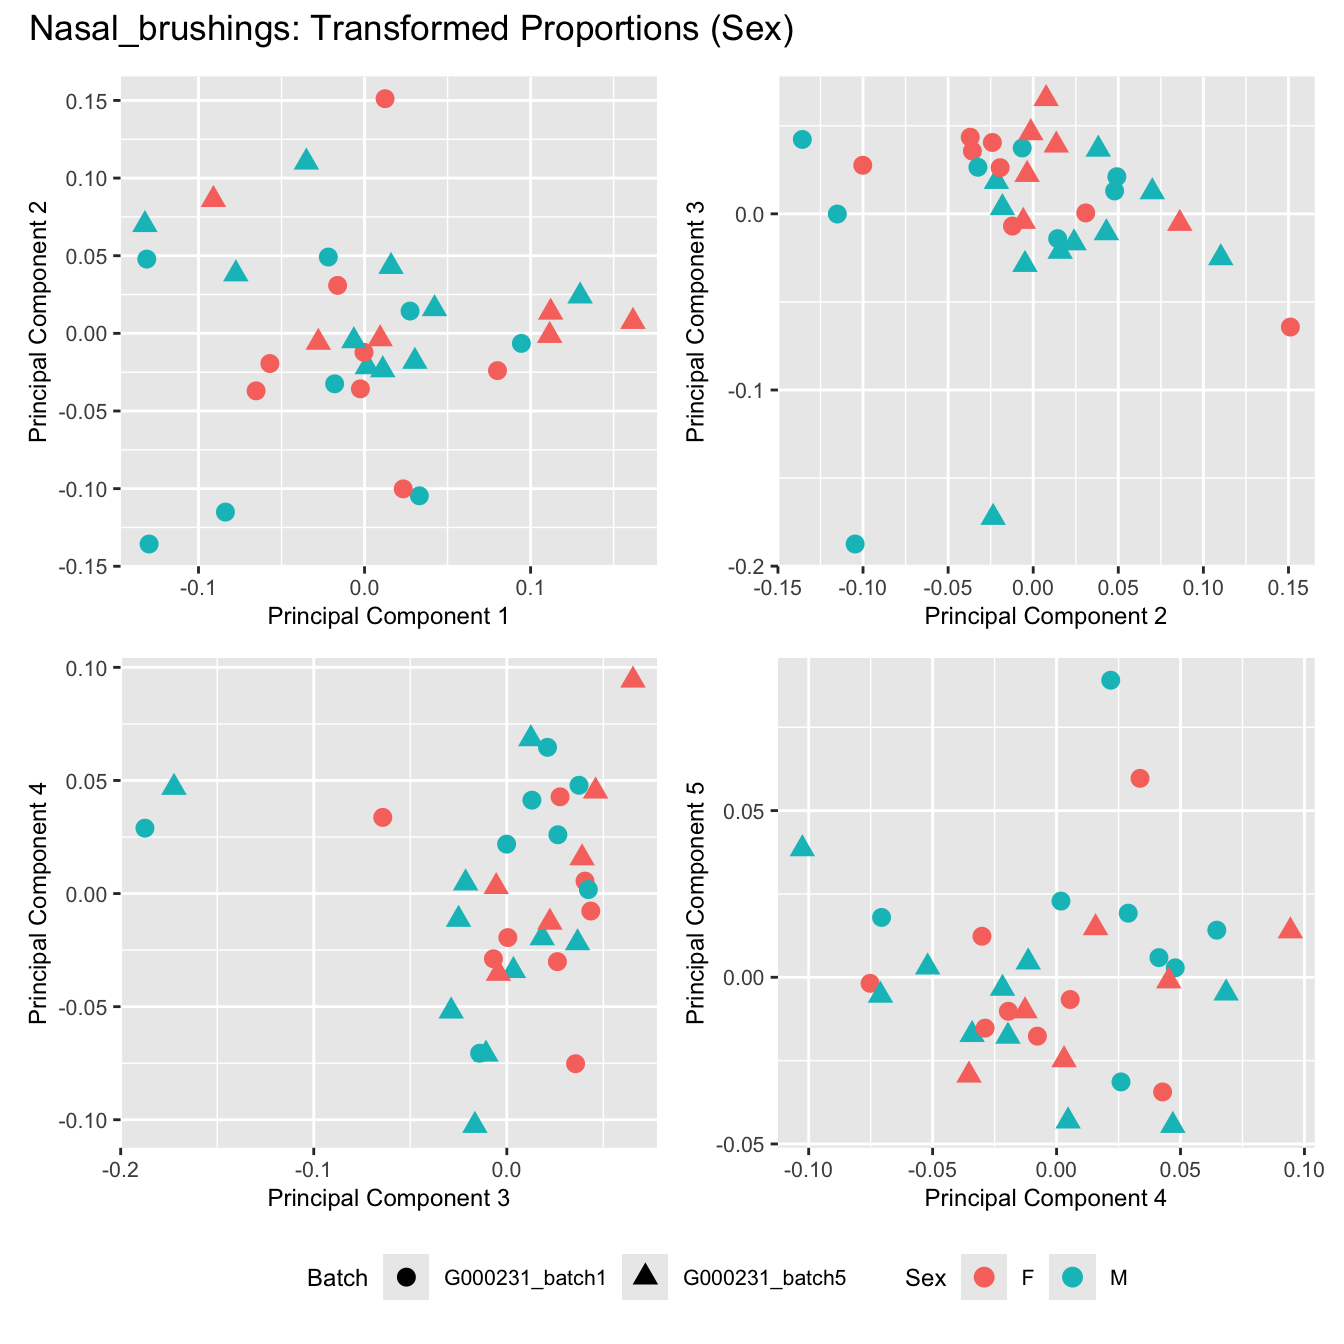
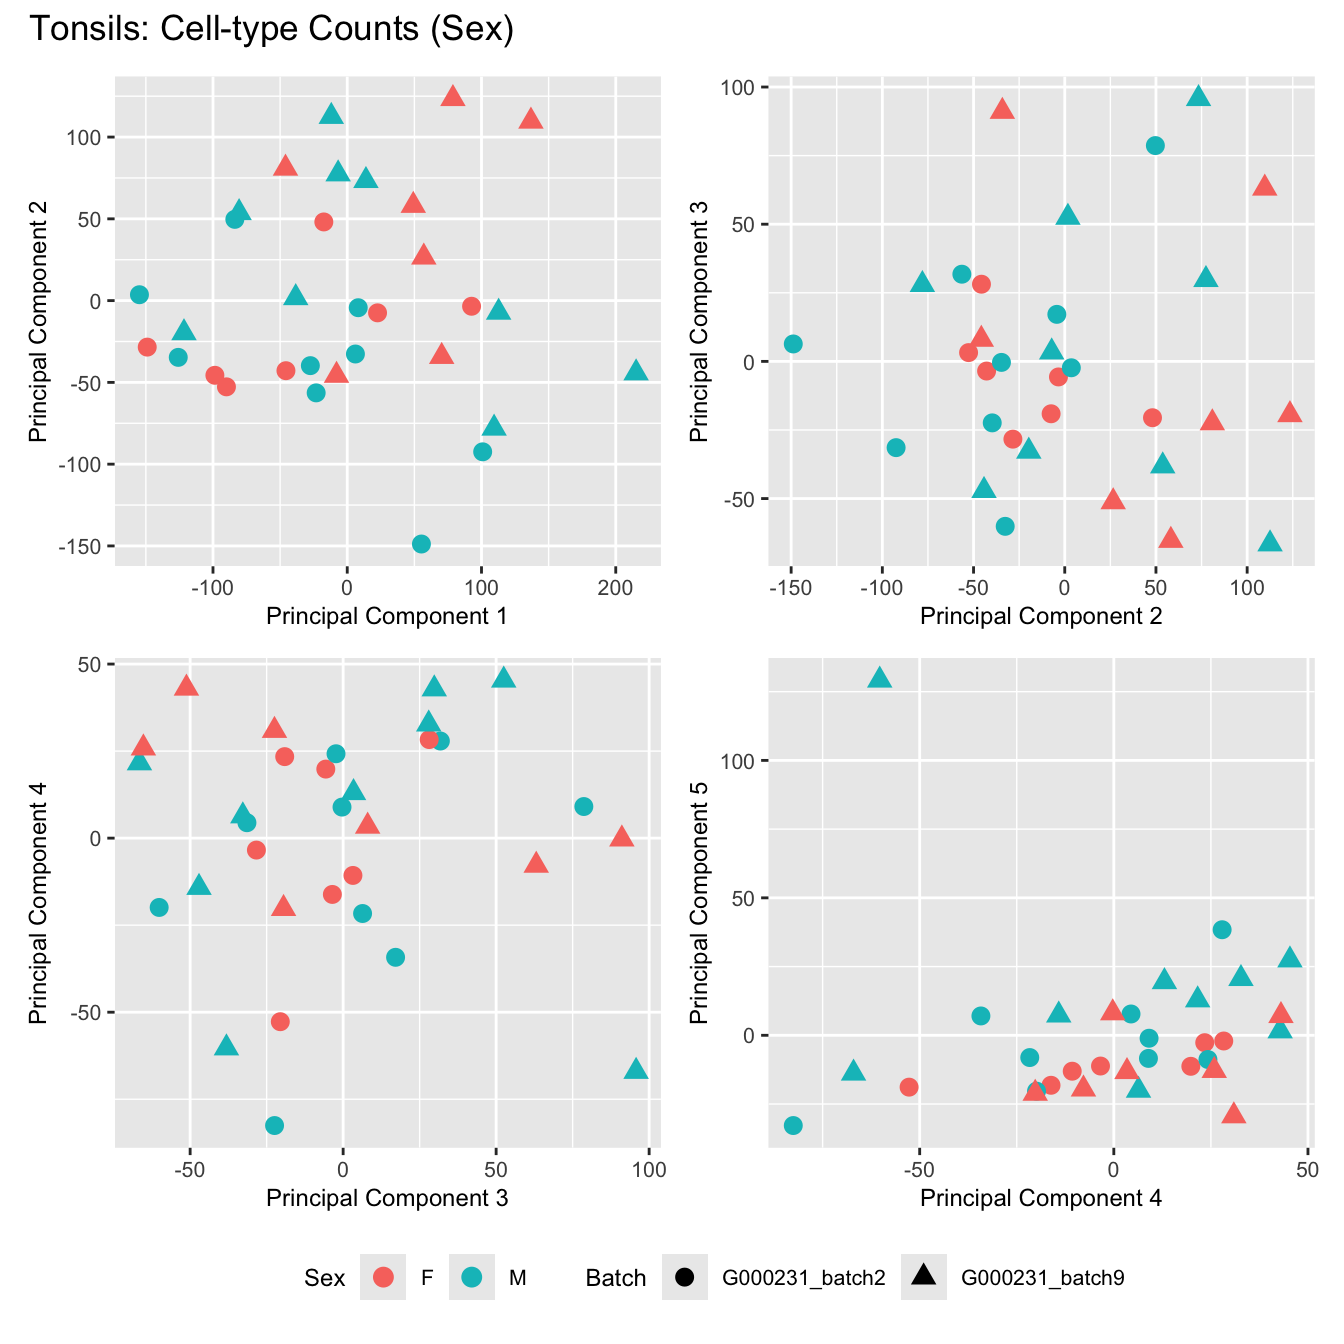
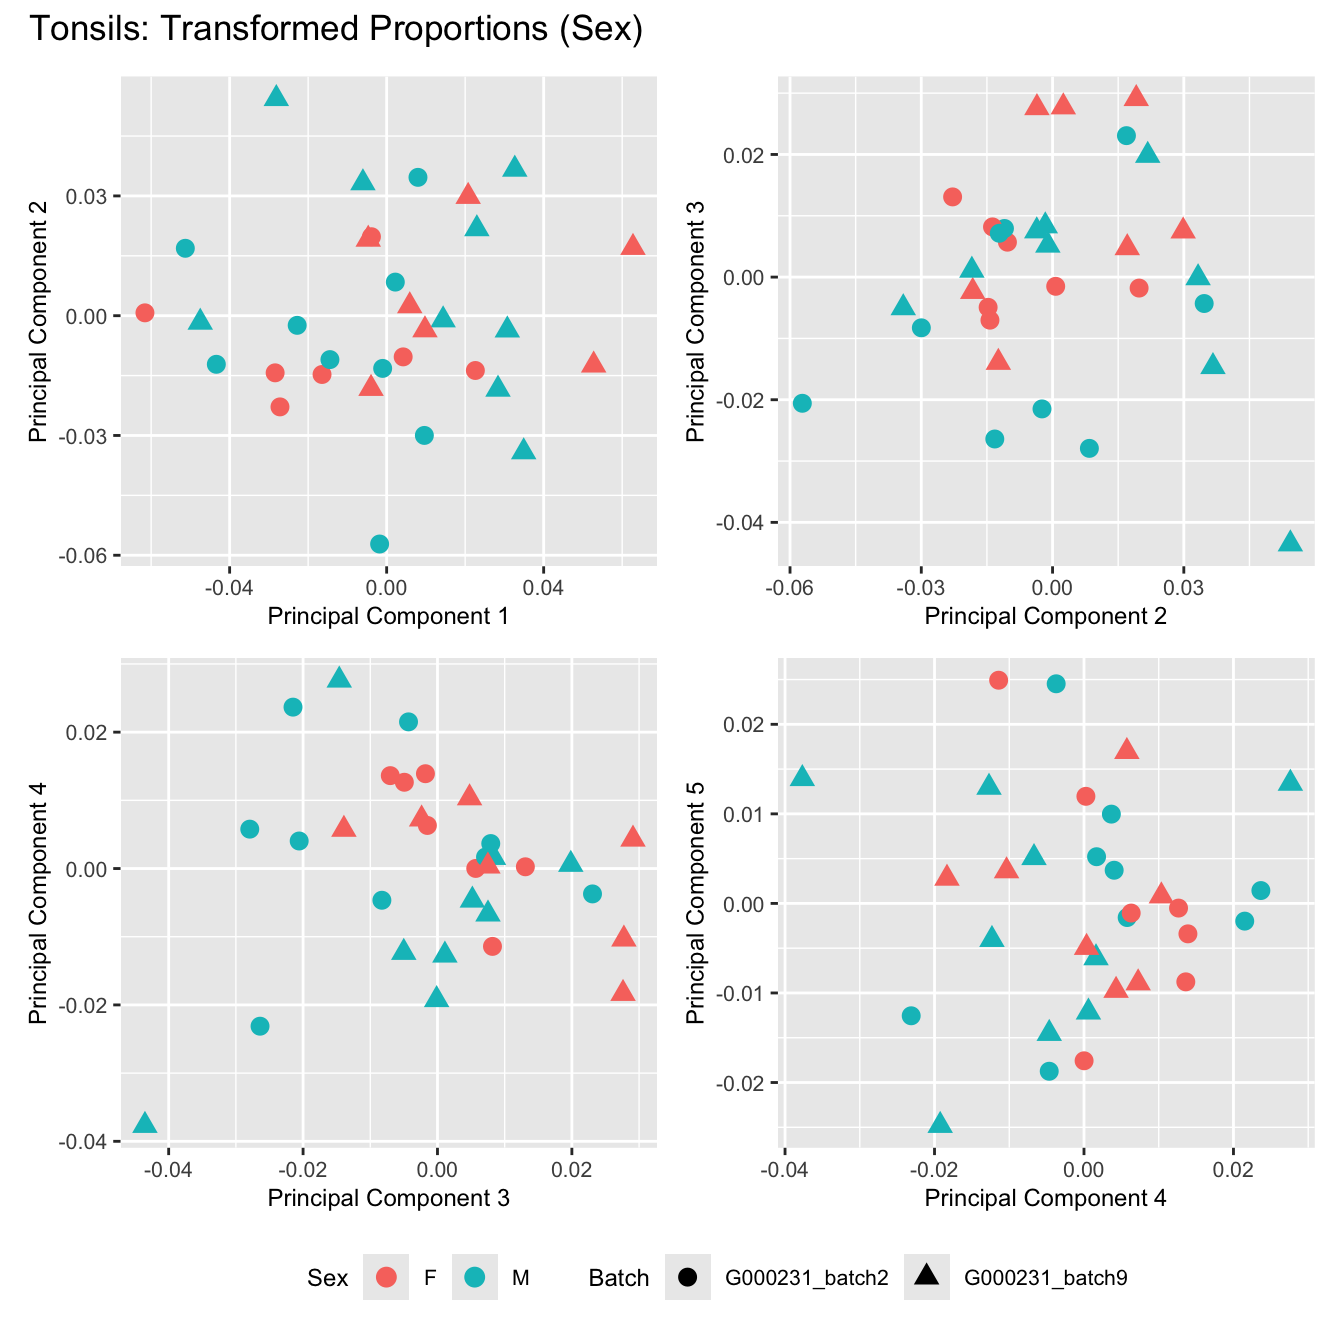
Sources of variations- Sex
dims <- list(c(1,2), c(2:3), c(3,4), c(4,5))
for (tissue_name in names(seurat_objects)) {
tissue_obj <- seurat_objects[[tissue_name]]
props <- getTransformedProps(clusters = tissue_obj$cell_labels,
sample = tissue_obj$Sample, transform = "asin")
plot_list <- list()
for (data_type in c("Counts", "TransformedProps")) {
p <- vector("list", length(dims))
for(i in 1:length(dims)) {
mds <- plotMDS(if (data_type == "Counts") props$Counts else props$TransformedProps,
gene.selection = "common",
plot = FALSE, dim.plot = dims[[i]])
data.frame(x = mds$x,
y = mds$y,
sample = rownames(mds$distance.matrix.squared)) %>%
left_join(tissue_obj@meta.data %>%
dplyr::select(Sample,
batch_name,
age_years,
sex),
by = c("sample" = "Sample")) %>%
distinct() -> dat
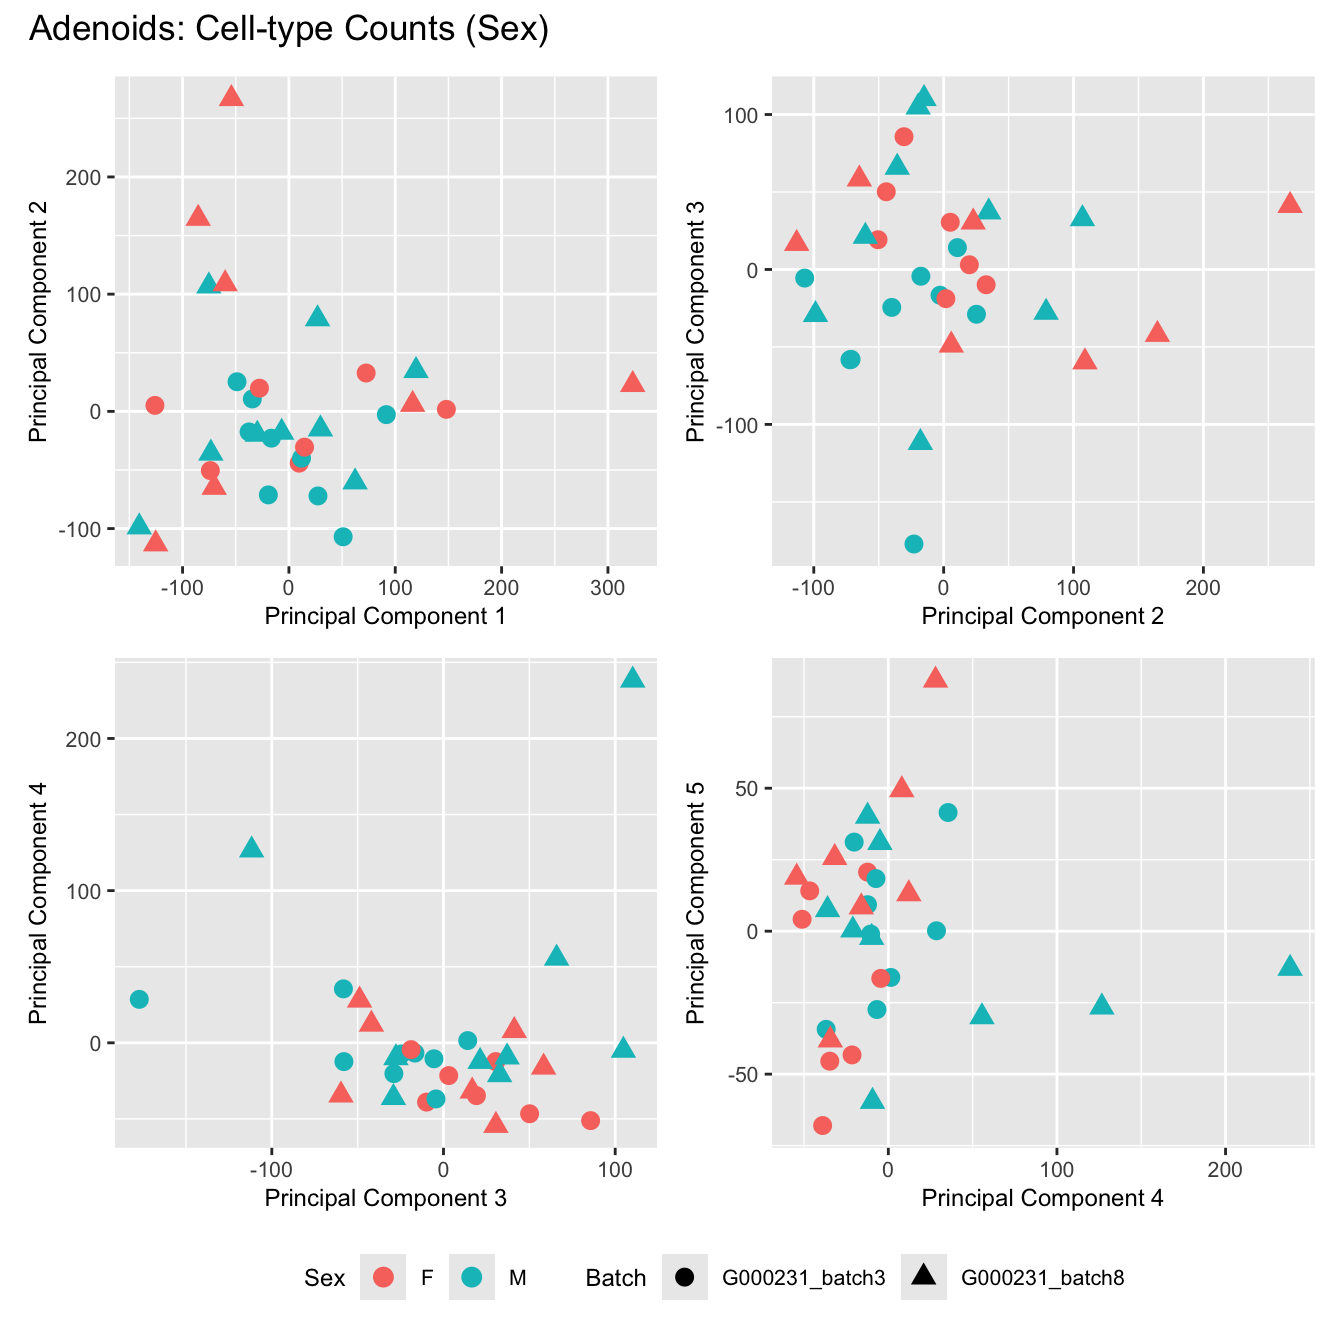
p[[i]] <- ggplot(dat, aes(x = x, y = y,
shape = batch_name,
color = as.factor(sex))) +
geom_point(size = 3) +
labs(x = glue("Principal Component {dims[[i]][1]}"),
y = glue("Principal Component {dims[[i]][2]}"),
colour = "Sex",
shape = "Batch") +
theme(legend.direction = "horizontal",
legend.text = element_text(size = 8),
legend.title = element_text(size = 9),
axis.text = element_text(size = 8),
axis.title = element_text(size = 9))
}
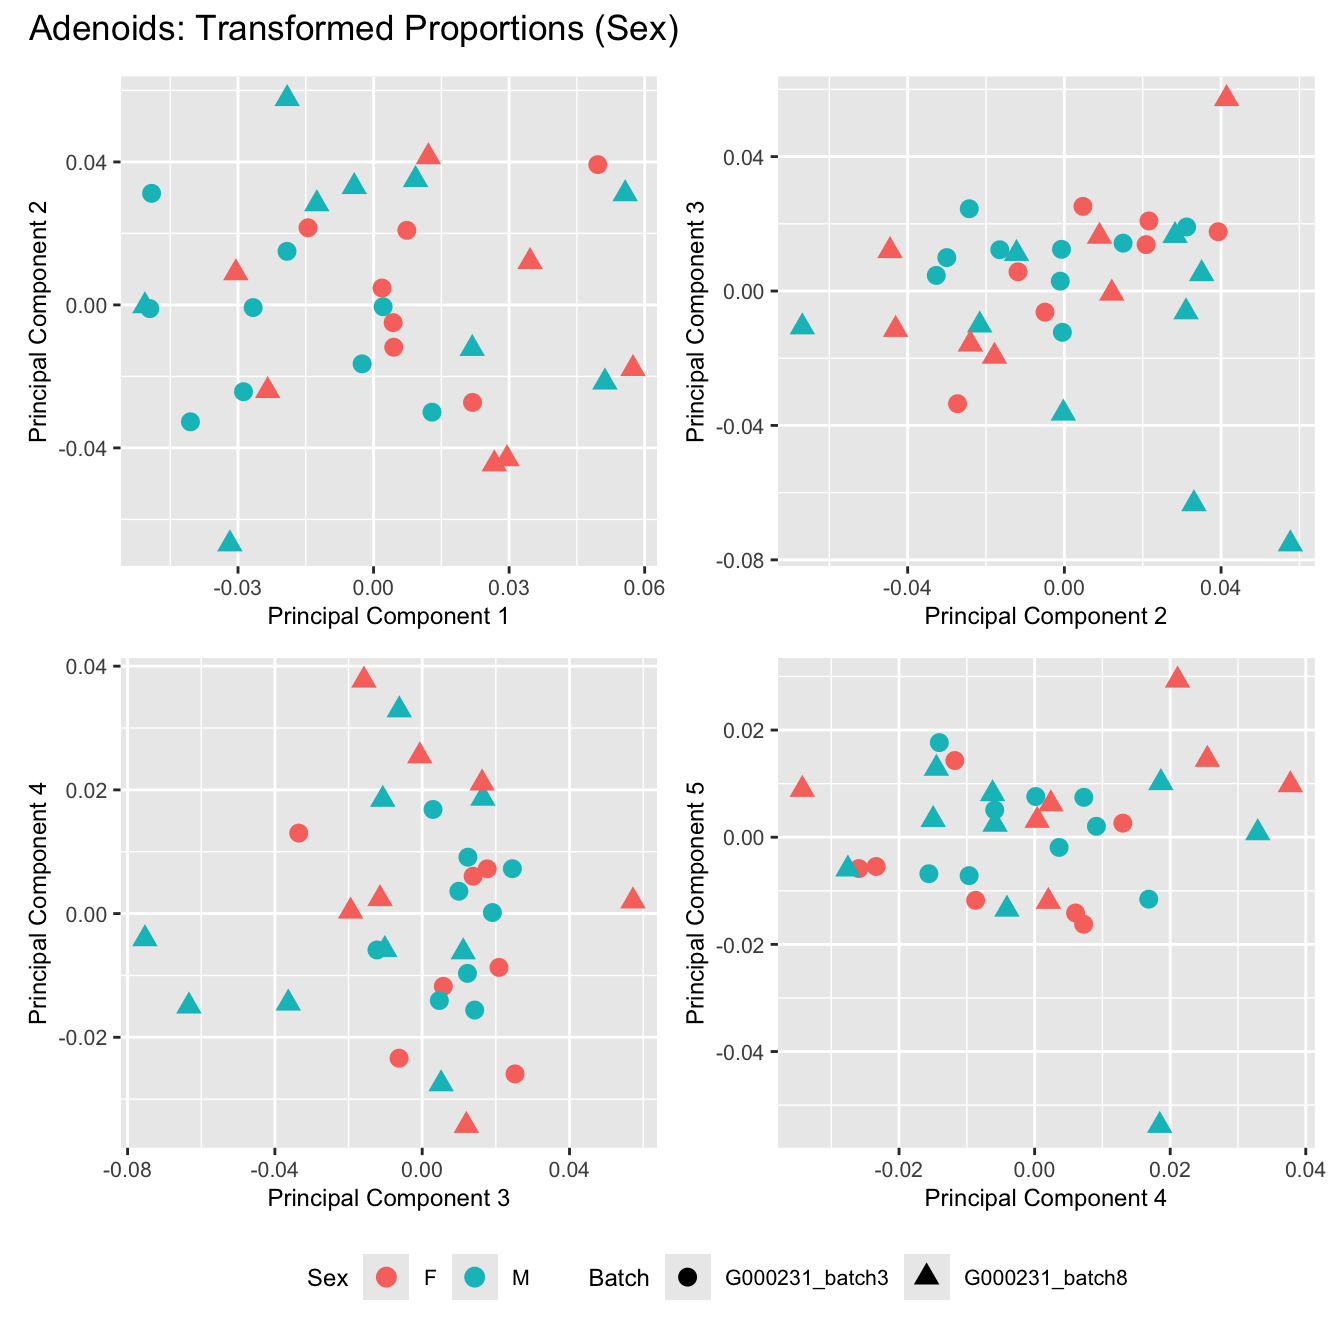
title_suffix <- if (data_type == "Counts") "Cell-type Counts (Sex)" else "Transformed Proportions (Sex)"
plot_list[[data_type]] <- wrap_plots(p, cols = 2) + plot_annotation(title = paste0(tissue_name, ": ", title_suffix)) +
plot_layout(guides = "collect") &
theme(legend.position = "bottom")
}
cat(paste('### ', tissue_name, '\n', sep = ""))
print(plot_list$Counts)
print(plot_list$TransformedProps)
cat("\n\n")
}Adenoids
BAL
Bronchial_brushings
Nasal_brushings
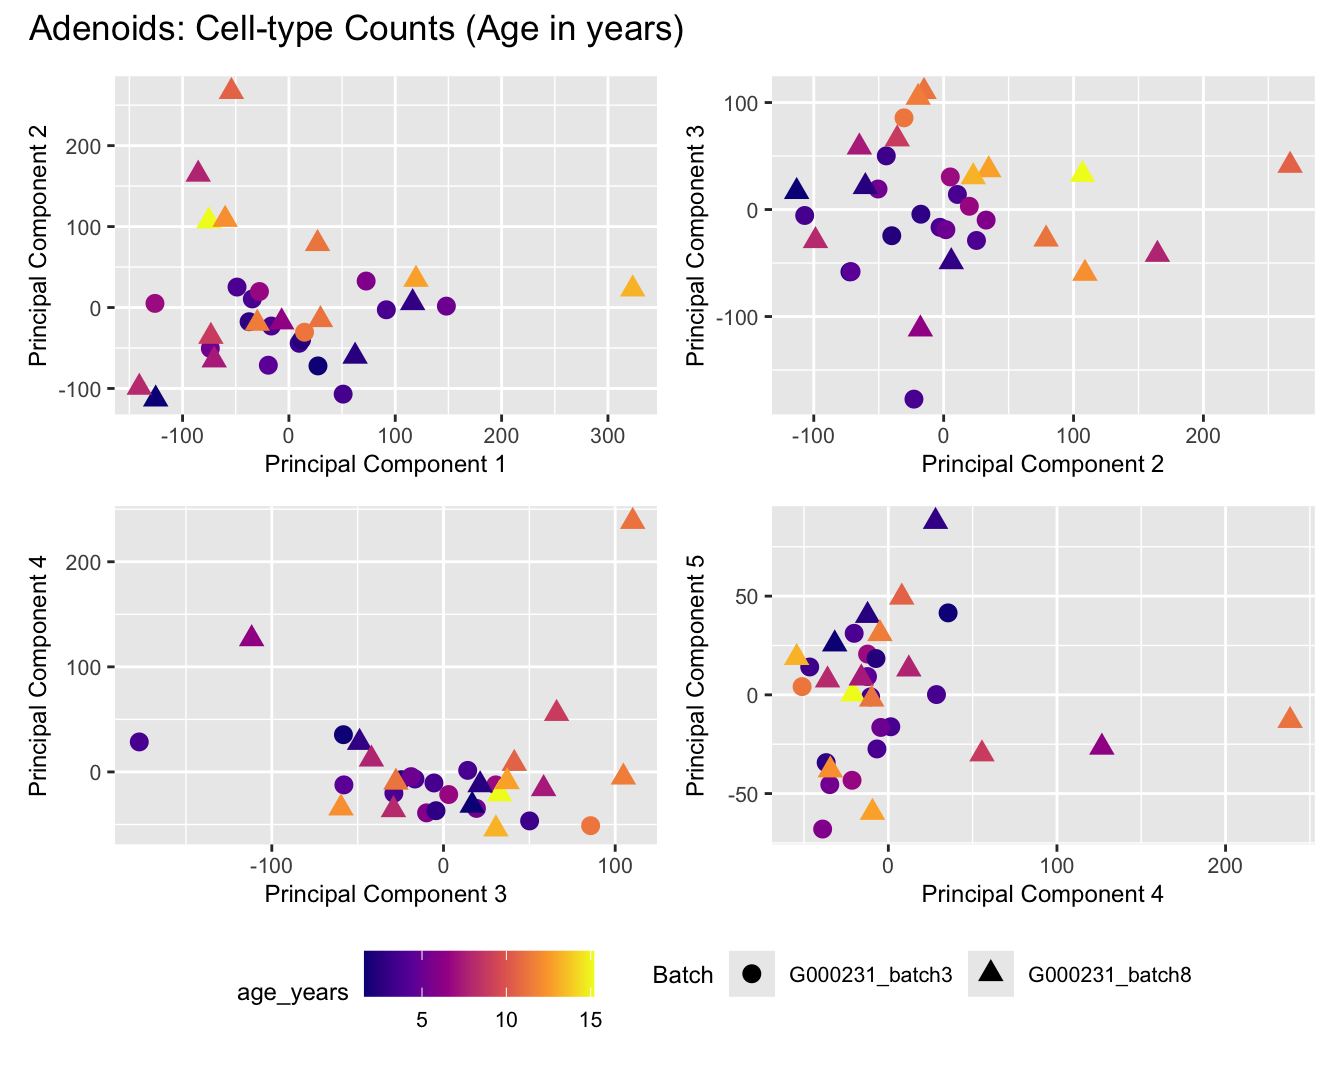
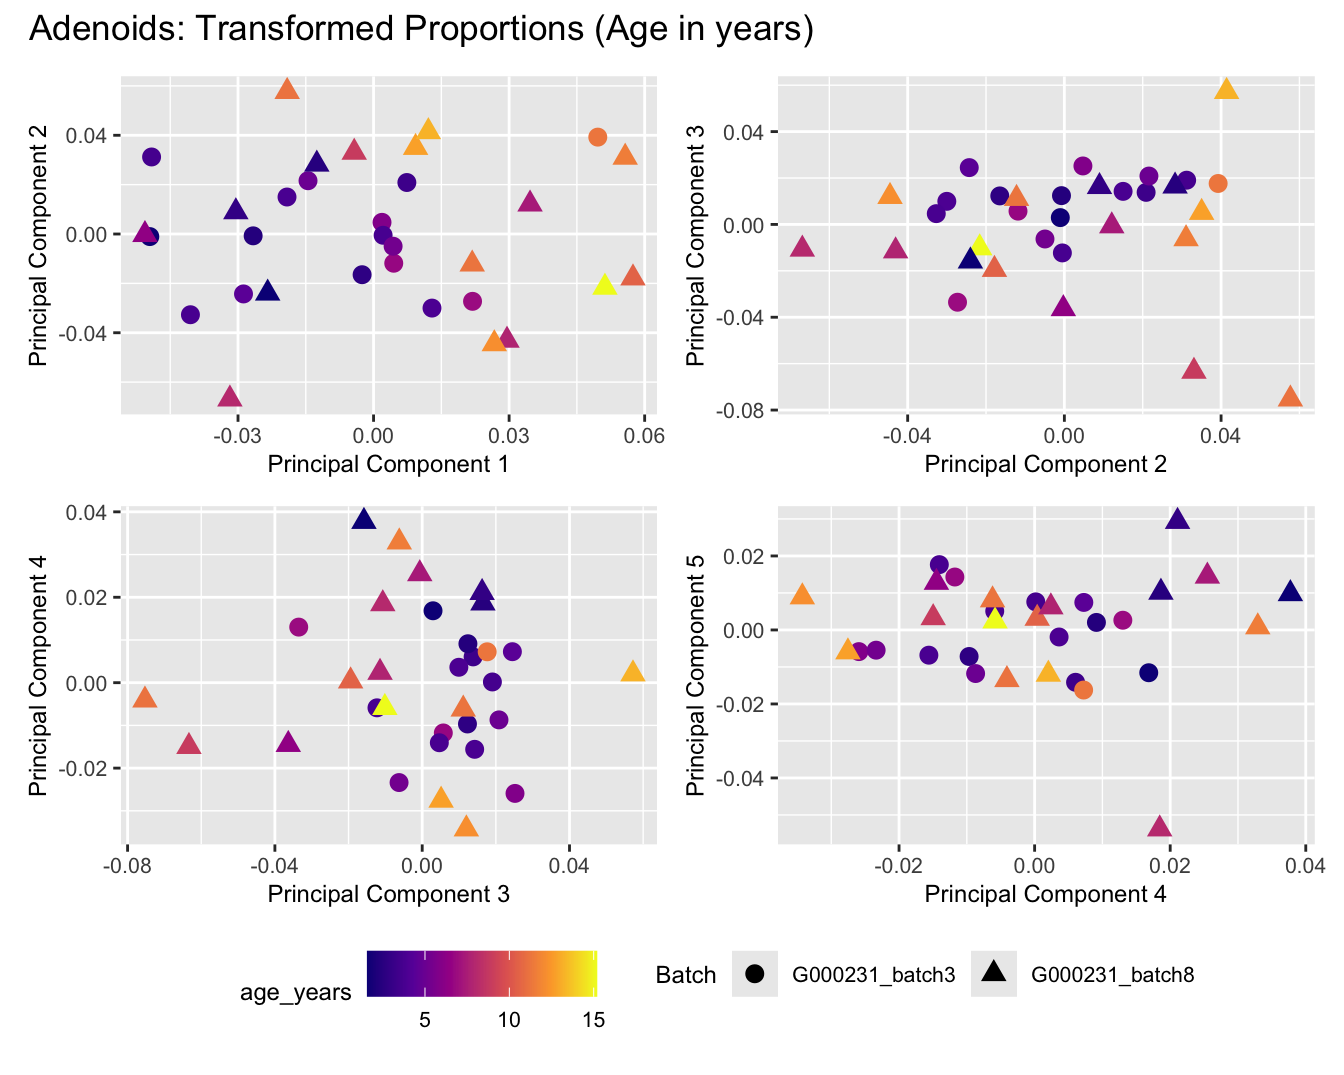
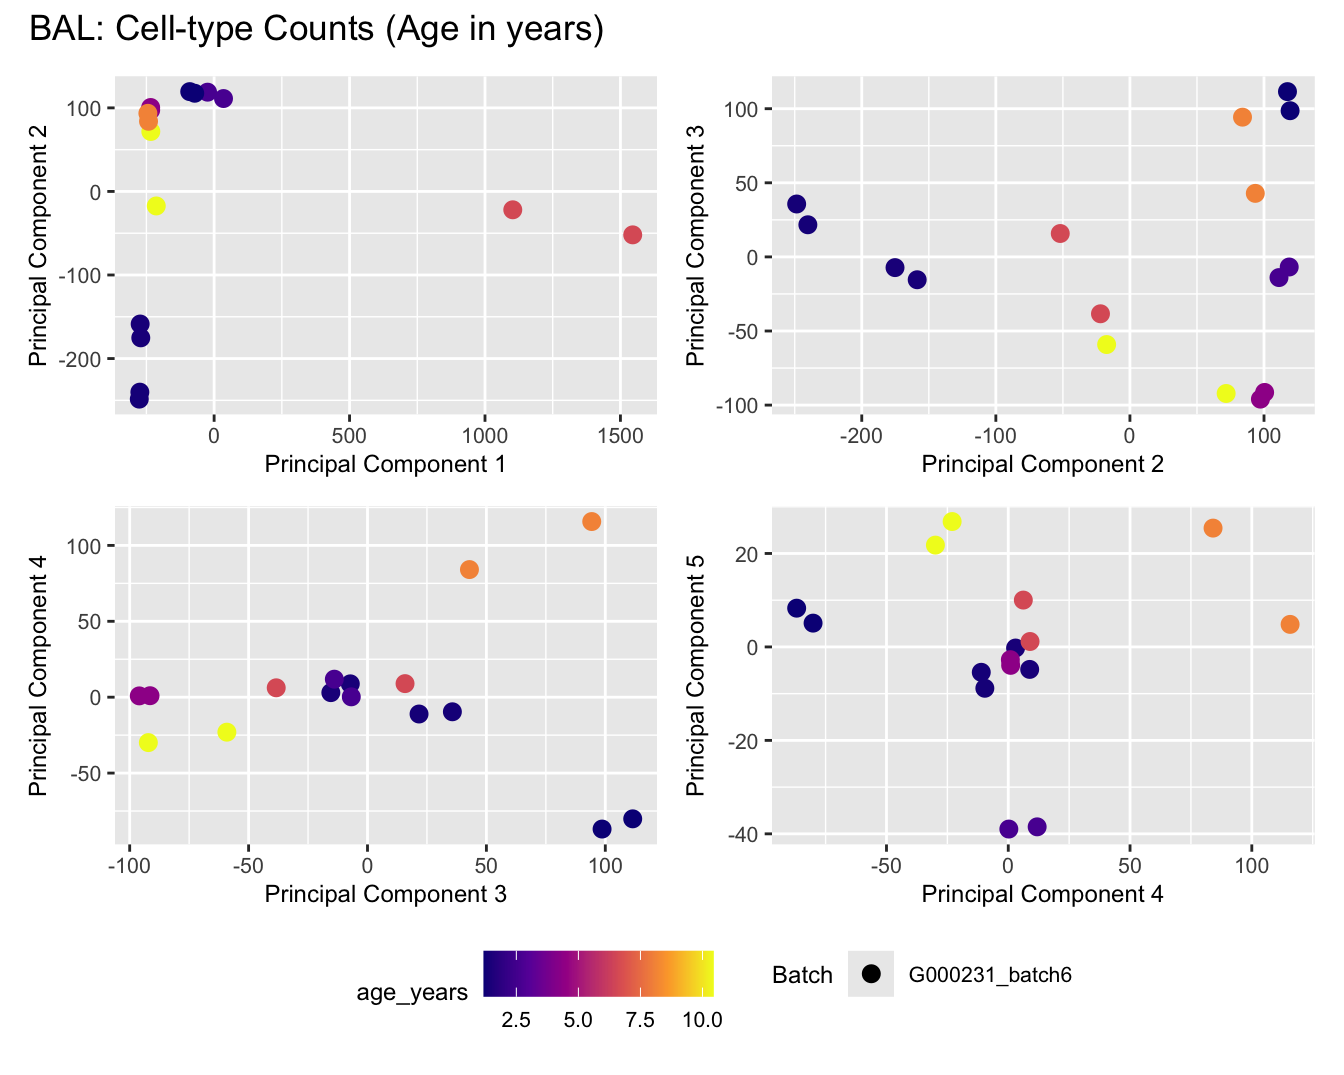
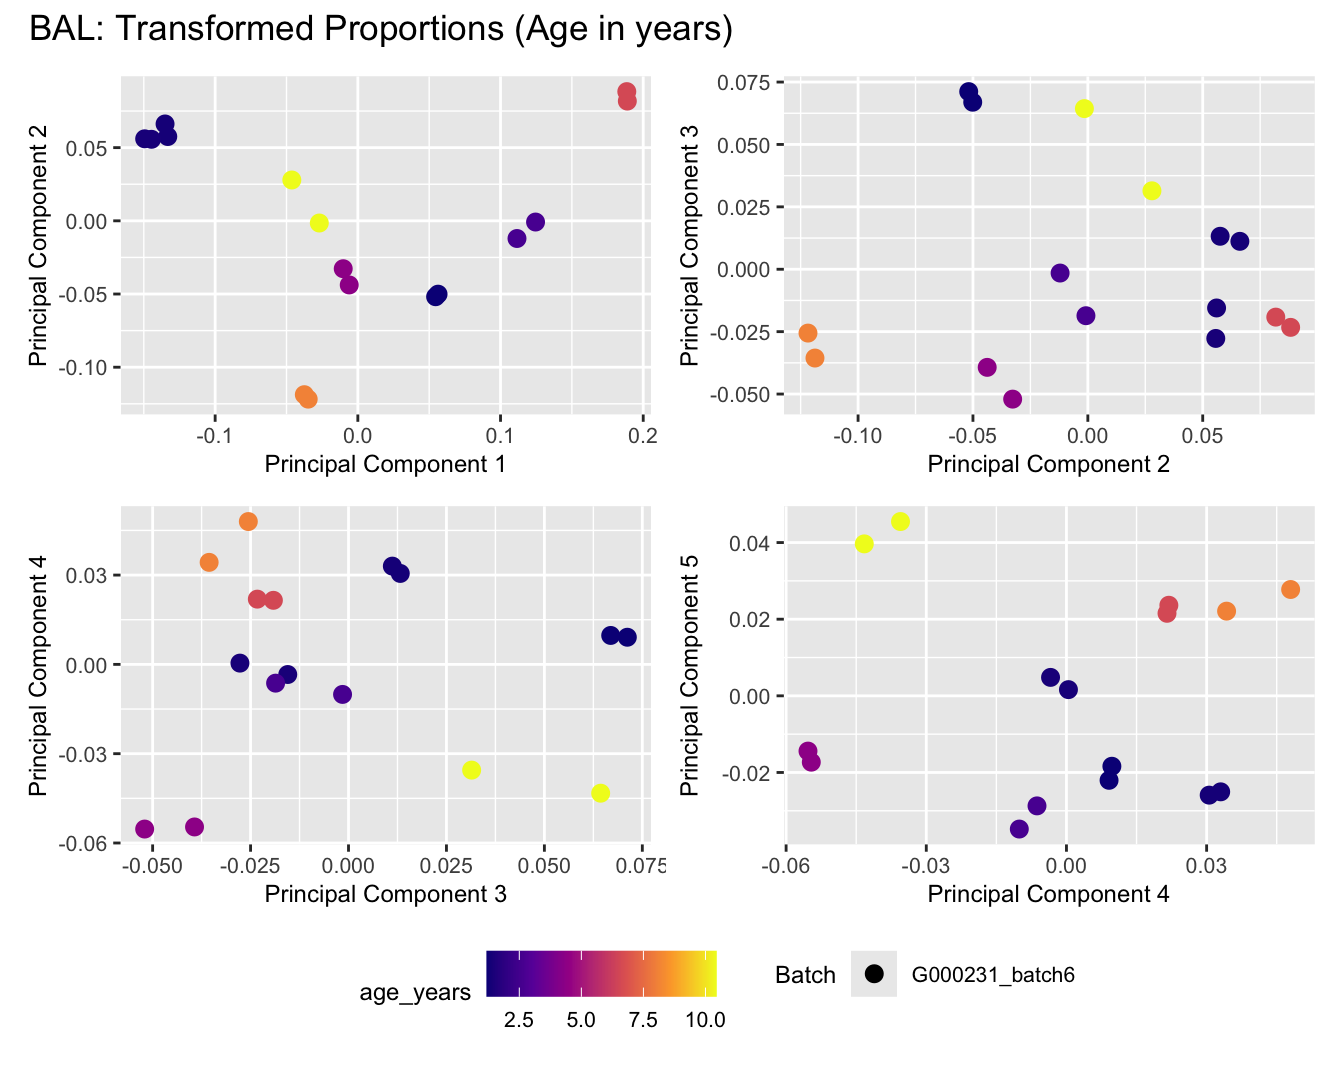
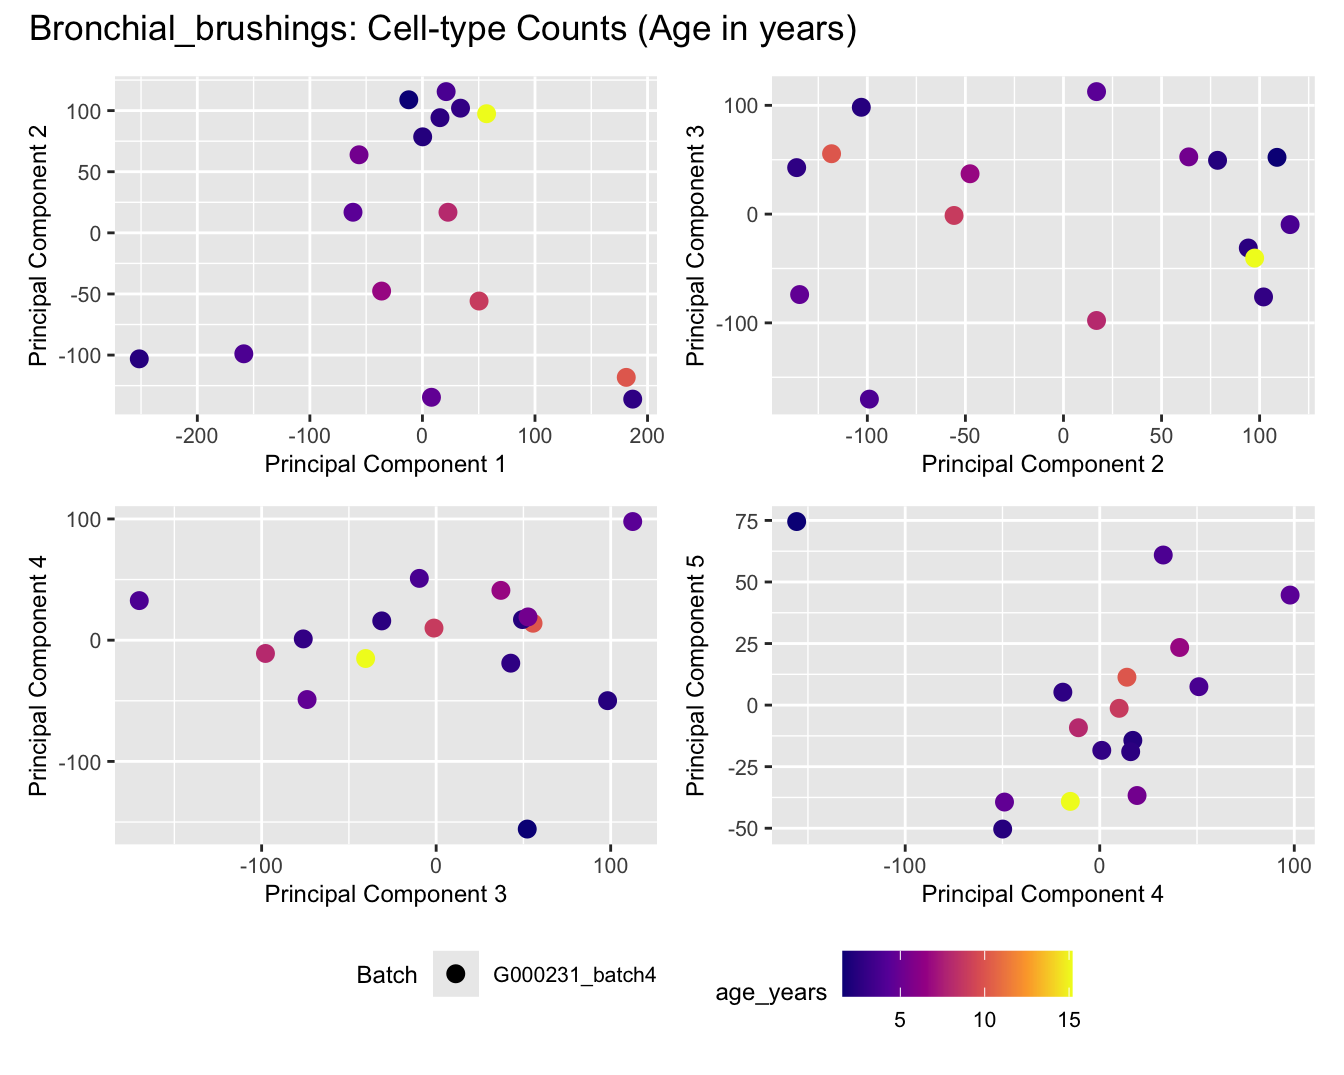
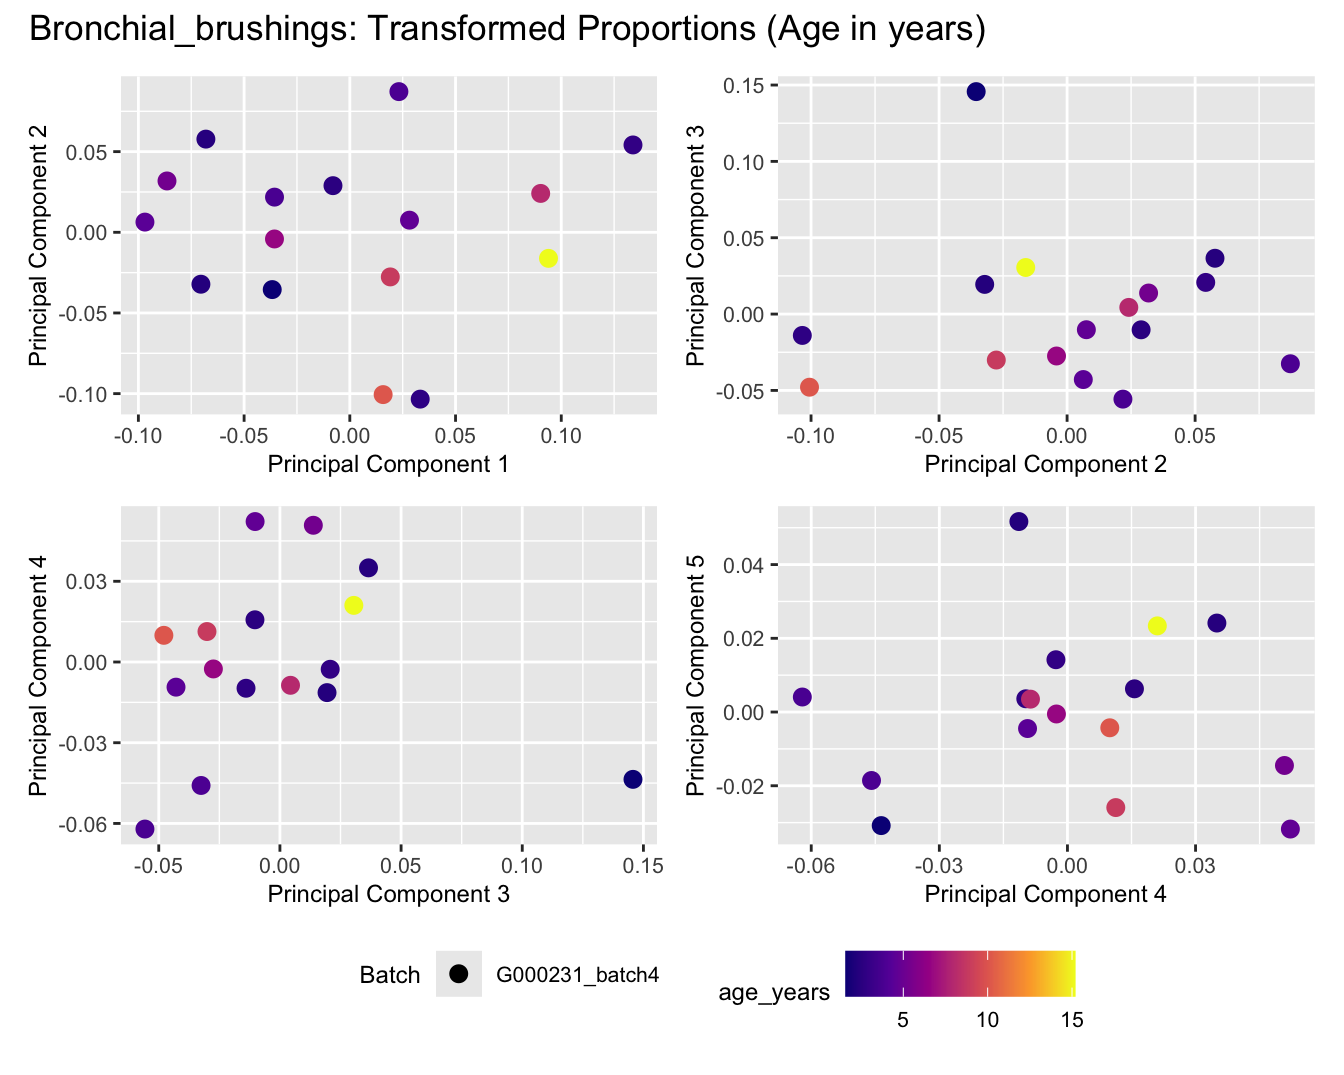
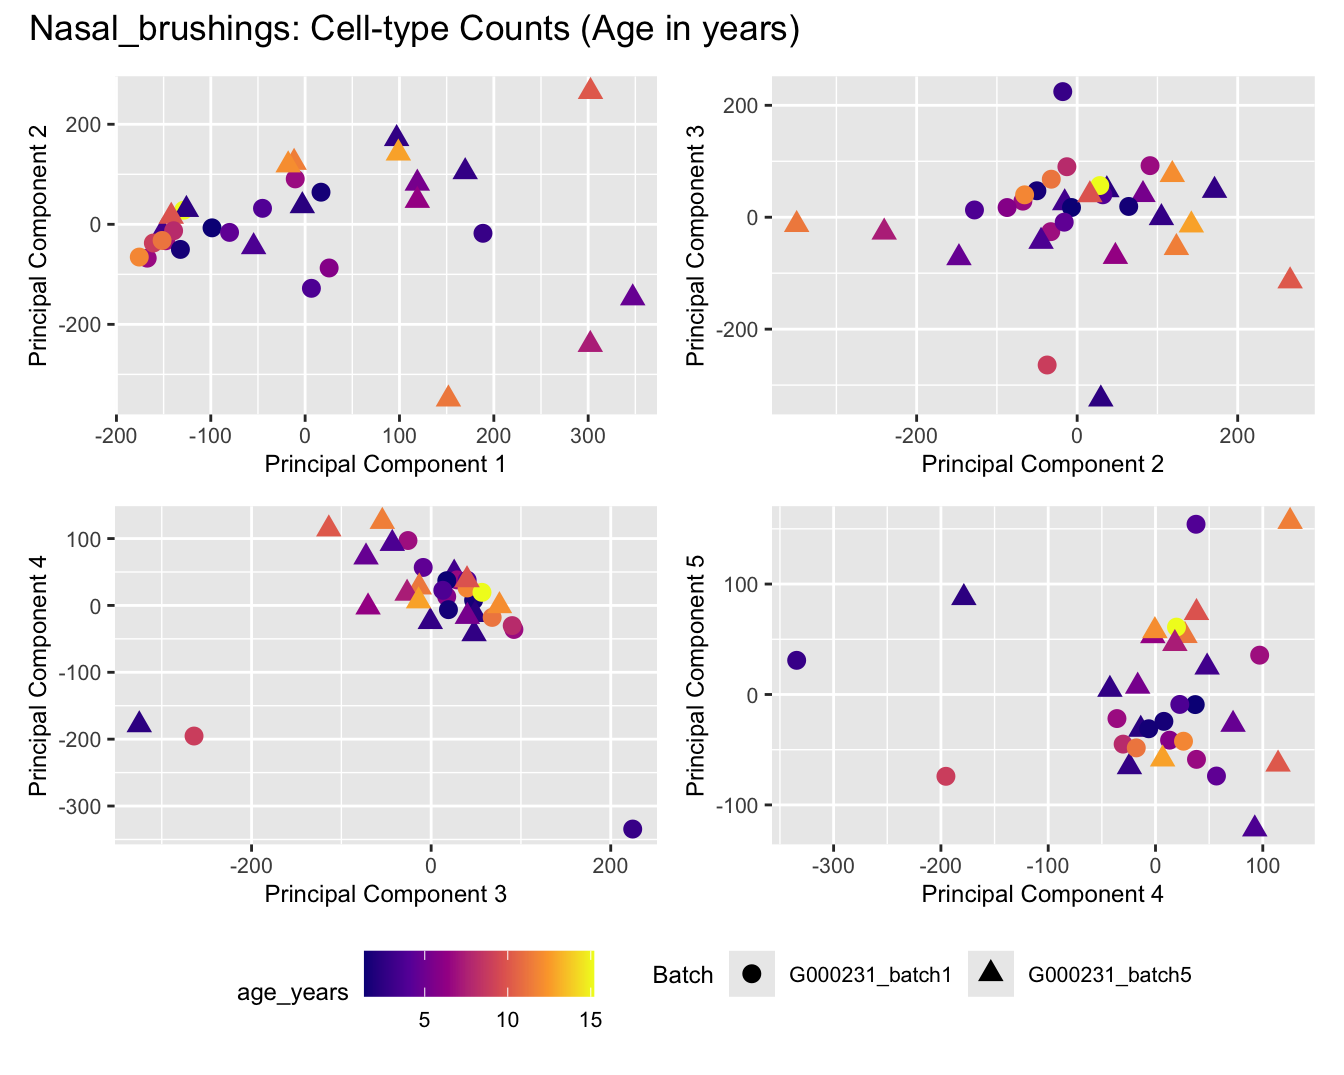
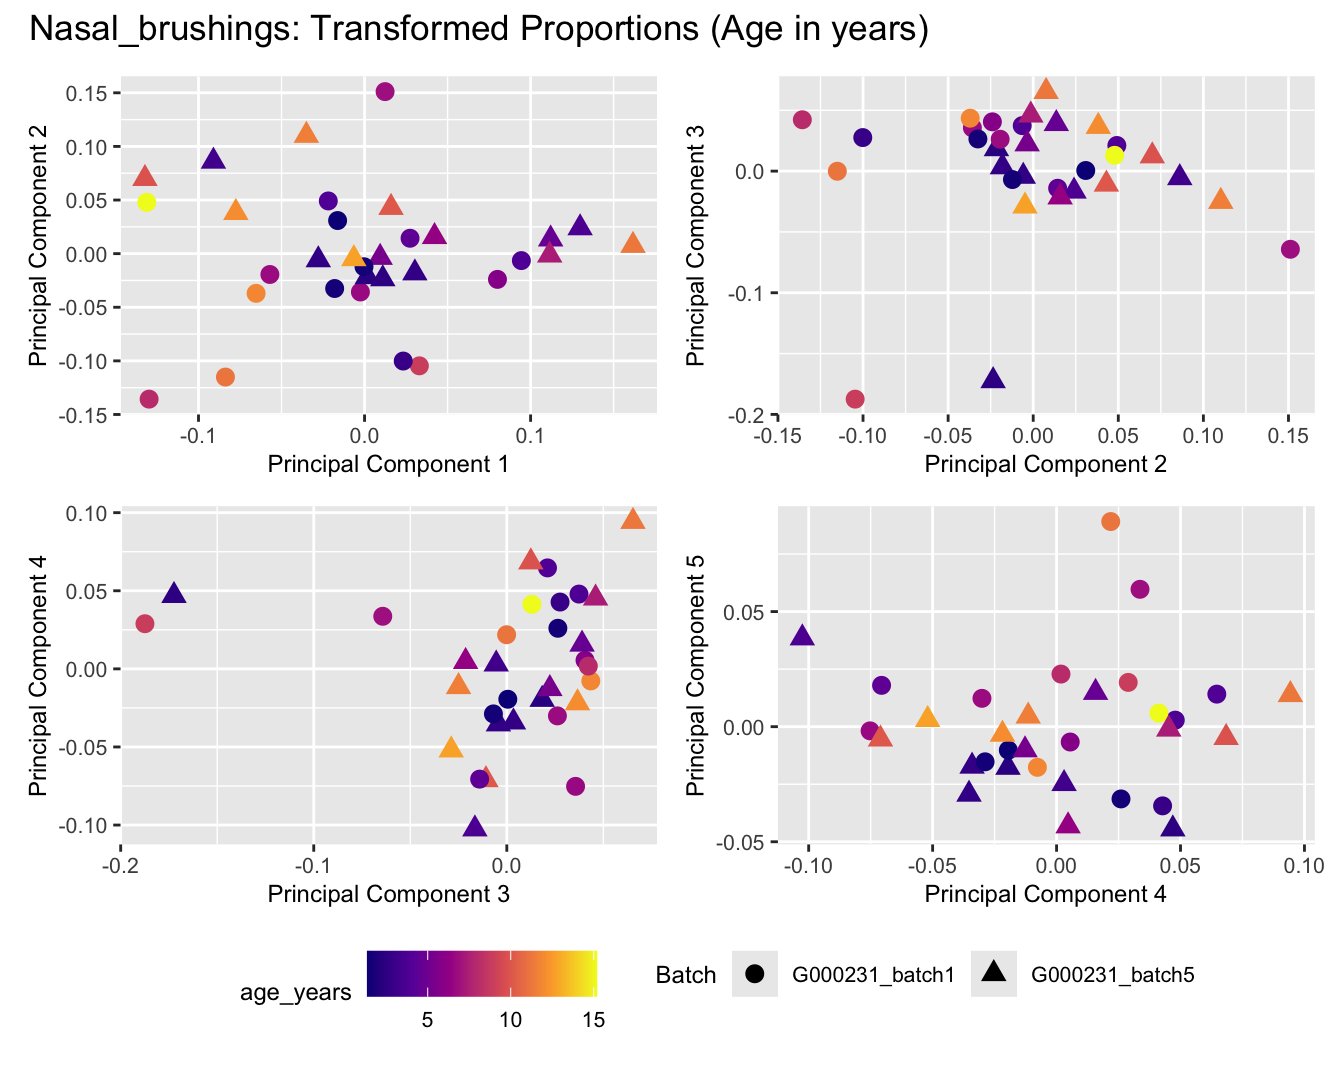
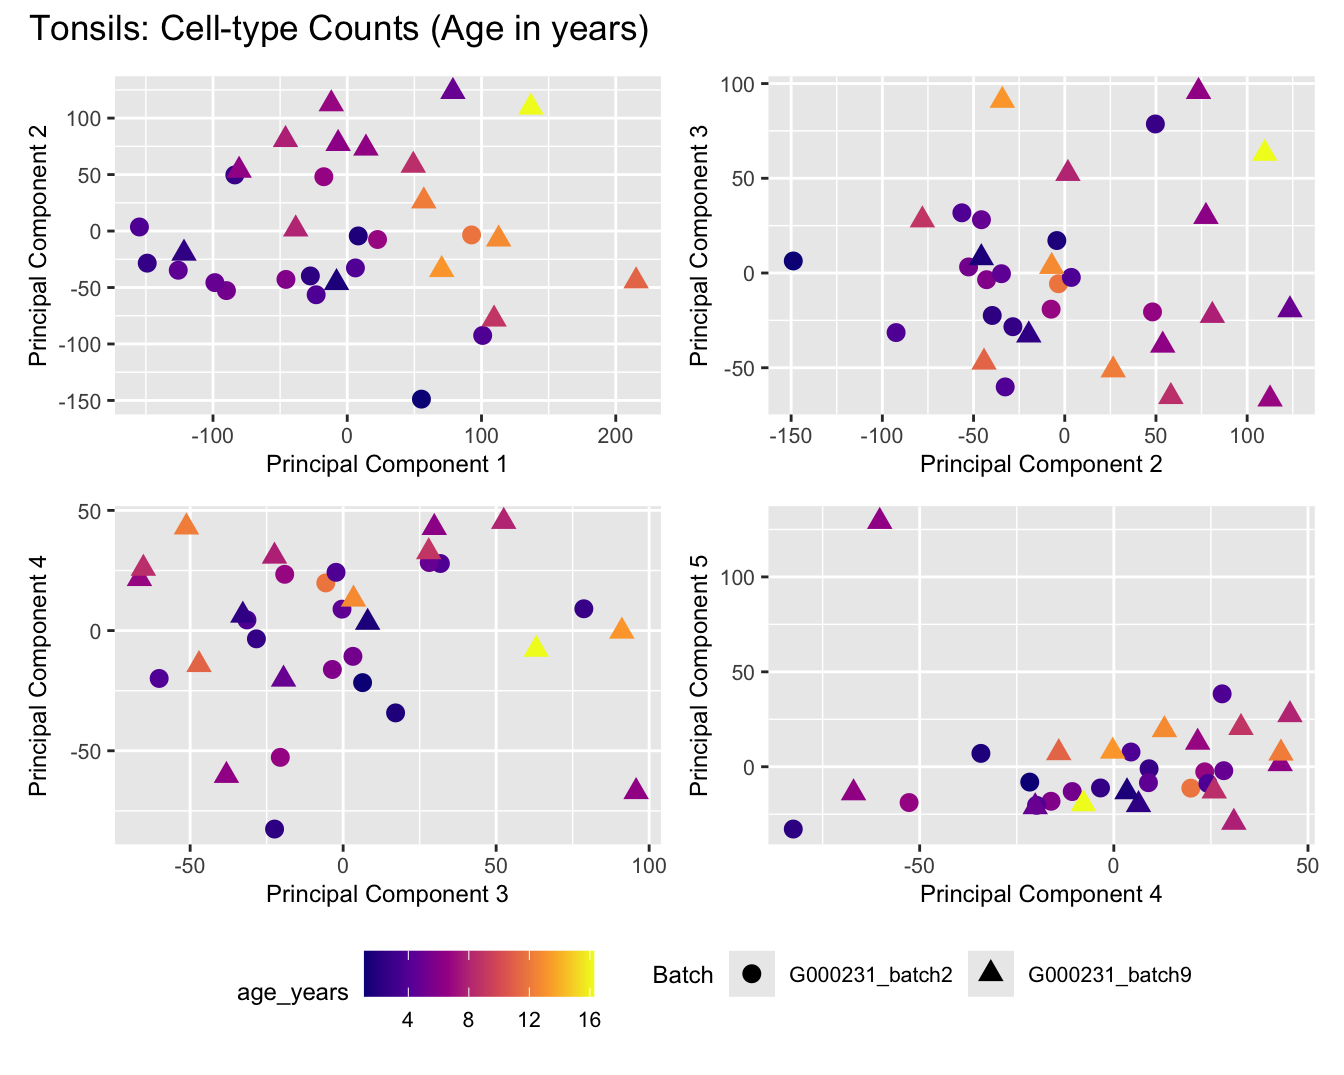
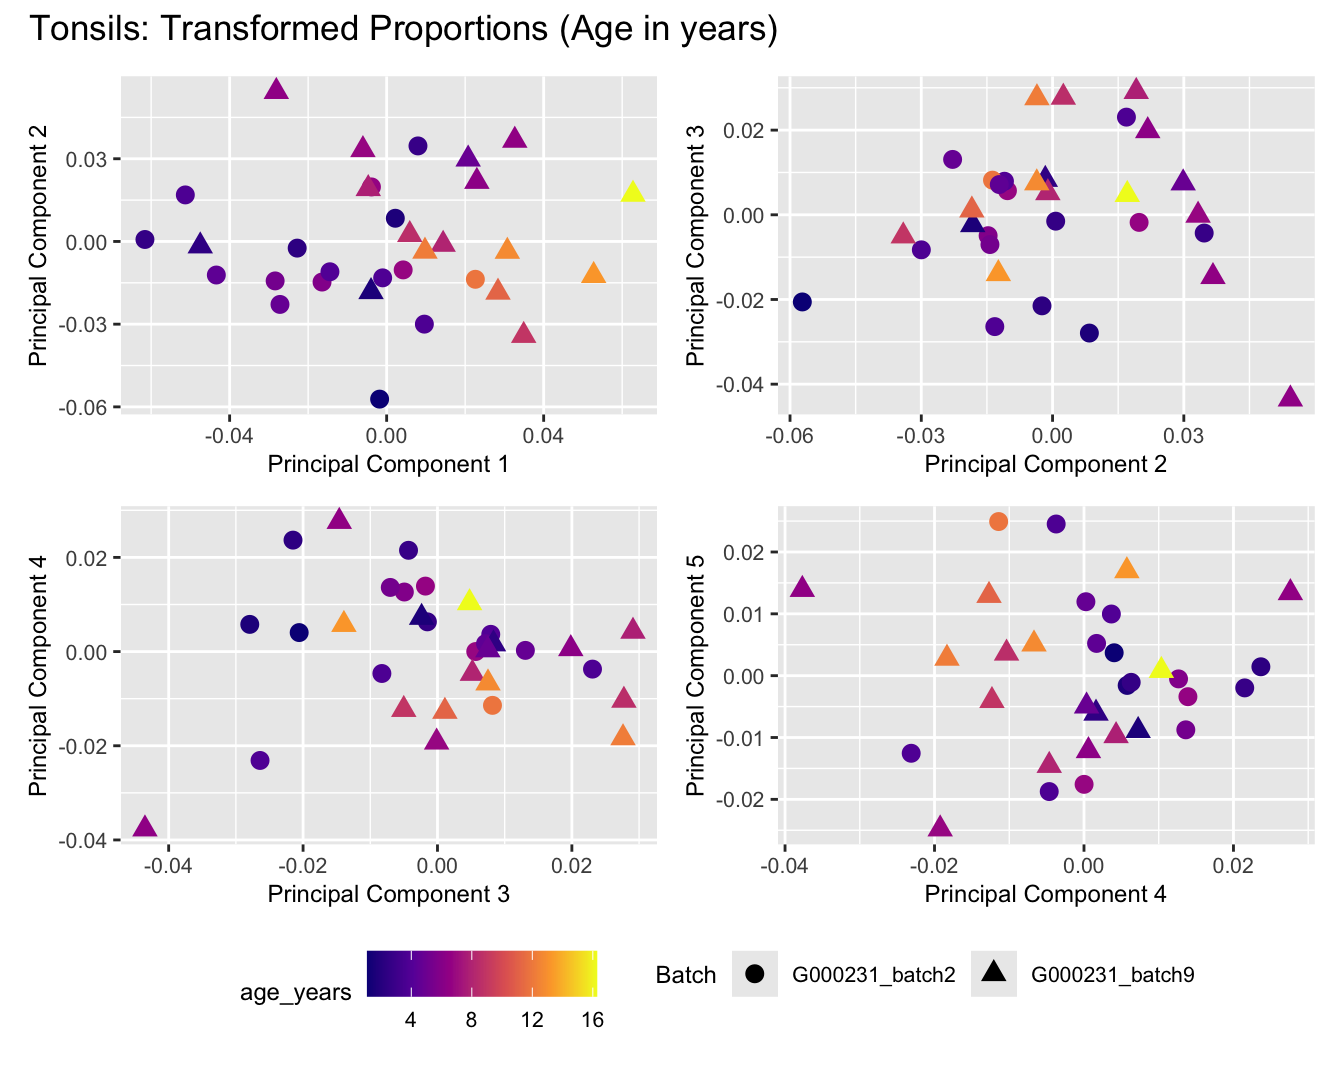
Sources of variations- Age in years
dims <- list(c(1,2), c(2:3), c(3,4), c(4,5))

for (tissue_name in names(seurat_objects)) {
  tissue_obj <- seurat_objects[[tissue_name]]
  props <- getTransformedProps(clusters = tissue_obj$cell_labels,
                               sample = tissue_obj$Sample, transform = "asin")

  plot_list <- list()

  for (data_type in c("Counts", "TransformedProps")) {
    p <- vector("list", length(dims))

    for(i in 1:length(dims)) {
      mds_data <- if (data_type == "Counts") props$Counts else props$TransformedProps
      mds <- plotMDS(mds_data,
                     gene.selection = "common",
                     plot = FALSE, dim.plot = dims[[i]])

      data.frame(x = mds$x,
                 y = mds$y,
                 sample = rownames(mds$distance.matrix.squared)) %>%
        left_join(tissue_obj@meta.data %>%
                   dplyr::select(Sample,
                                 batch_name,
                                 age_years,
                                 sex),
                 by = c("sample" = "Sample")) %>%
        distinct() -> dat

    p[[i]] <- ggplot(dat, aes(x = x, y = y,
                            shape = as.factor(batch_name),
                            color = age_years))+
    geom_point(size = 3) +
    labs(x = glue("Principal Component {dims[[i]][1]}"),
         y = glue("Principal Component {dims[[i]][2]}"),
         colour = "age_years",
         shape = "Batch") +
    theme(legend.direction = "horizontal",
          legend.text = element_text(size = 8),
          legend.title = element_text(size = 9),
          axis.text = element_text(size = 8),
          axis.title = element_text(size = 9))+
    scale_colour_viridis_c(option = "plasma")
    }

    title_suffix <- if (data_type == "Counts") "Cell-type Counts (Age in years)" else "Transformed Proportions (Age in years)"
    plot_list[[data_type]] <- wrap_plots(p, cols = 2) + plot_annotation(title = paste0(tissue_name, ": ", title_suffix)) +
      plot_layout(guides = "collect") &
      theme(legend.position = "bottom")
  }

  cat(paste('### ', tissue_name, '\n', sep = ""))
  print(plot_list$Counts)
  print(plot_list$TransformedProps)
  cat("\n\n")
}
Adenoids
| Version | Author | Date |
|---|---|---|
| 0a358ce | Gunjan Dixit | 2024-05-24 |
| Version | Author | Date |
|---|---|---|
| 0a358ce | Gunjan Dixit | 2024-05-24 |
BAL
| Version | Author | Date |
|---|---|---|
| 0a358ce | Gunjan Dixit | 2024-05-24 |
| Version | Author | Date |
|---|---|---|
| 0a358ce | Gunjan Dixit | 2024-05-24 |
Bronchial_brushings
| Version | Author | Date |
|---|---|---|
| 0a358ce | Gunjan Dixit | 2024-05-24 |
| Version | Author | Date |
|---|---|---|
| 0a358ce | Gunjan Dixit | 2024-05-24 |
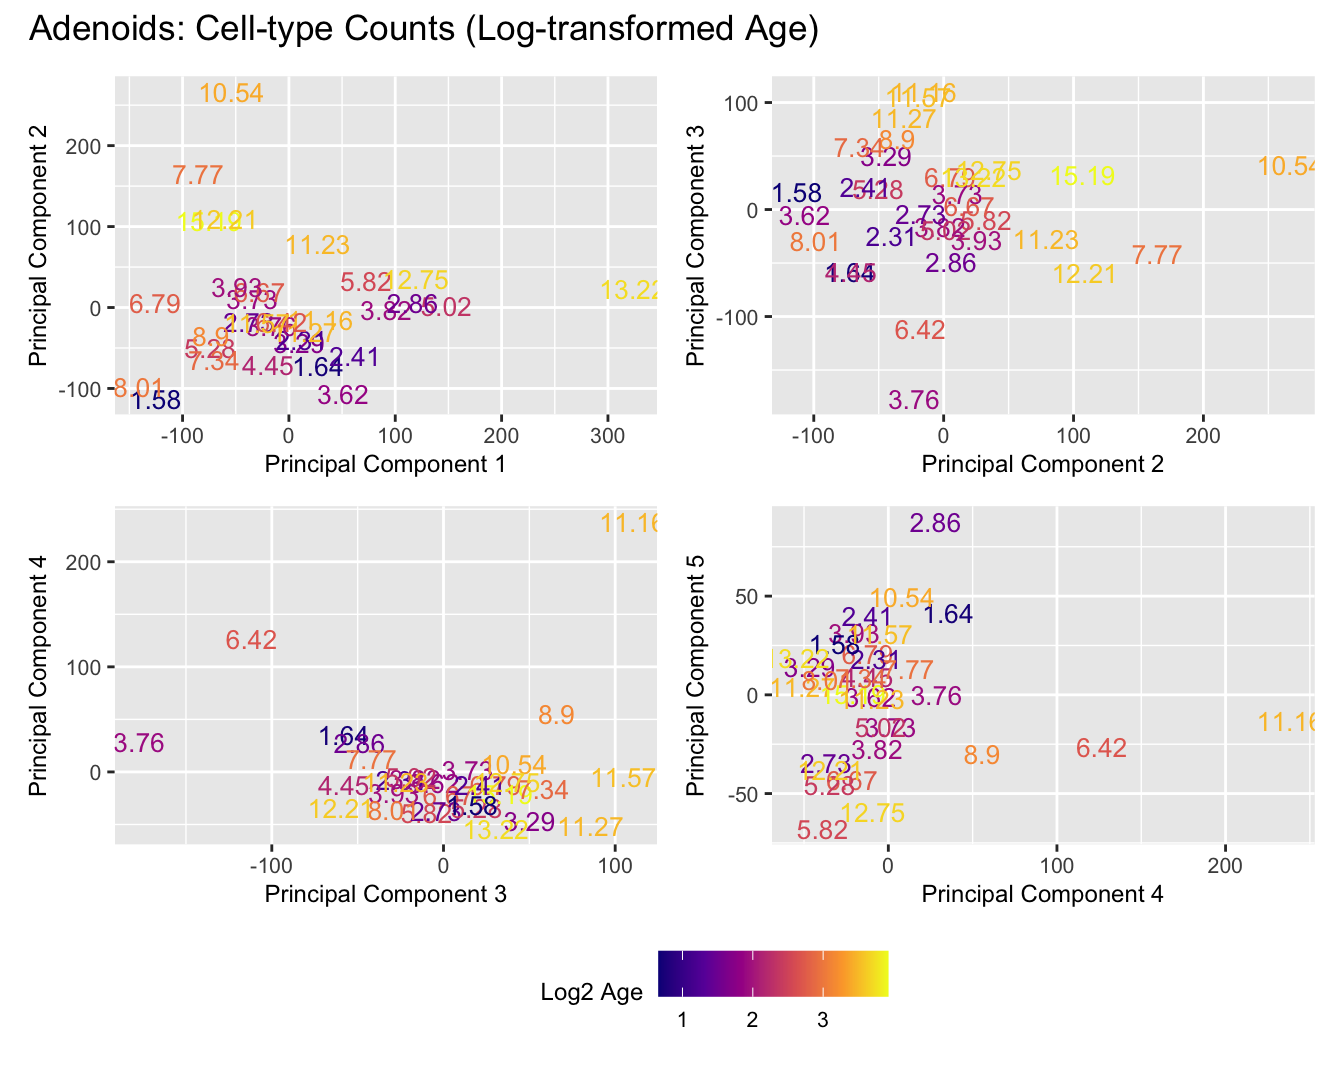
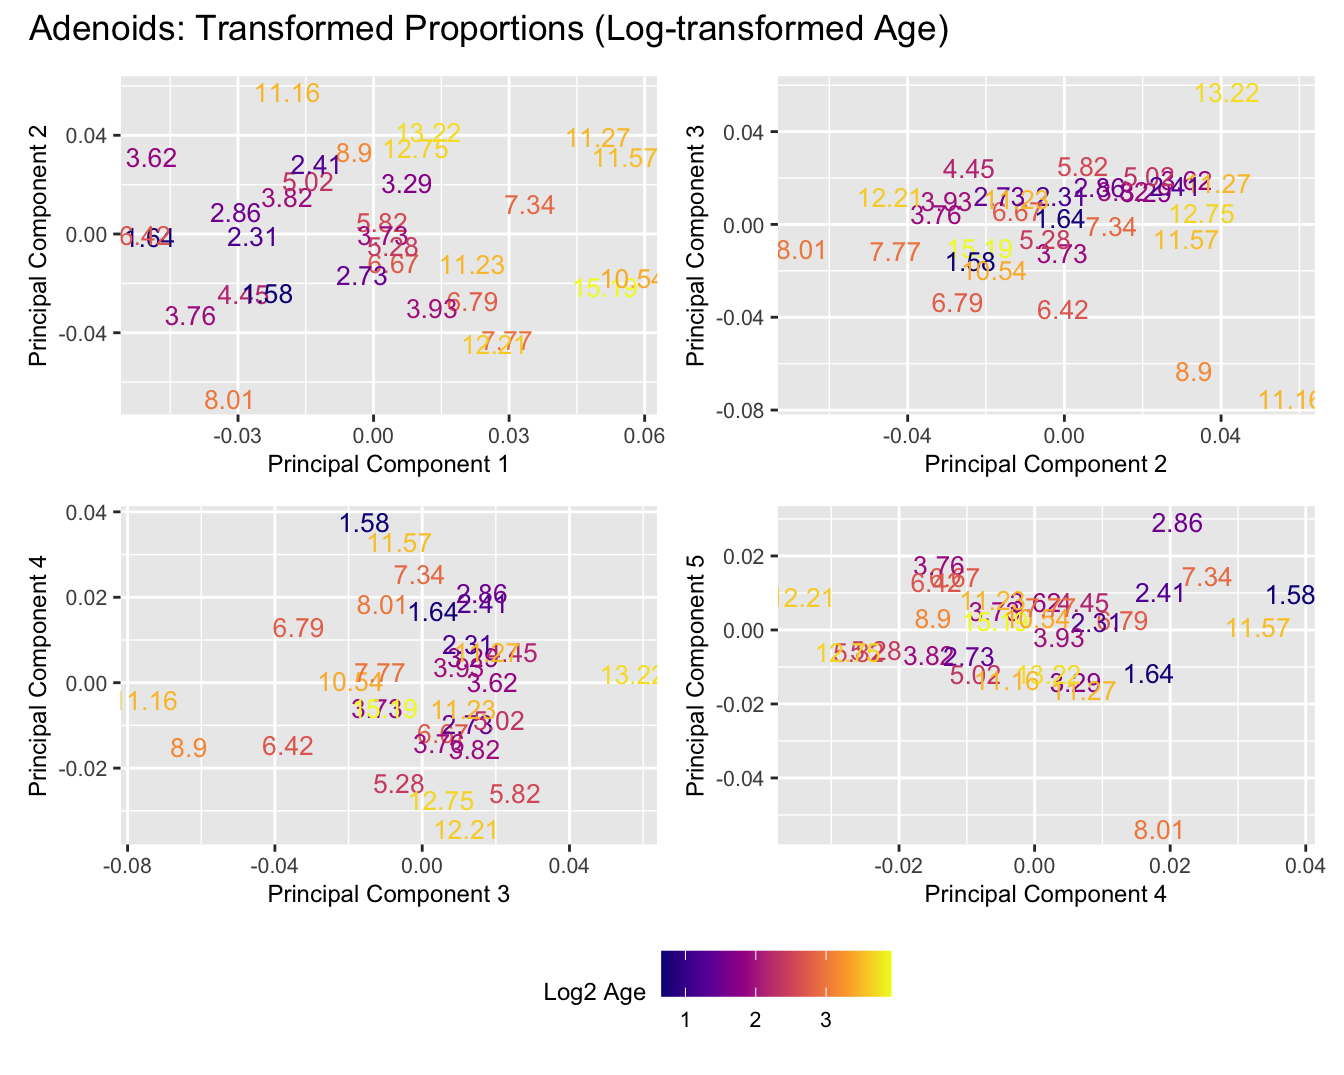
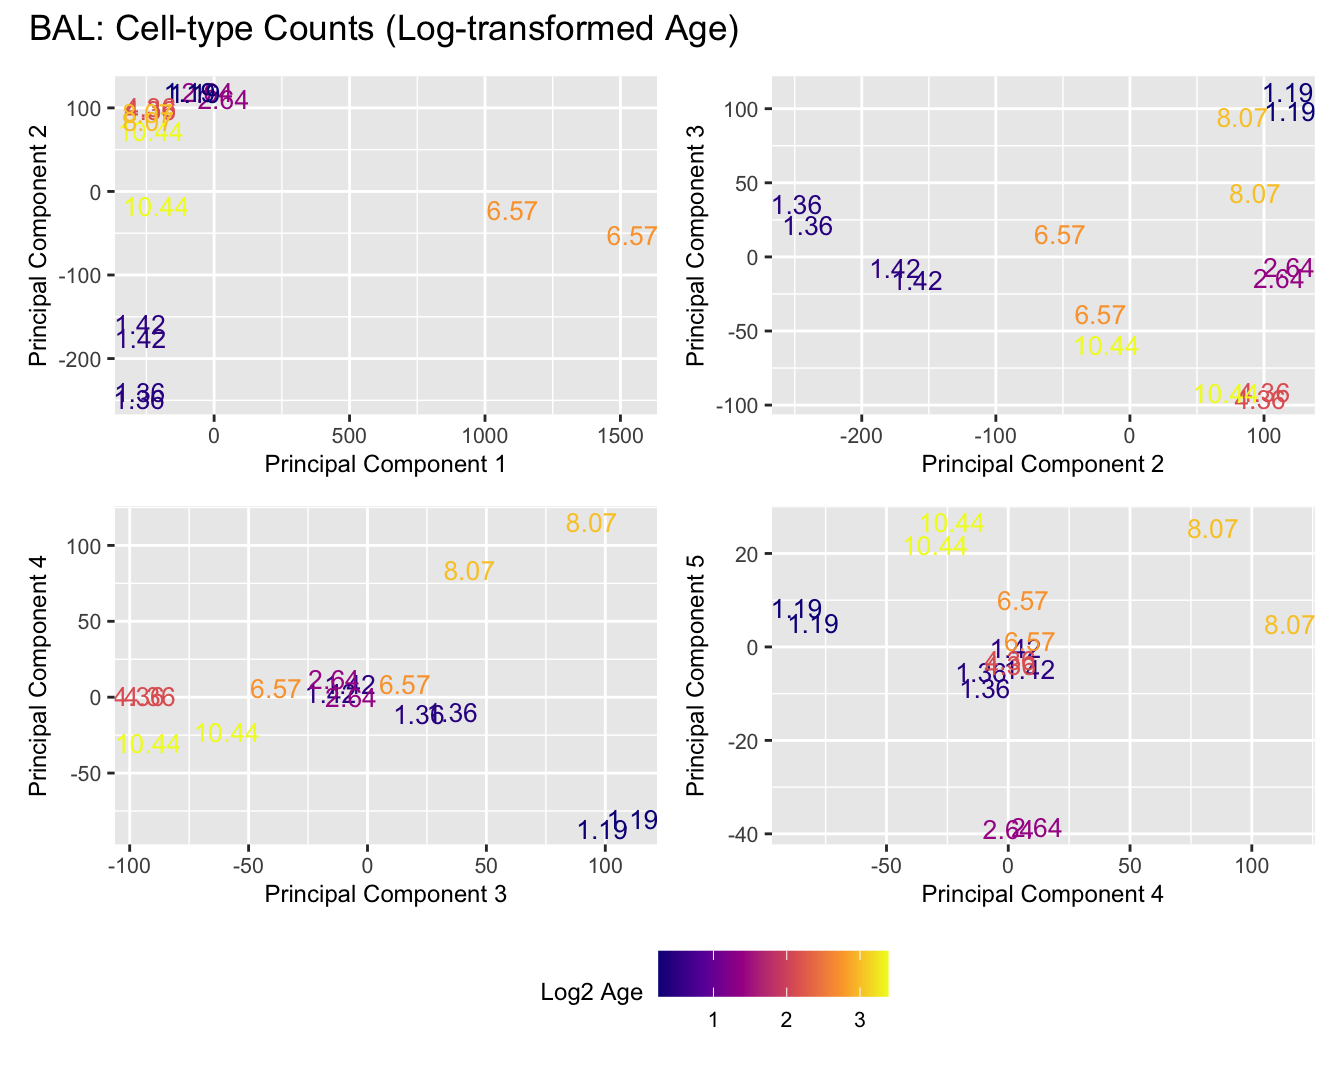
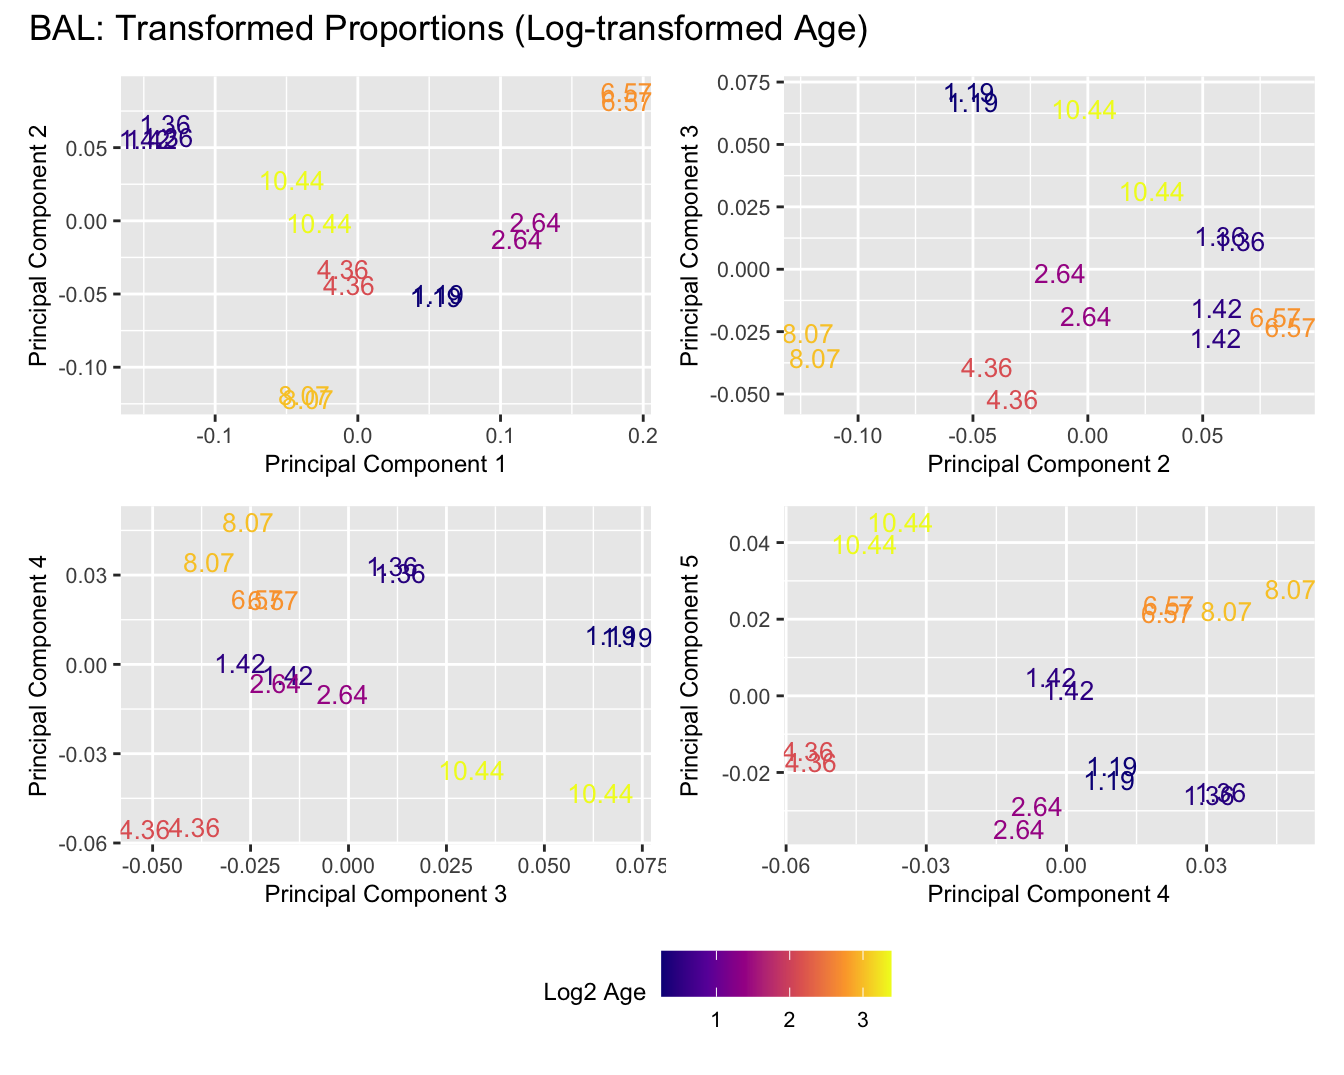
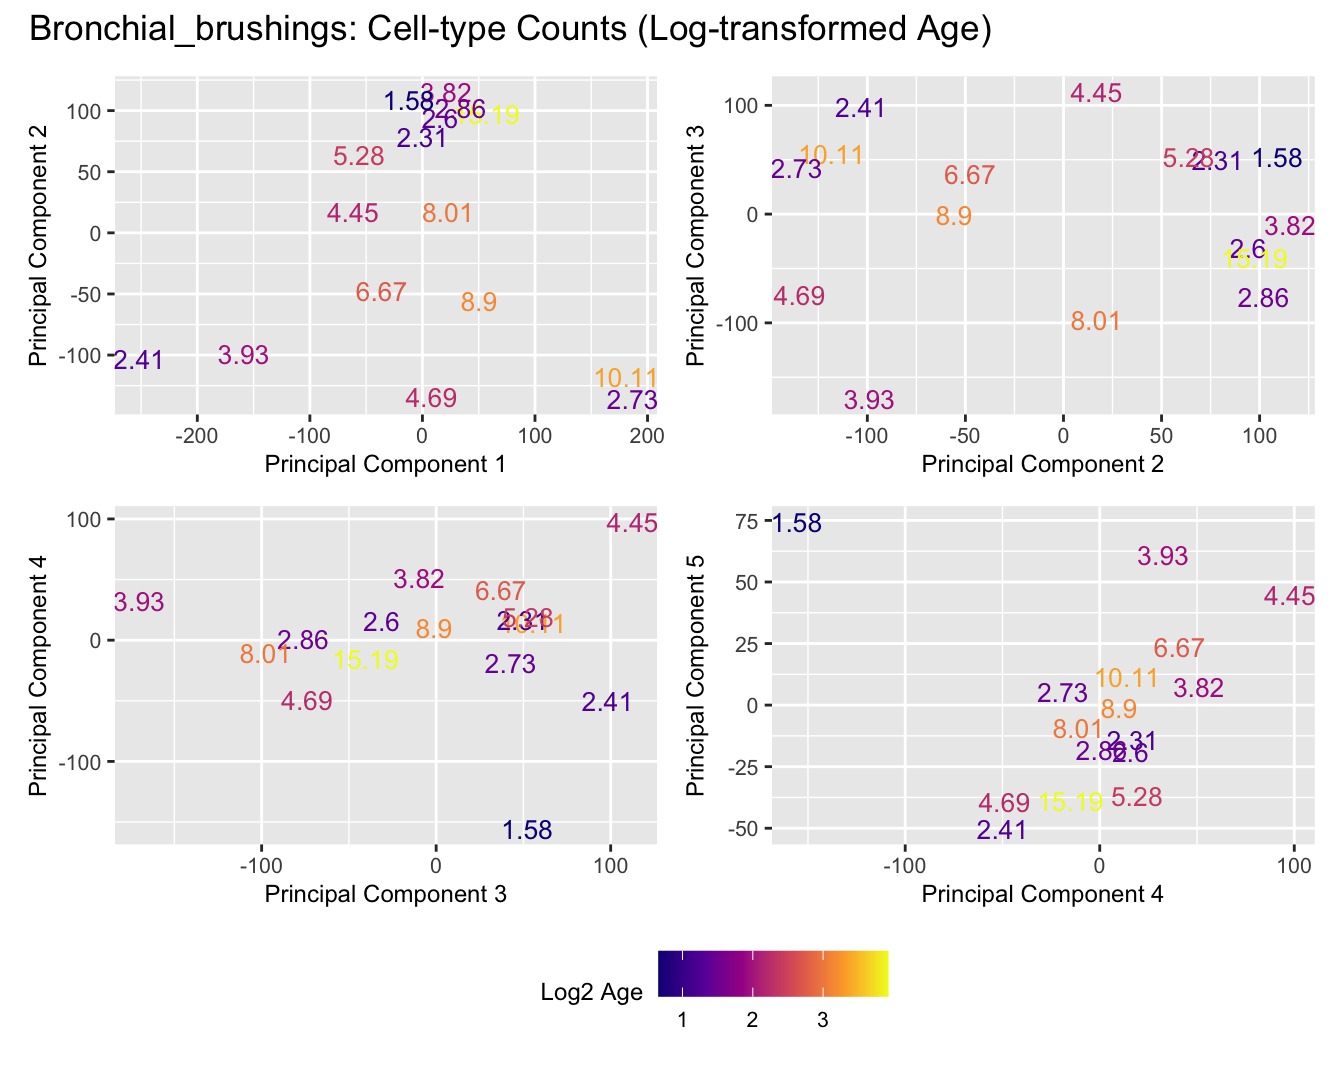
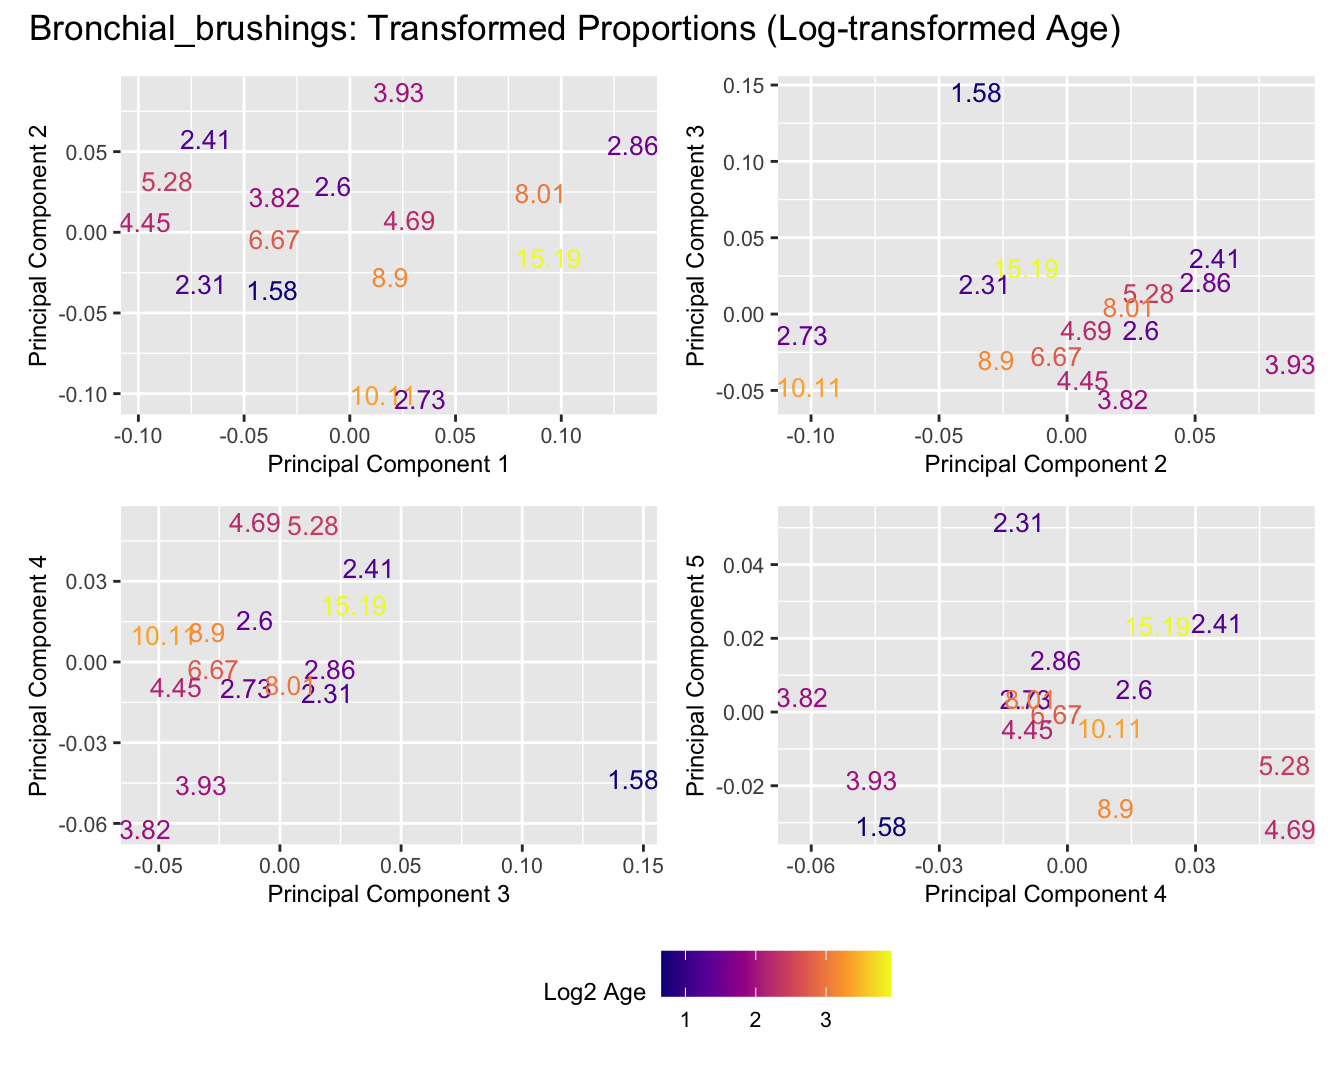
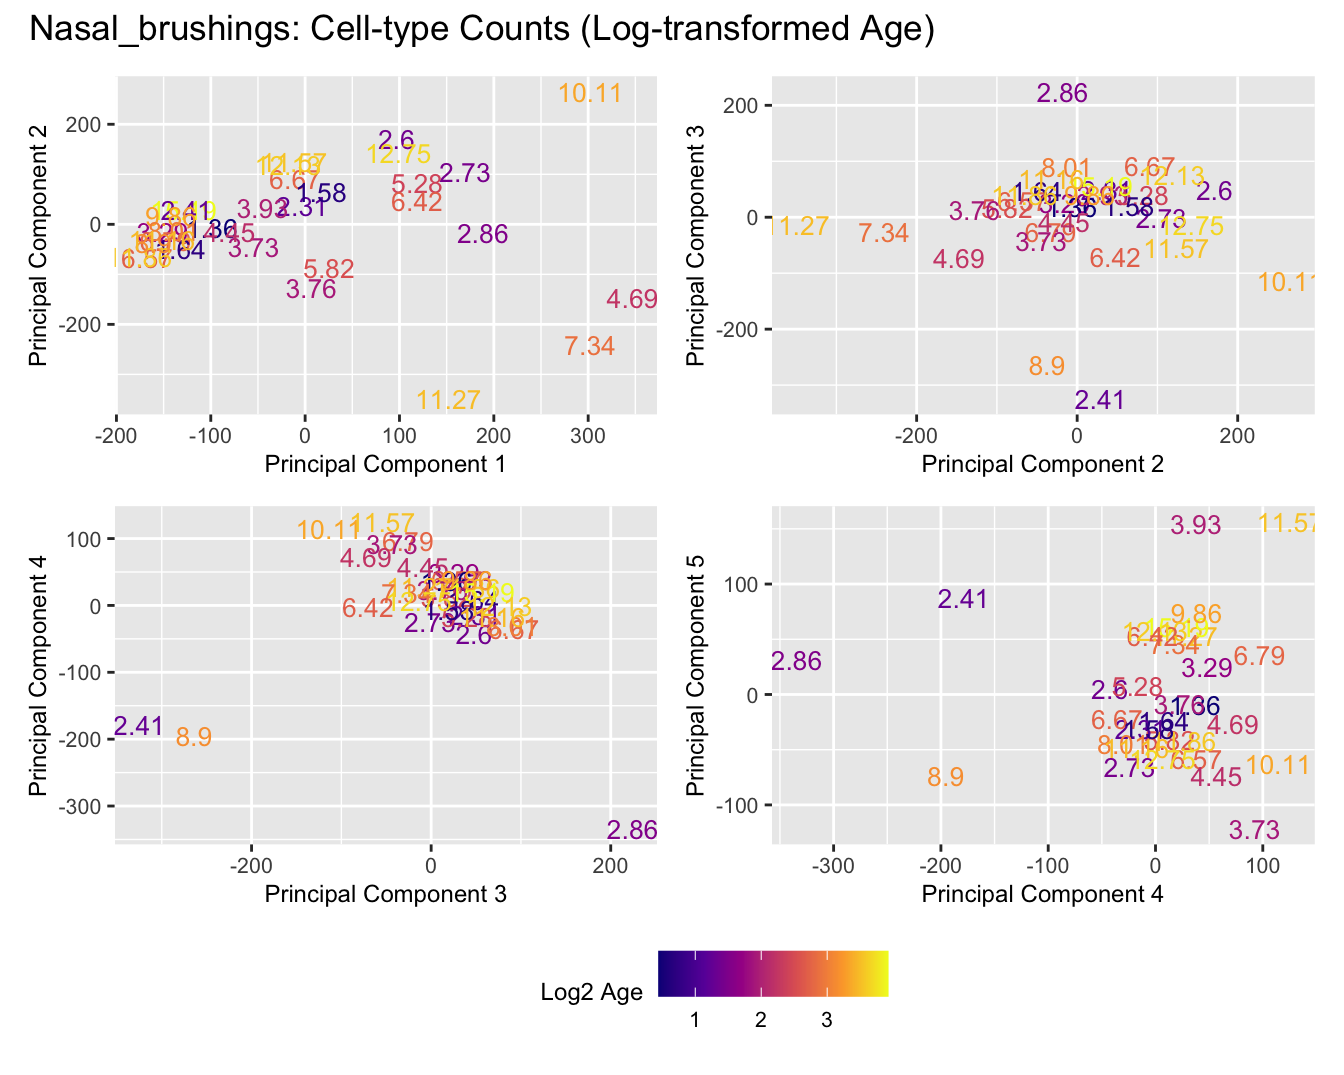
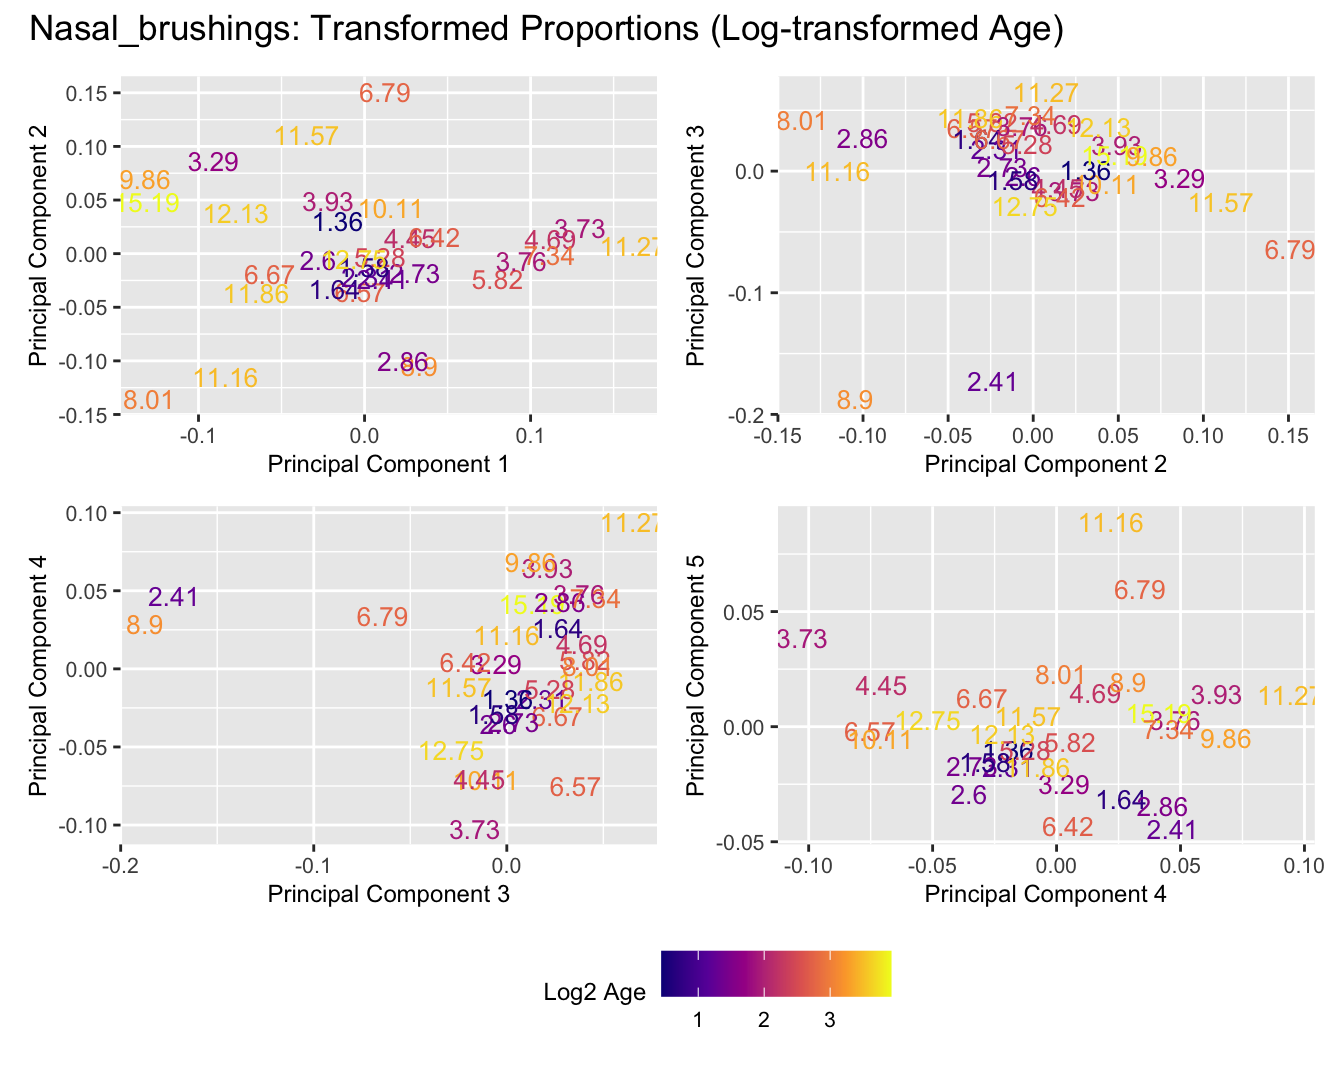
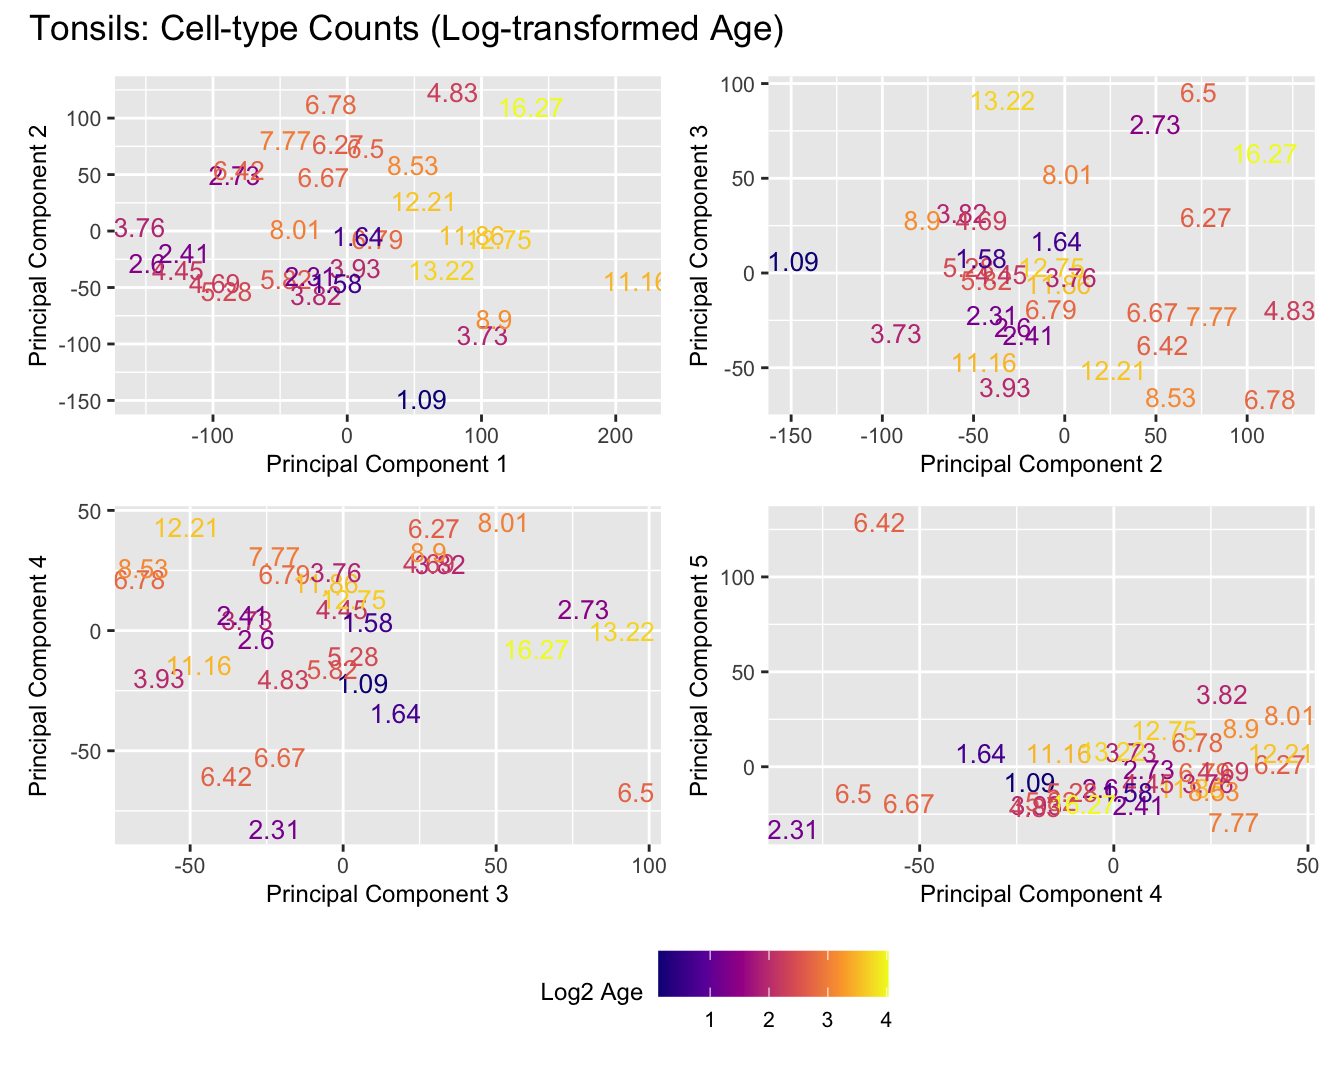
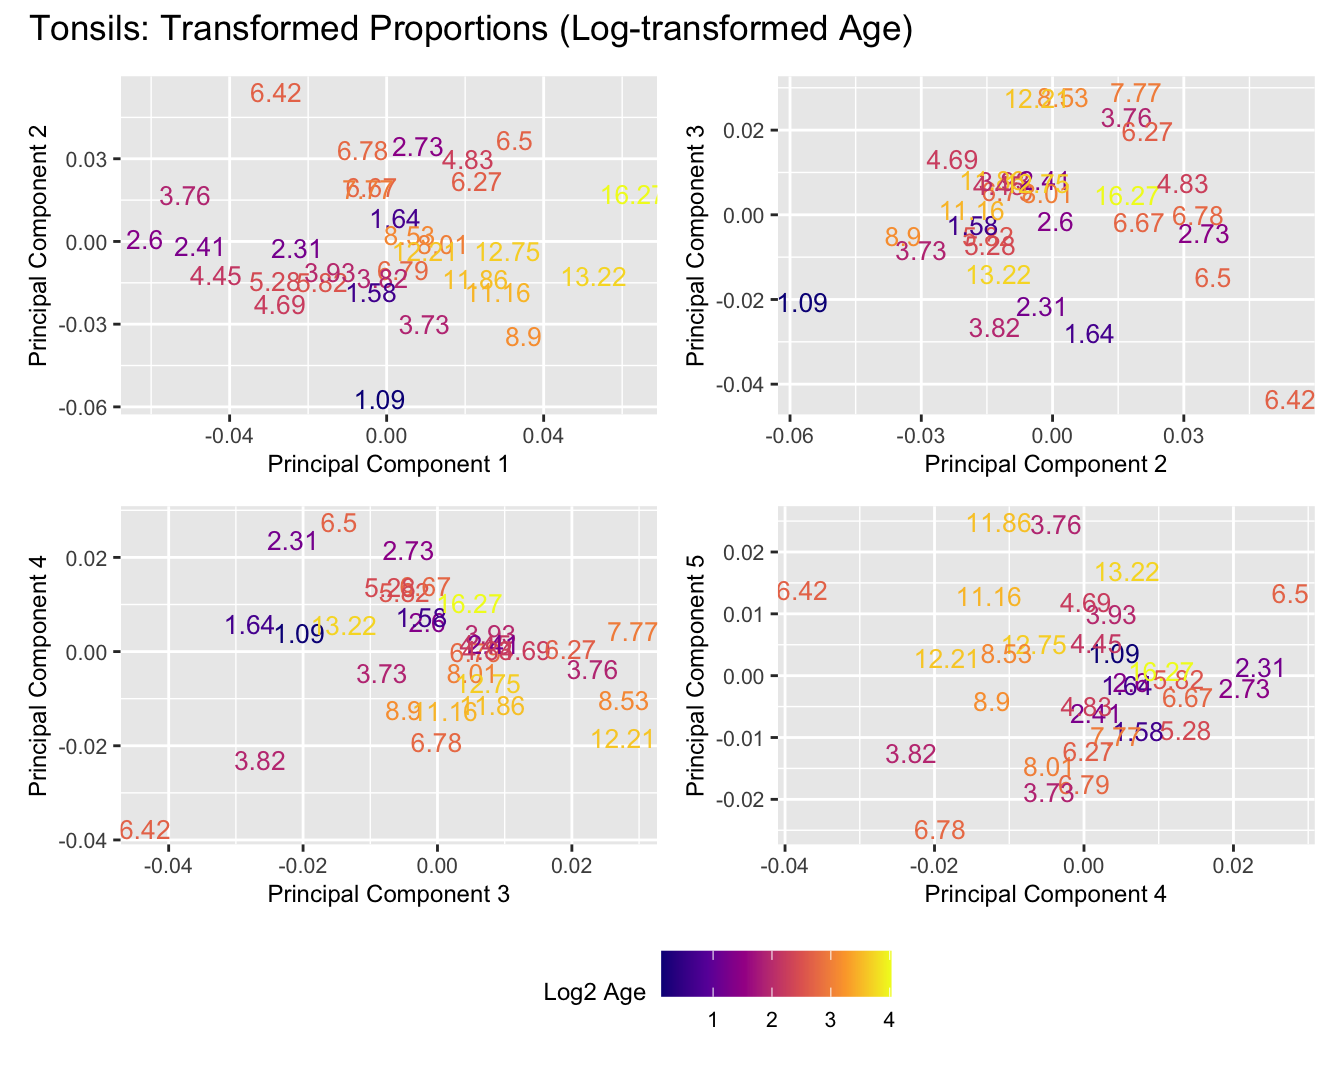
Sources of variations- Log transformed Age
dims <- list(c(1,2), c(2:3), c(3,4), c(4,5))

for (tissue_name in names(seurat_objects)) {
  tissue_obj <- seurat_objects[[tissue_name]]
  props <- getTransformedProps(clusters = tissue_obj$cell_labels,
                               sample = tissue_obj$Sample, transform = "asin")

  plot_list <- list()

  for (data_type in c("Counts", "TransformedProps")) {
    p <- vector("list", length(dims))

    for(i in 1:length(dims)) {
      mds_data <- if (data_type == "Counts") props$Counts else props$TransformedProps
      mds <- plotMDS(mds_data,
                     gene.selection = "common",
                     plot = FALSE, dim.plot = dims[[i]])

      data.frame(x = mds$x,
                 y = mds$y,
                 sample = rownames(mds$distance.matrix.squared)) %>%
        left_join(tissue_obj@meta.data %>%
                   dplyr::select(Sample,
                                 batch_name,
                                 age_years,
                                 sex),
                 by = c("sample" = "Sample")) %>%
        distinct() -> dat
        p[[i]] <- ggplot(dat, aes(x = x, y = y,
                            colour = log2(age_years)))+
    #geom_text(aes(label = str_remove_all(sample, "sample_")), size = 2.5) +
    geom_text(aes(label = str_remove_all(age_years, "sample_")), size = 3.5) +
    labs(x = glue("Principal Component {dims[[i]][1]}"),
         y = glue("Principal Component {dims[[i]][2]}"),
         colour = "Log2 Age") +
    theme(legend.direction = "horizontal",
          legend.text = element_text(size = 8),
          legend.title = element_text(size = 9),
          axis.text = element_text(size = 8),
          axis.title = element_text(size = 9)) +
    scale_colour_viridis_c(option = "plasma")
    }

    title_suffix <- if (data_type == "Counts") "Cell-type Counts (Log-transformed Age)" else "Transformed Proportions (Log-transformed Age)"
    plot_list[[data_type]] <- wrap_plots(p, cols = 2) + plot_annotation(title = paste0(tissue_name, ": ", title_suffix)) +
      plot_layout(guides = "collect") &
      theme(legend.position = "bottom")
  }

  cat(paste('### ', tissue_name, '\n', sep = ""))
  print(plot_list$Counts)
  print(plot_list$TransformedProps)
  cat("\n\n")
}
Adenoids
| Version | Author | Date |
|---|---|---|
| 0a358ce | Gunjan Dixit | 2024-05-24 |
| Version | Author | Date |
|---|---|---|
| 0a358ce | Gunjan Dixit | 2024-05-24 |
BAL
| Version | Author | Date |
|---|---|---|
| 0a358ce | Gunjan Dixit | 2024-05-24 |
| Version | Author | Date |
|---|---|---|
| 0a358ce | Gunjan Dixit | 2024-05-24 |
Bronchial_brushings
| Version | Author | Date |
|---|---|---|
| 0a358ce | Gunjan Dixit | 2024-05-24 |
| Version | Author | Date |
|---|---|---|
| 0a358ce | Gunjan Dixit | 2024-05-24 |
Model as continuous age
Adenoids, Tonsils and Nasal Brushings with two batches each-
for (tissue_name in c("Adenoids", "Tonsils", "Nasal_brushings")) {
  tissue_obj <- seurat_objects[[tissue_name]]
  props <- getTransformedProps(clusters = tissue_obj$cell_labels,
                               sample = tissue_obj$Sample, transform = "asin")

  tissue_obj@meta.data <- tissue_obj@meta.data %>%
  mutate(age_group = case_when(
    age_years >= 1 & age_years < 6  ~ "Preschool_1to5_years",
    age_years >= 6 & age_years < 12 ~ "Kids_6to11_years",
    age_years >= 12 ~ "Adolescent_12to17_years",
    TRUE ~ "Other"
  ))

  samples_metadata <- tissue_obj@meta.data %>%
    dplyr::filter(Sample %in% unique(tissue_obj@meta.data$Sample)) %>%
    dplyr::group_by(Sample) %>%
    dplyr::summarise(
      age = dplyr::first(age_years),
      sex = dplyr::first(sex),
      batch = dplyr::first(batch_name),
      age_group = dplyr::first(age_group),
      .groups = 'drop'
    )

  age <- samples_metadata$age
  sex <- as.factor(samples_metadata$sex)
  batch <- as.factor(samples_metadata$batch)
  design <- model.matrix(~age + sex + batch)
  design

  fit <- lmFit(props$TransformedProps, design)
  fit <- eBayes(fit, robust=TRUE)
  toptable.transformedProps <- topTable(fit)

  fit.prop <- lmFit(props$Proportions, design)
  fit.prop <- eBayes(fit.prop, robust=TRUE)
  toptable.props <- topTable(fit.prop, sort.by = "F")


  cat(paste('### ', tissue_name, '\n', sep = ""))
  print(knitr::kable(toptable.transformedProps, caption = paste0("Transformed proportions Toptable results: ", tissue_name)))
  print(knitr::kable(toptable.props, caption = paste0("Proportions Toptable results: ", tissue_name)))
}
Adenoids
| age | sexM | batchG000231_batch8 | AveExpr | F | P.Value | adj.P.Val | |
|---|---|---|---|---|---|---|---|
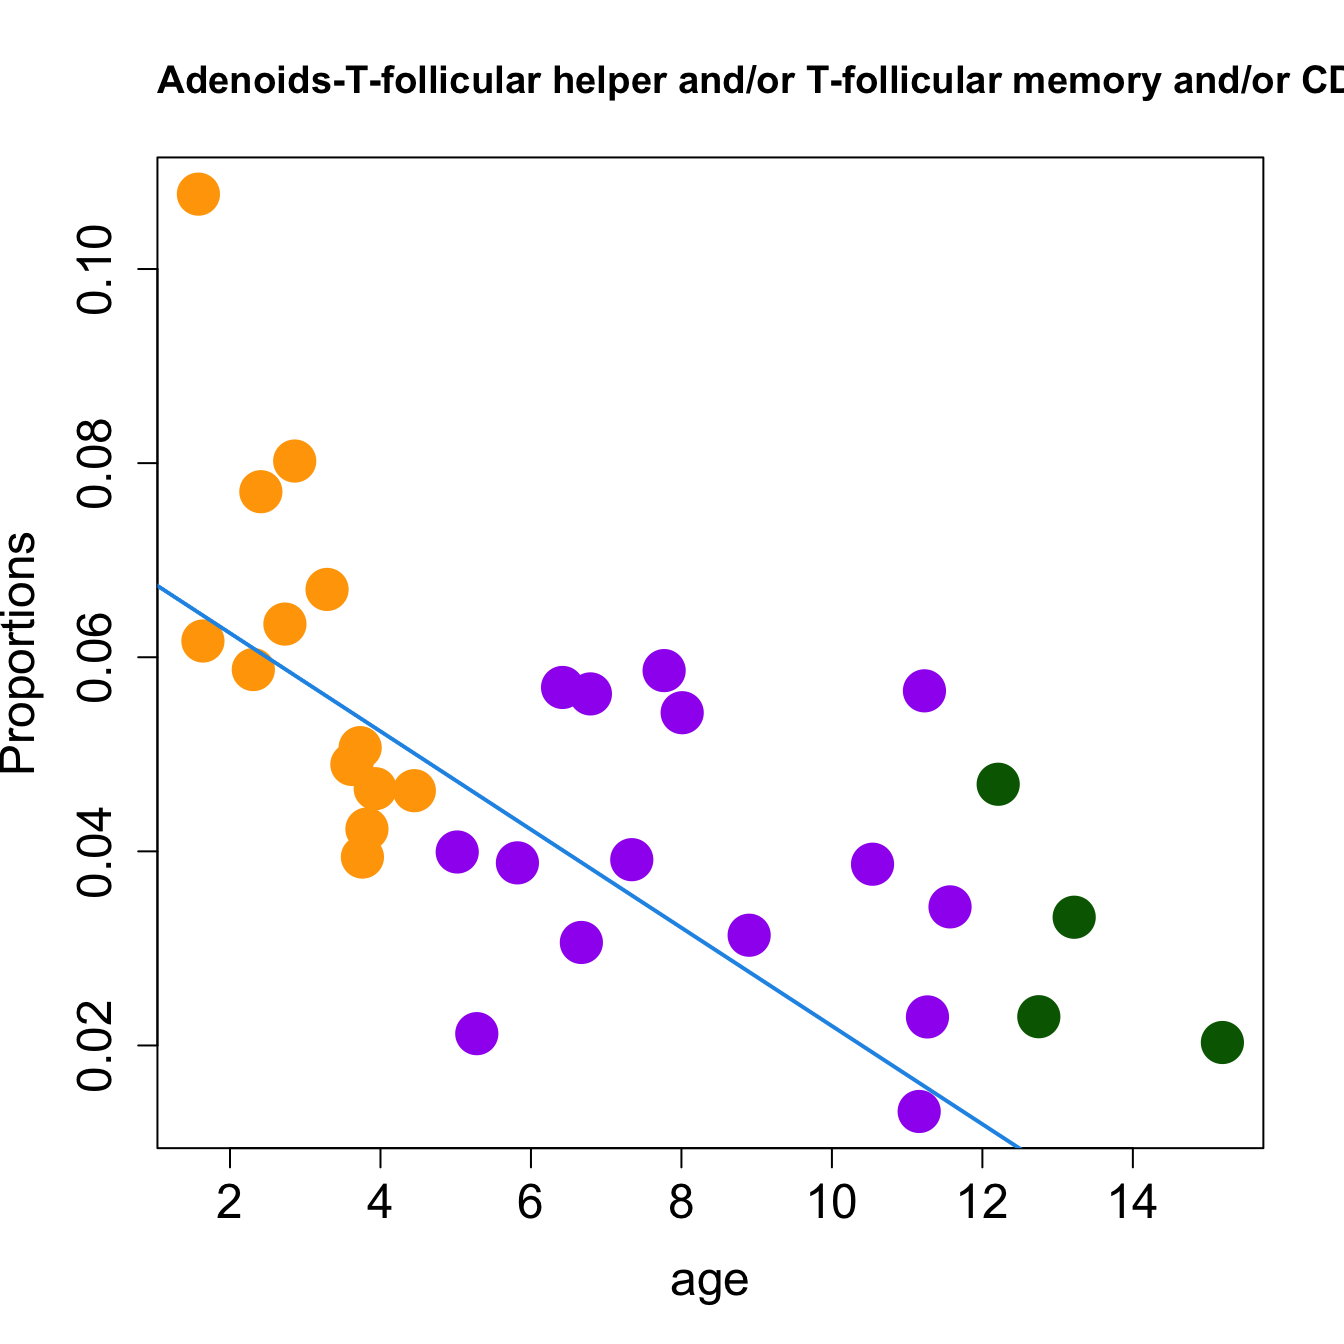
| T-follicular helper and/or T-follicular memory and/or CD4 Treg | -0.0117037 | -0.0120926 | 0.0517669 | 0.2141541 | 17.985088 | 0.0000007 | 0.0000154 |
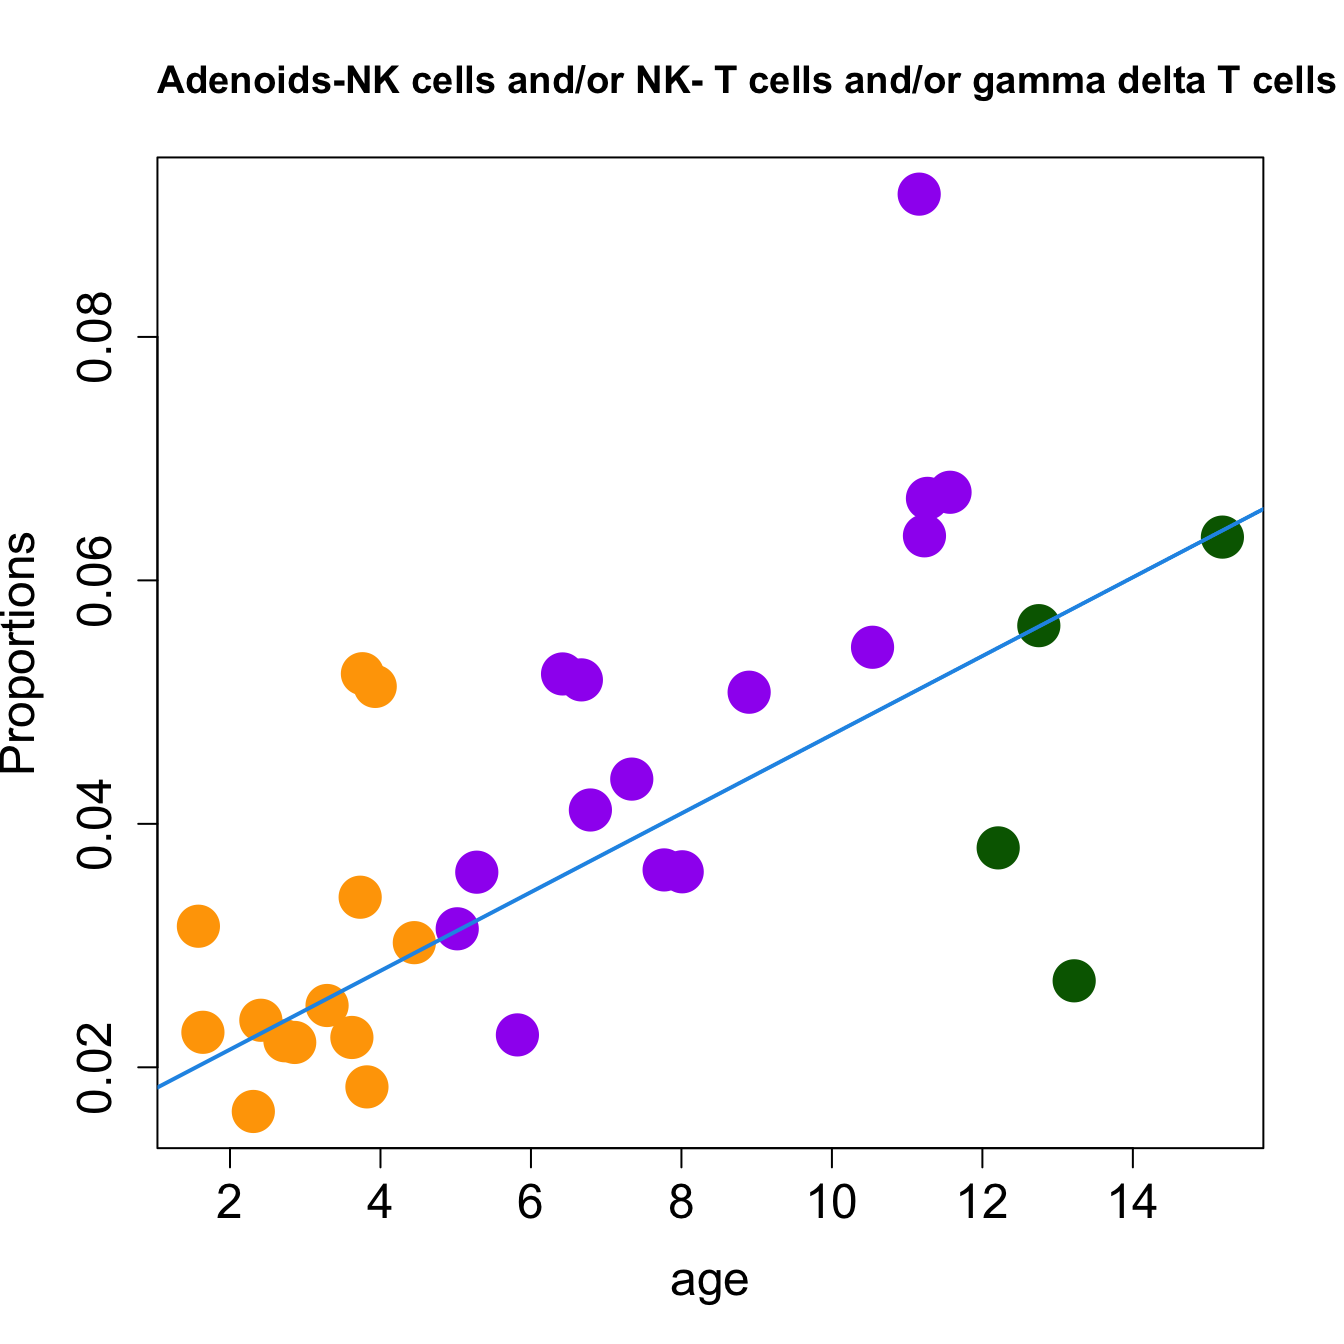
| NK cells and/or NK- T cells and/or gamma delta T cells | 0.0080113 | 0.0150085 | -0.0007604 | 0.1987685 | 9.471398 | 0.0001451 | 0.0015960 |
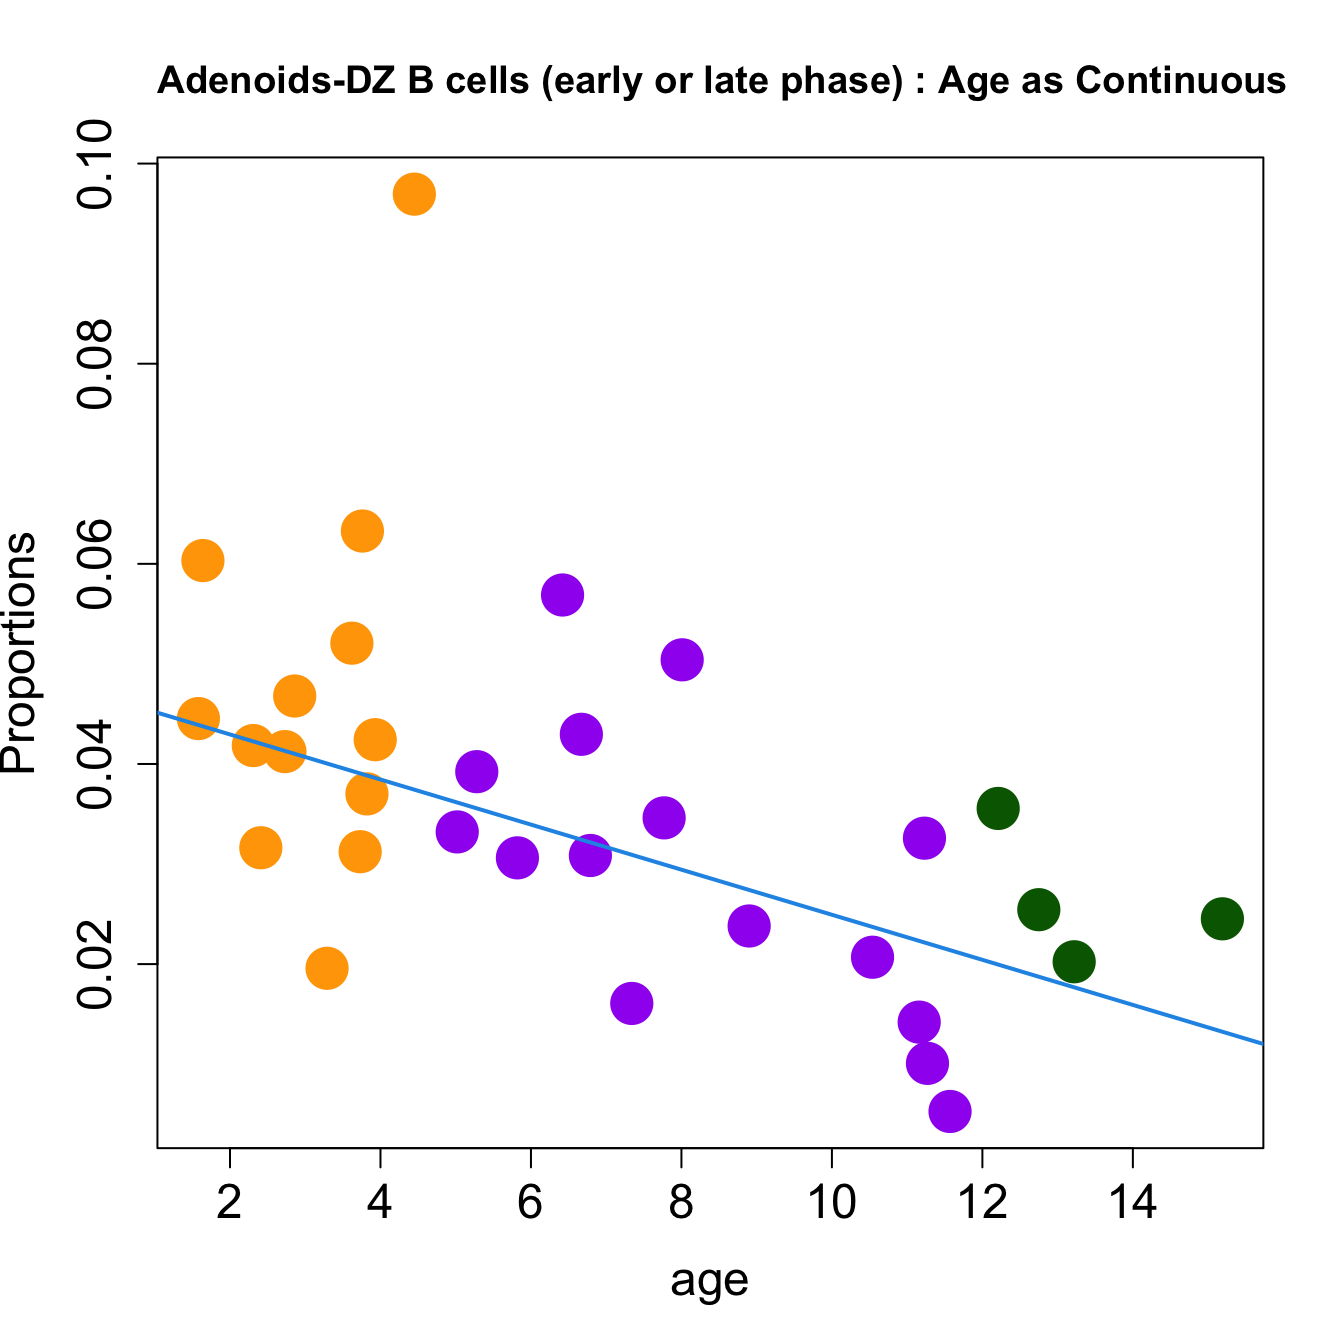
| DZ B cells (early or late phase) | -0.0067509 | 0.0203084 | -0.0027247 | 0.1855346 | 5.843507 | 0.0028550 | 0.0170125 |
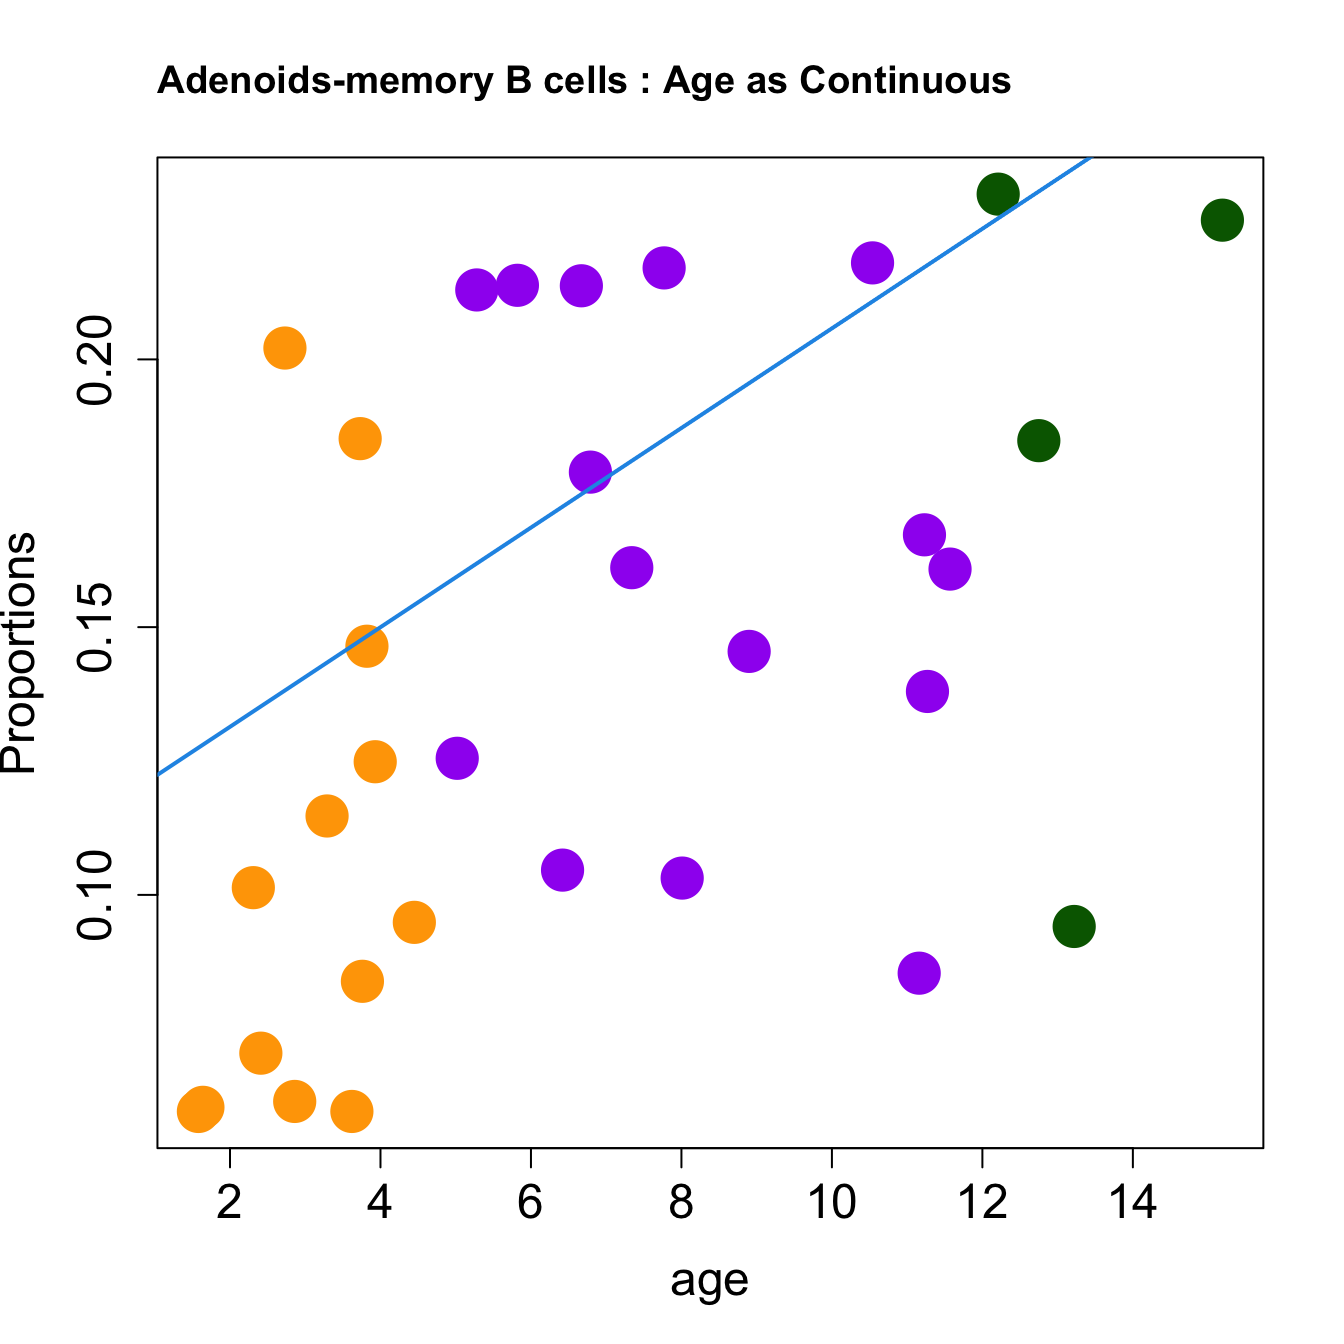
| memory B cells | 0.0142844 | -0.0360757 | -0.0601674 | 0.3792752 | 5.771221 | 0.0030932 | 0.0170125 |
| Cycling GM B cells | -0.0118589 | 0.0406248 | 0.0047769 | 0.2228255 | 5.033119 | 0.0061036 | 0.0268557 |
| pre-T cells | -0.0089586 | -0.0108462 | 0.0118156 | 0.0413268 | 3.953251 | 0.0173828 | 0.0637369 |
| Germinal centre B cell: DZ-LZ transition and/or LZ and/or LZ-DZ | -0.0112149 | 0.0200866 | 0.0137227 | 0.3355456 | 3.483934 | 0.0279487 | 0.0878388 |
| activated DC3 (aDC3)? | -0.0016382 | -0.0050395 | -0.0198613 | 0.0795866 | 3.187446 | 0.0377645 | 0.1038523 |
| monocytes/macrophages | -0.0015626 | 0.0110010 | -0.0126048 | 0.1003342 | 2.954046 | 0.0482559 | 0.1179590 |
| plasma cells | -0.0012890 | 0.0024777 | -0.0144053 | 0.0810940 | 2.397421 | 0.0875522 | 0.1815055 |
| age | sexM | batchG000231_batch8 | AveExpr | F | P.Value | adj.P.Val | |
|---|---|---|---|---|---|---|---|
| T-follicular helper and/or T-follicular memory and/or CD4 Treg | -0.0050606 | -0.0057930 | 0.0241311 | 0.0470619 | 21.585749 | 0.0000002 | 0.0000035 |
| NK cells and/or NK- T cells and/or gamma delta T cells | 0.0032333 | 0.0072623 | -0.0005919 | 0.0407381 | 9.738957 | 0.0001348 | 0.0014823 |
| memory B cells | 0.0093029 | -0.0264214 | -0.0380241 | 0.1420777 | 5.321678 | 0.0048456 | 0.0271595 |
| DZ B cells (early or late phase) | -0.0022529 | 0.0089447 | -0.0021345 | 0.0361300 | 5.300340 | 0.0049381 | 0.0271595 |
| Germinal centre B cell: DZ-LZ transition and/or LZ and/or LZ-DZ | -0.0061409 | 0.0149197 | 0.0044698 | 0.1136184 | 2.922459 | 0.0507906 | 0.2046084 |
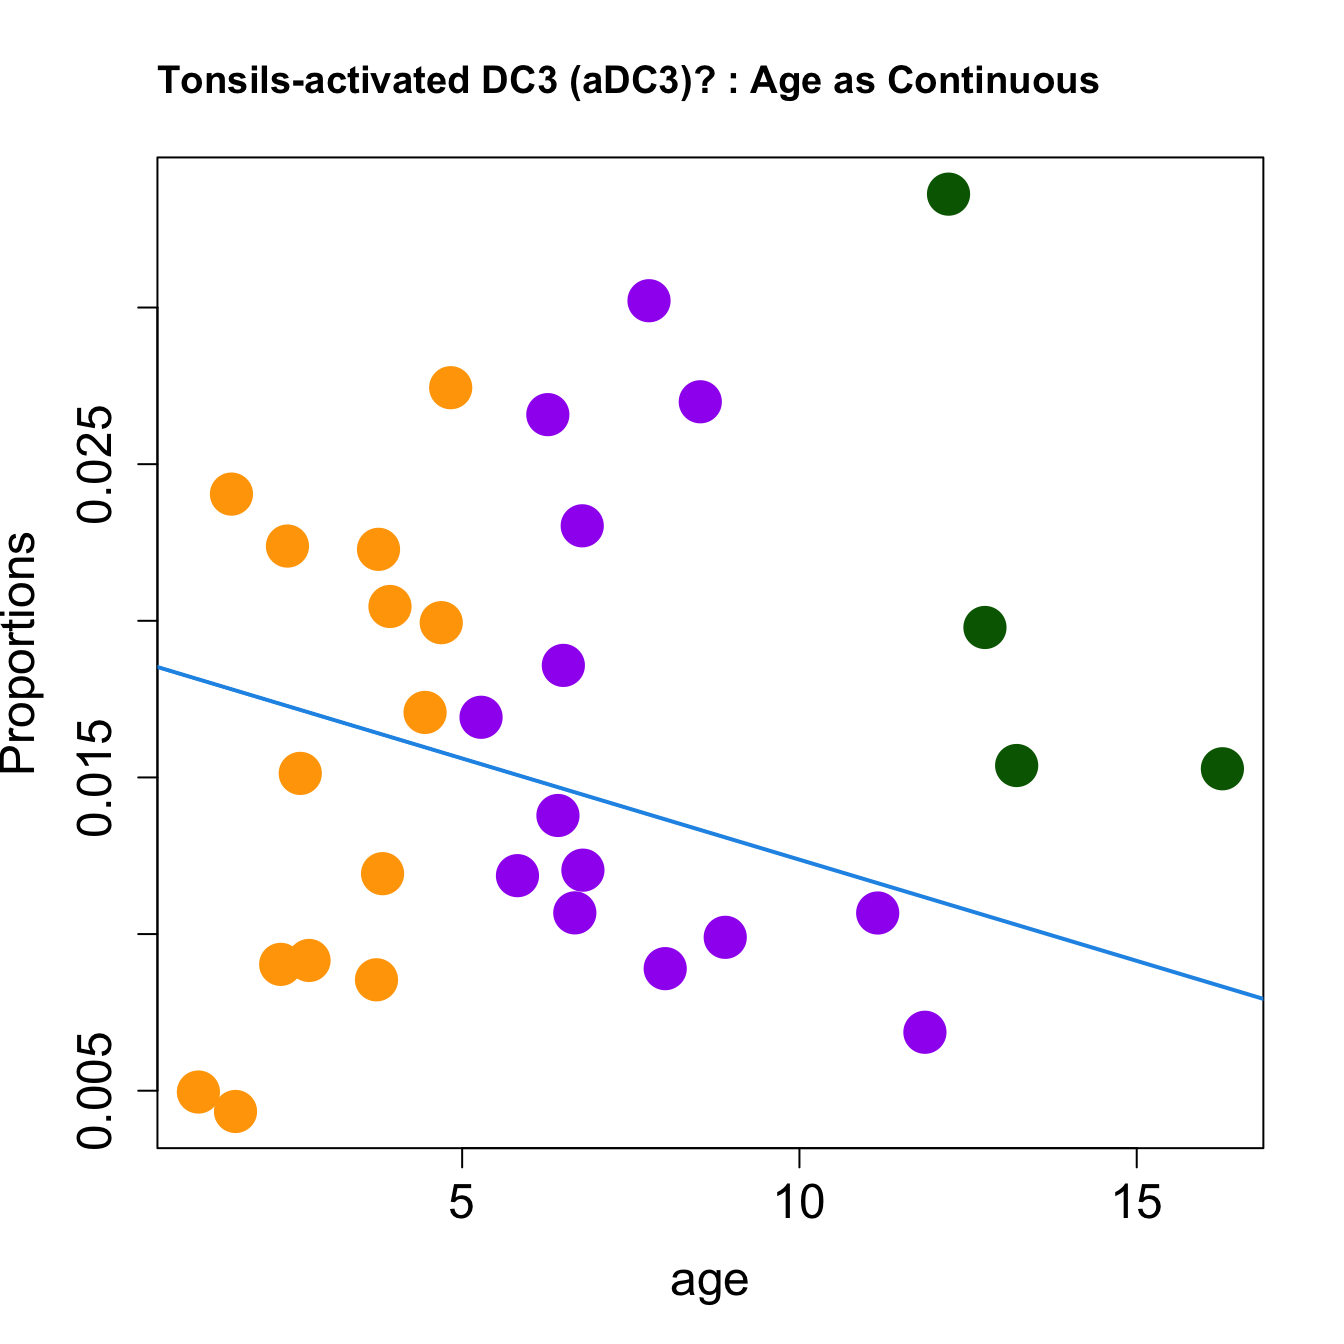
| activated DC3 (aDC3)? | -0.0002176 | -0.0011815 | -0.0032367 | 0.0071207 | 2.772420 | 0.0593692 | 0.2046084 |
| Cycling GM B cells | -0.0049410 | 0.0227681 | 0.0068758 | 0.0551574 | 2.584207 | 0.0725826 | 0.2046084 |
| neutrophils | 0.0007822 | -0.0025766 | -0.0057039 | 0.0024897 | 2.457390 | 0.0830003 | 0.2046084 |
| CM CD4 T cells and/or pre TFH cells | 0.0044829 | -0.0315803 | 0.0079408 | 0.1383713 | 2.401684 | 0.0882148 | 0.2046084 |
| monocytes/macrophages | -0.0003022 | 0.0023282 | -0.0022167 | 0.0106225 | 2.351417 | 0.0930038 | 0.2046084 |
Tonsils
| age | sexM | batchG000231_batch9 | AveExpr | F | P.Value | adj.P.Val | |
|---|---|---|---|---|---|---|---|
| Germinal centre B cell: DZ-LZ transition and/or LZ and/or LZ-DZ | -0.0141598 | -0.0343478 | -0.0451938 | 0.3441087 | 12.120142 | 0.0000205 | 0.0004913 |
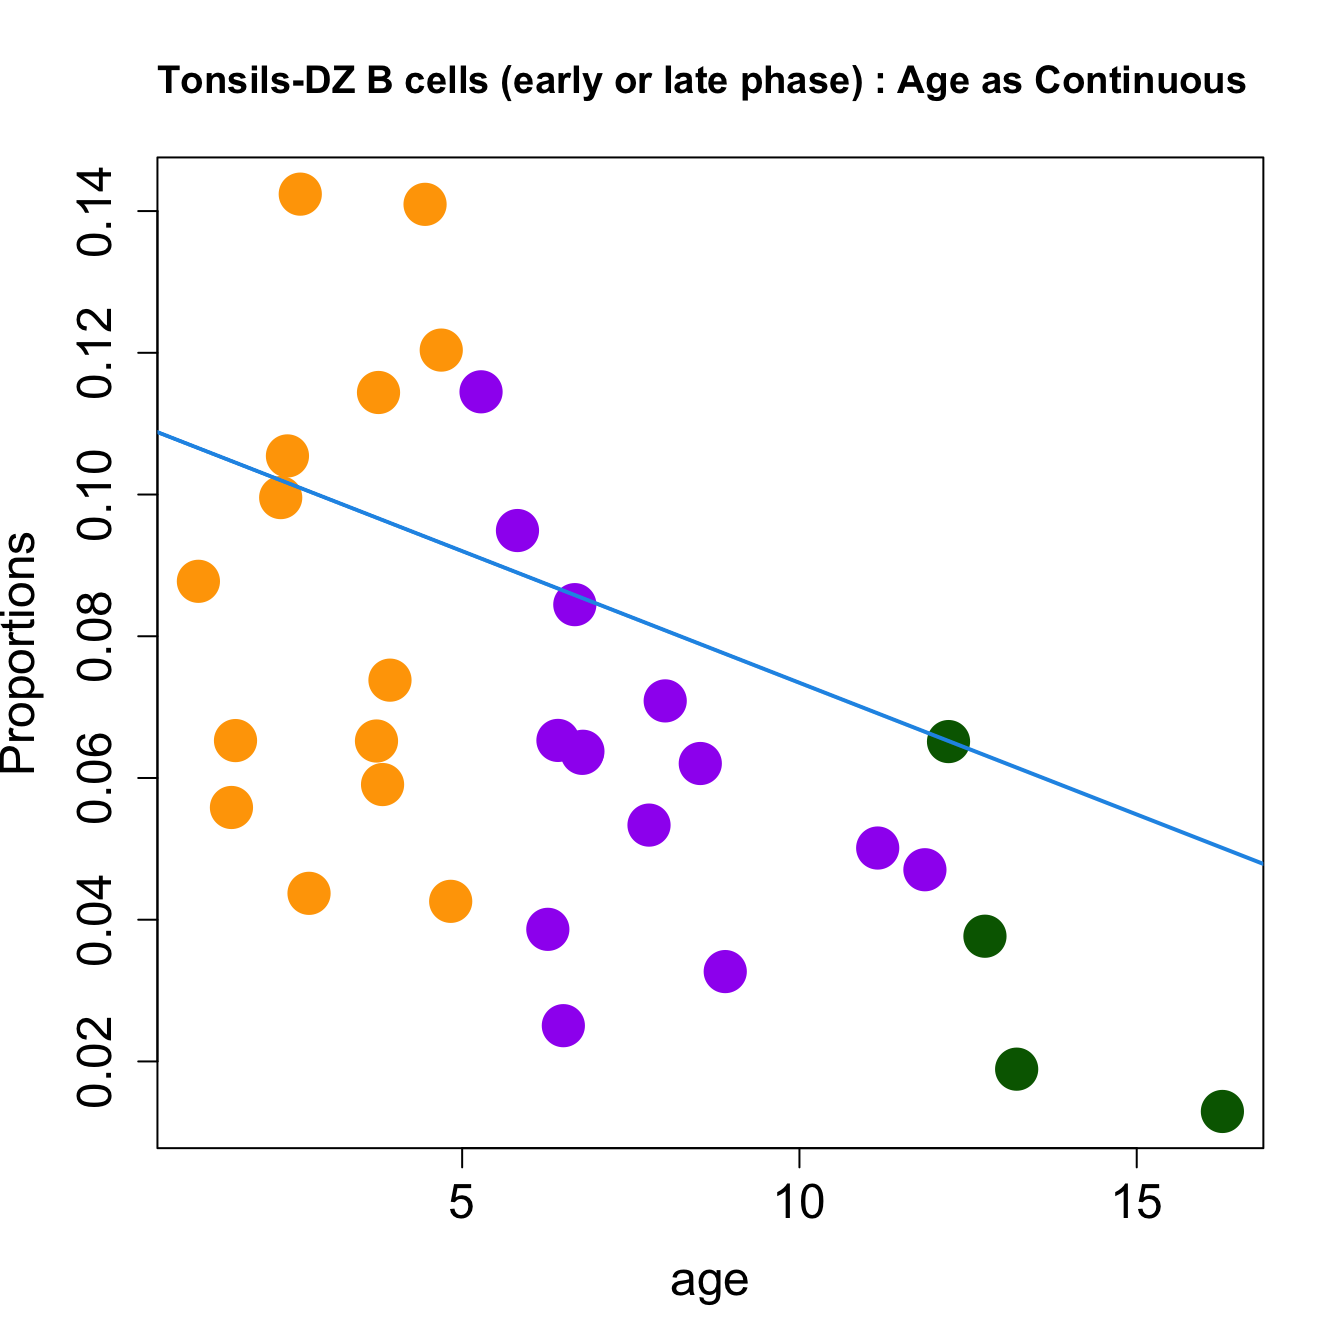
| DZ B cells (early or late phase) | -0.0083404 | -0.0178757 | -0.0458115 | 0.2588213 | 9.766035 | 0.0001087 | 0.0013045 |
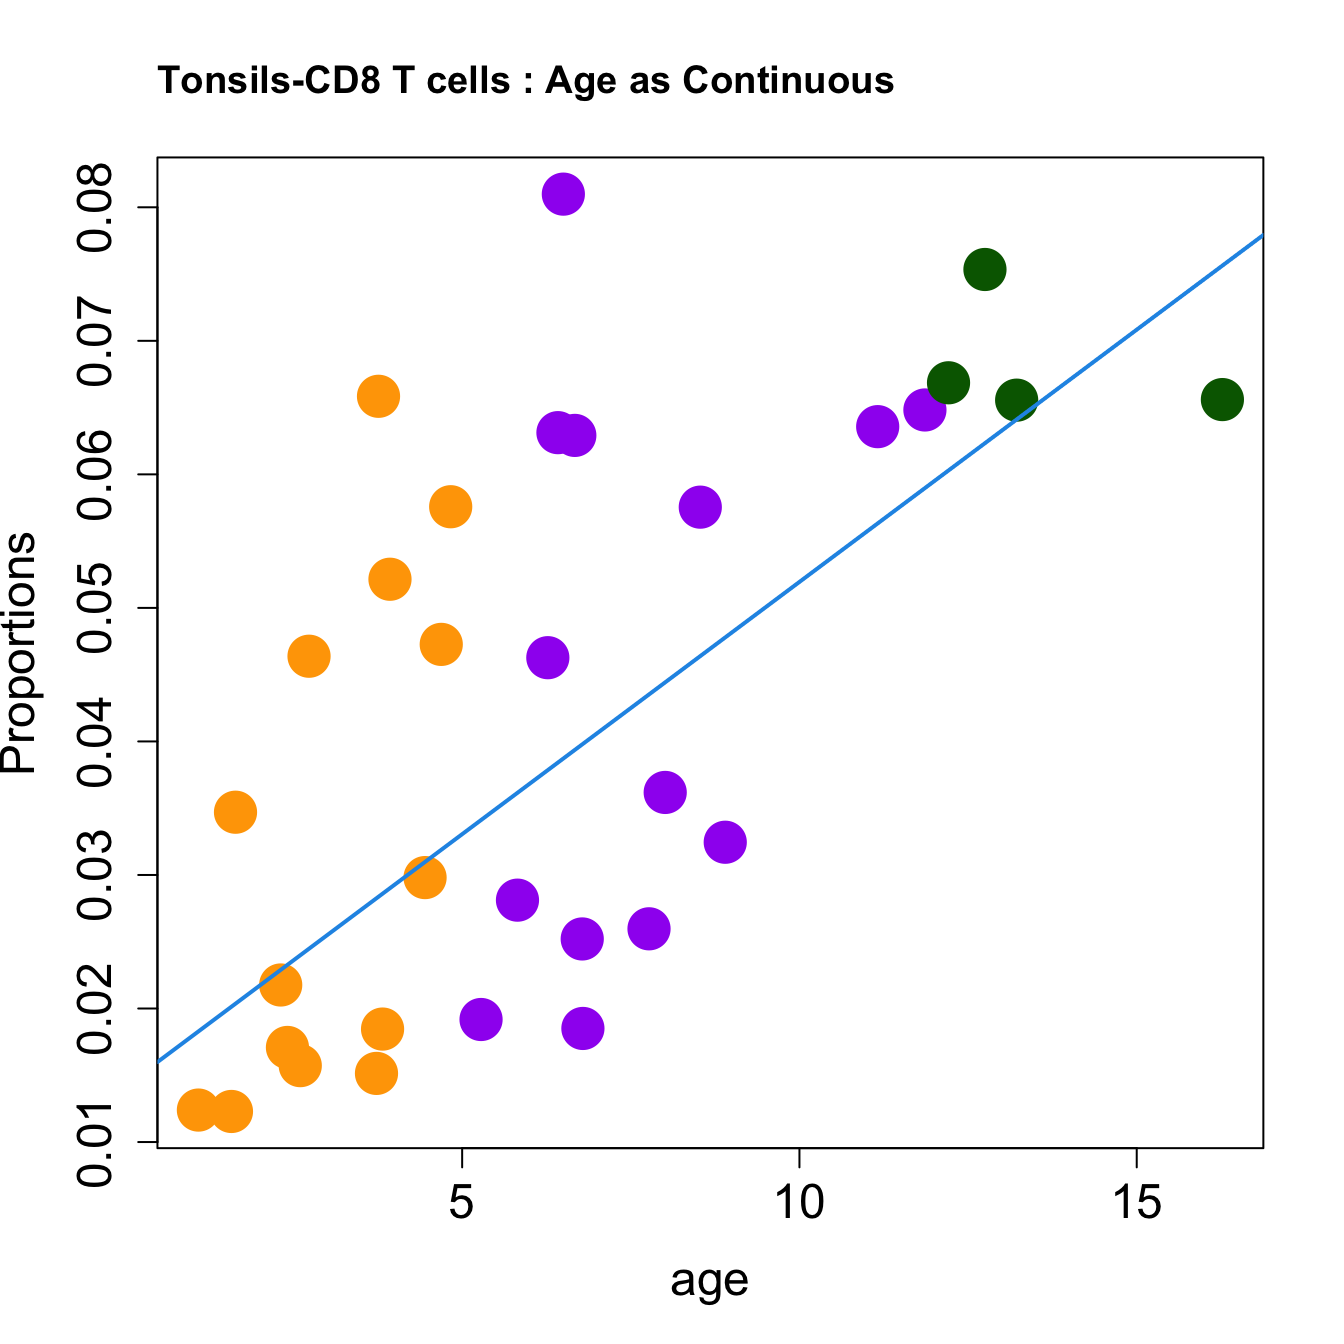
| CD8 T cells | 0.0099773 | 0.0176558 | -0.0010949 | 0.1993472 | 7.068491 | 0.0009379 | 0.0058935 |
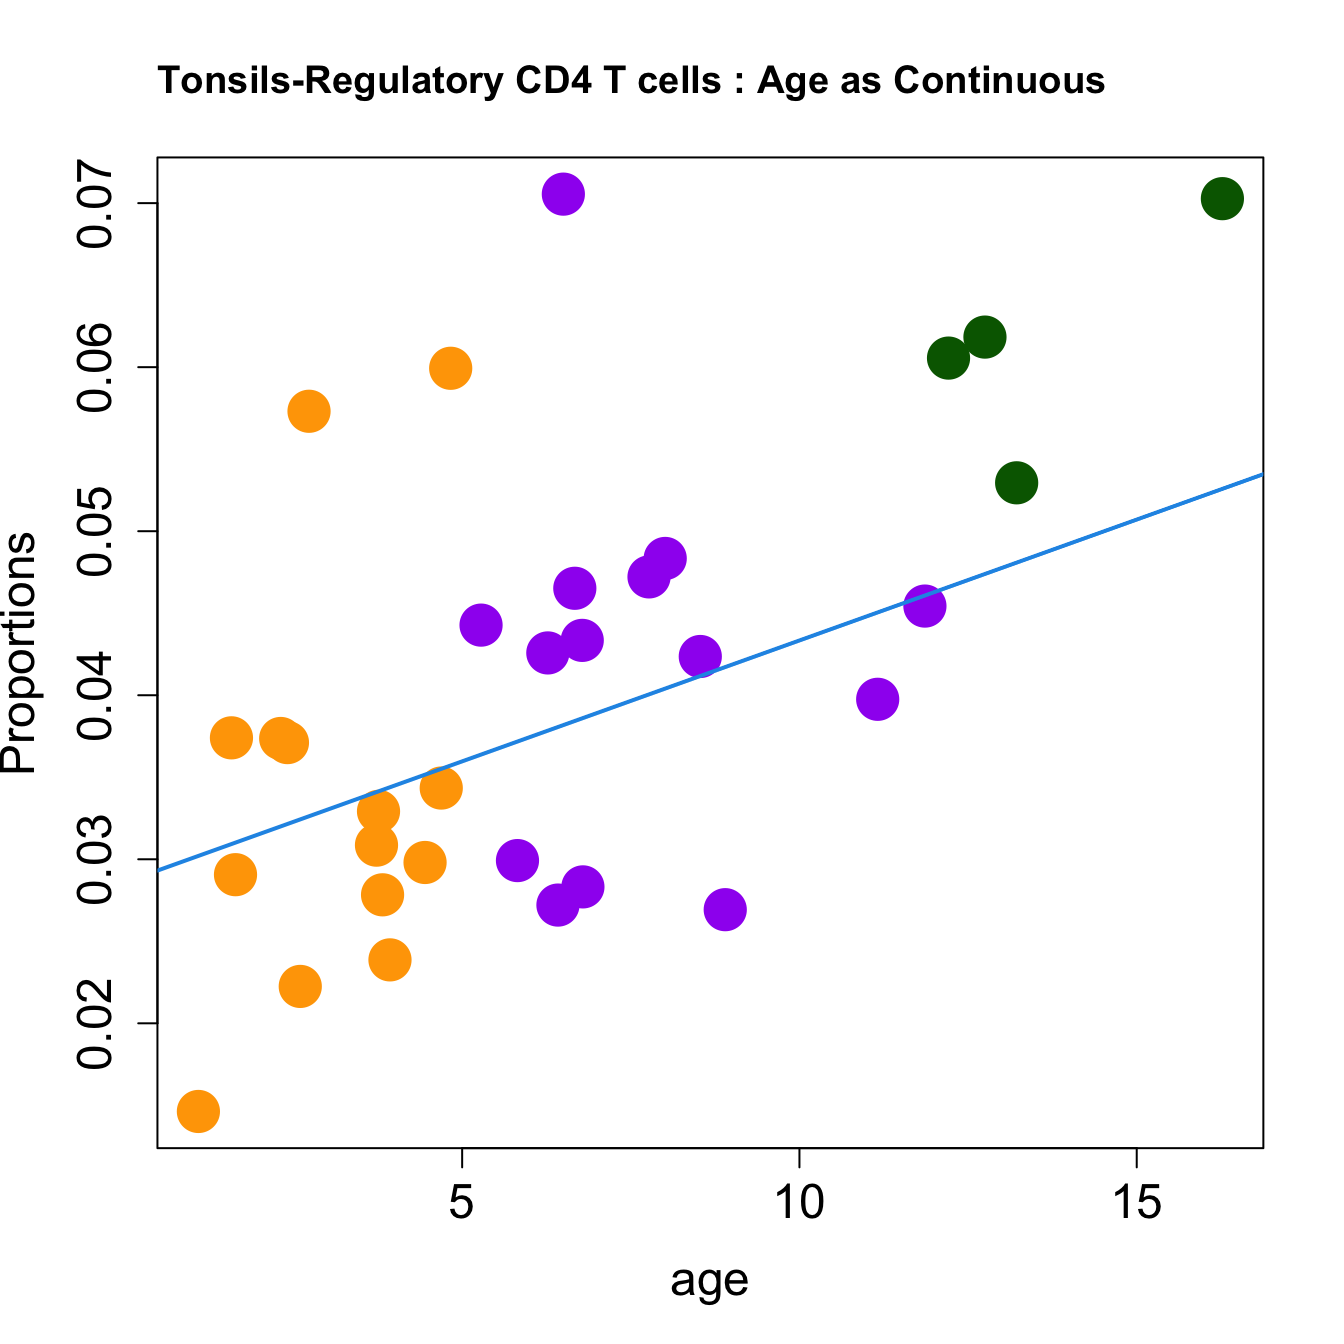
| Regulatory CD4 T cells | 0.0036381 | -0.0087860 | 0.0229636 | 0.2002894 | 6.994355 | 0.0009823 | 0.0058935 |
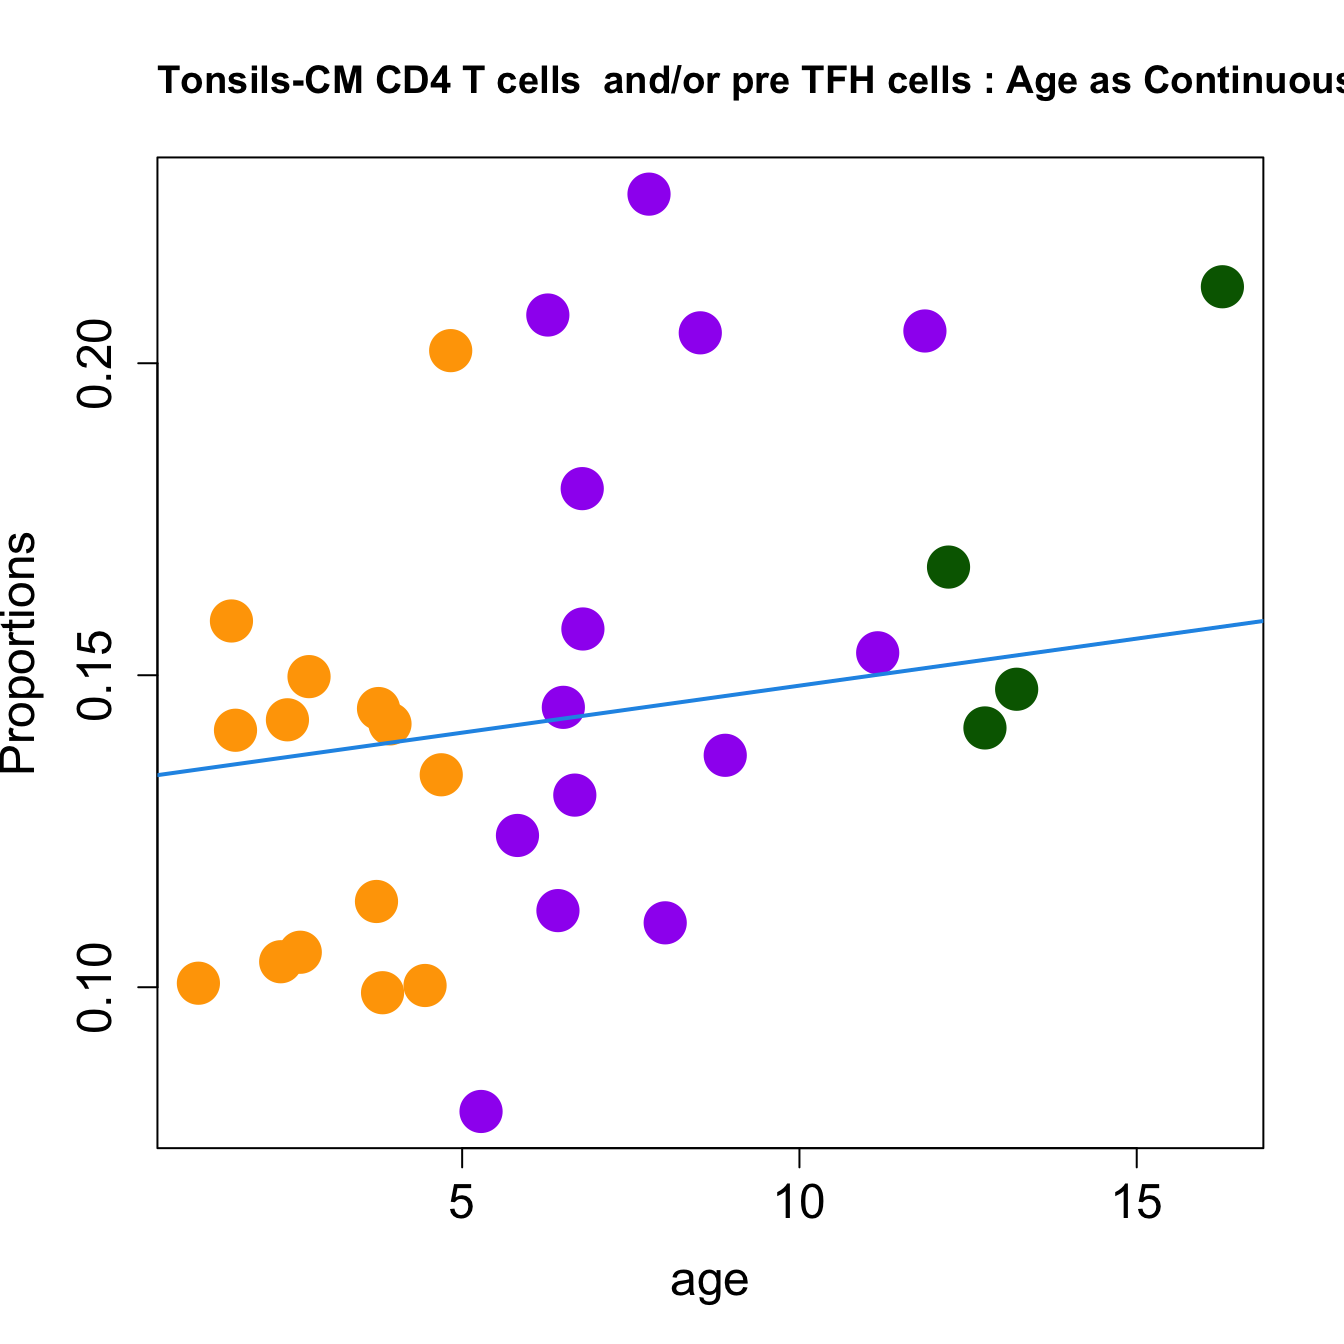
| CM CD4 T cells and/or pre TFH cells | 0.0021446 | -0.0306858 | 0.0463883 | 0.3897797 | 6.370373 | 0.0017215 | 0.0082632 |
| activated DC3 (aDC3)? | -0.0023906 | -0.0236181 | 0.0405279 | 0.1252740 | 6.082416 | 0.0021956 | 0.0087825 |
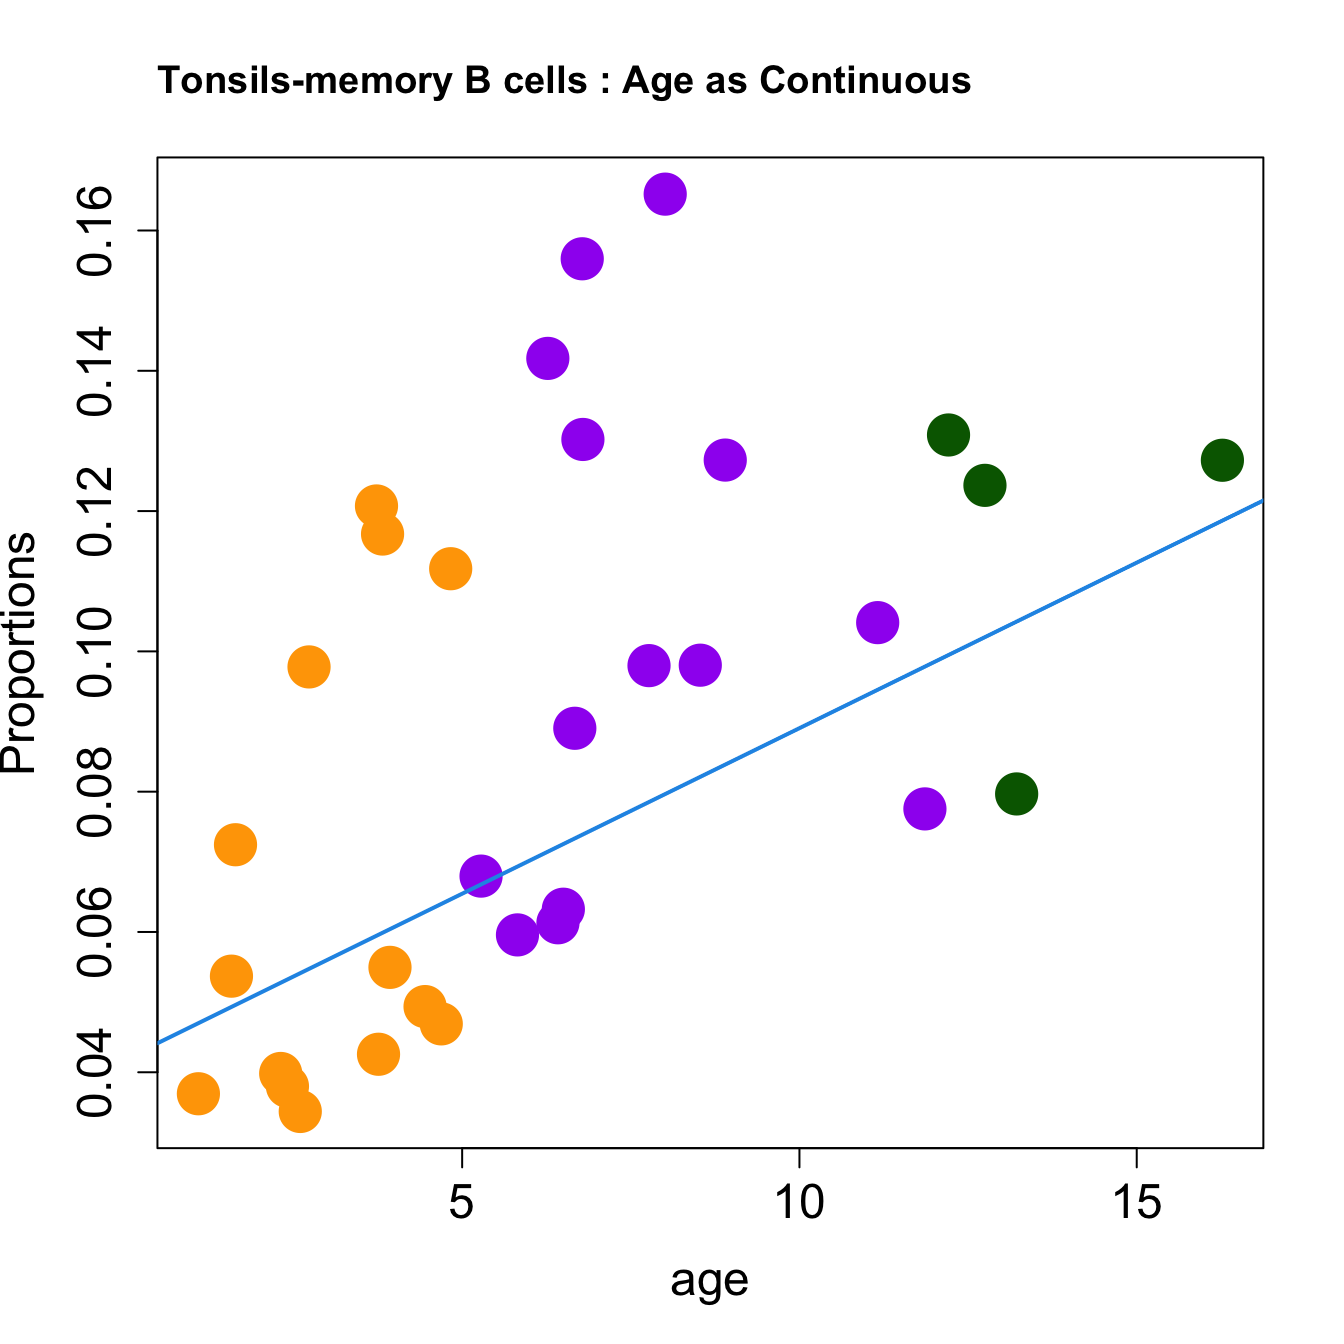
| memory B cells | 0.0089230 | 0.0235752 | 0.0258019 | 0.2944656 | 5.637572 | 0.0033380 | 0.0114447 |
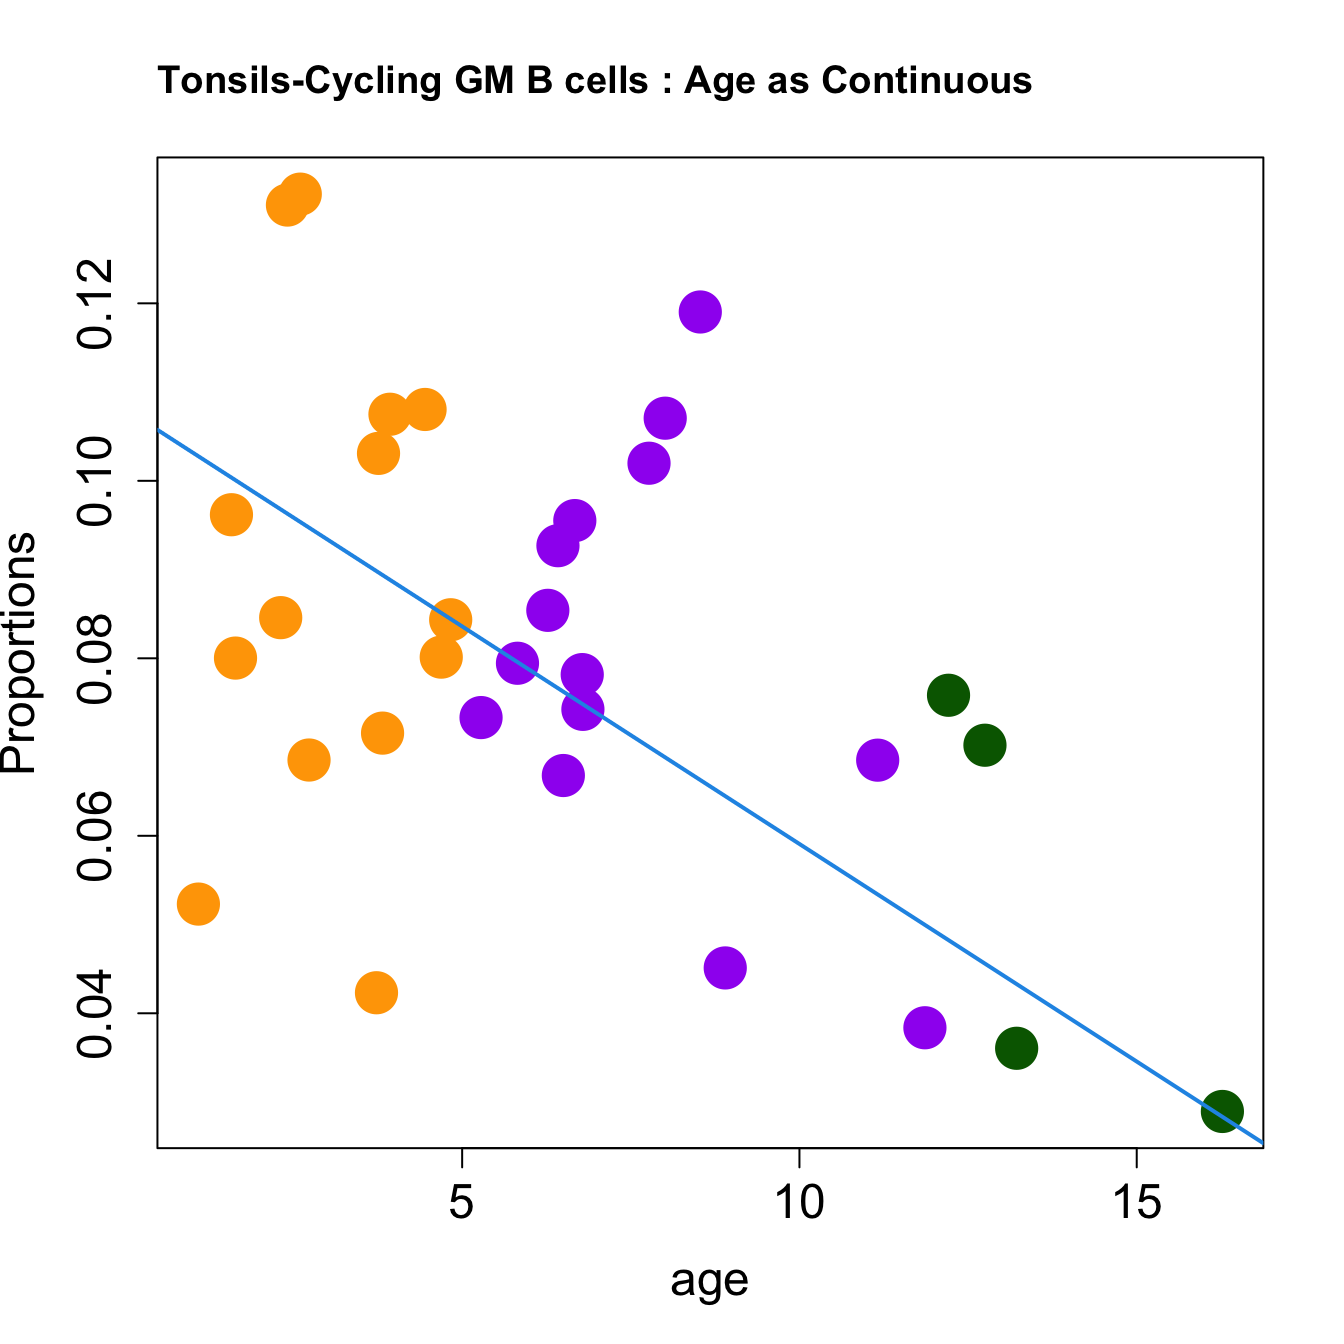
| Cycling GM B cells | -0.0096661 | -0.0175264 | 0.0359624 | 0.2839906 | 5.292177 | 0.0046029 | 0.0138087 |
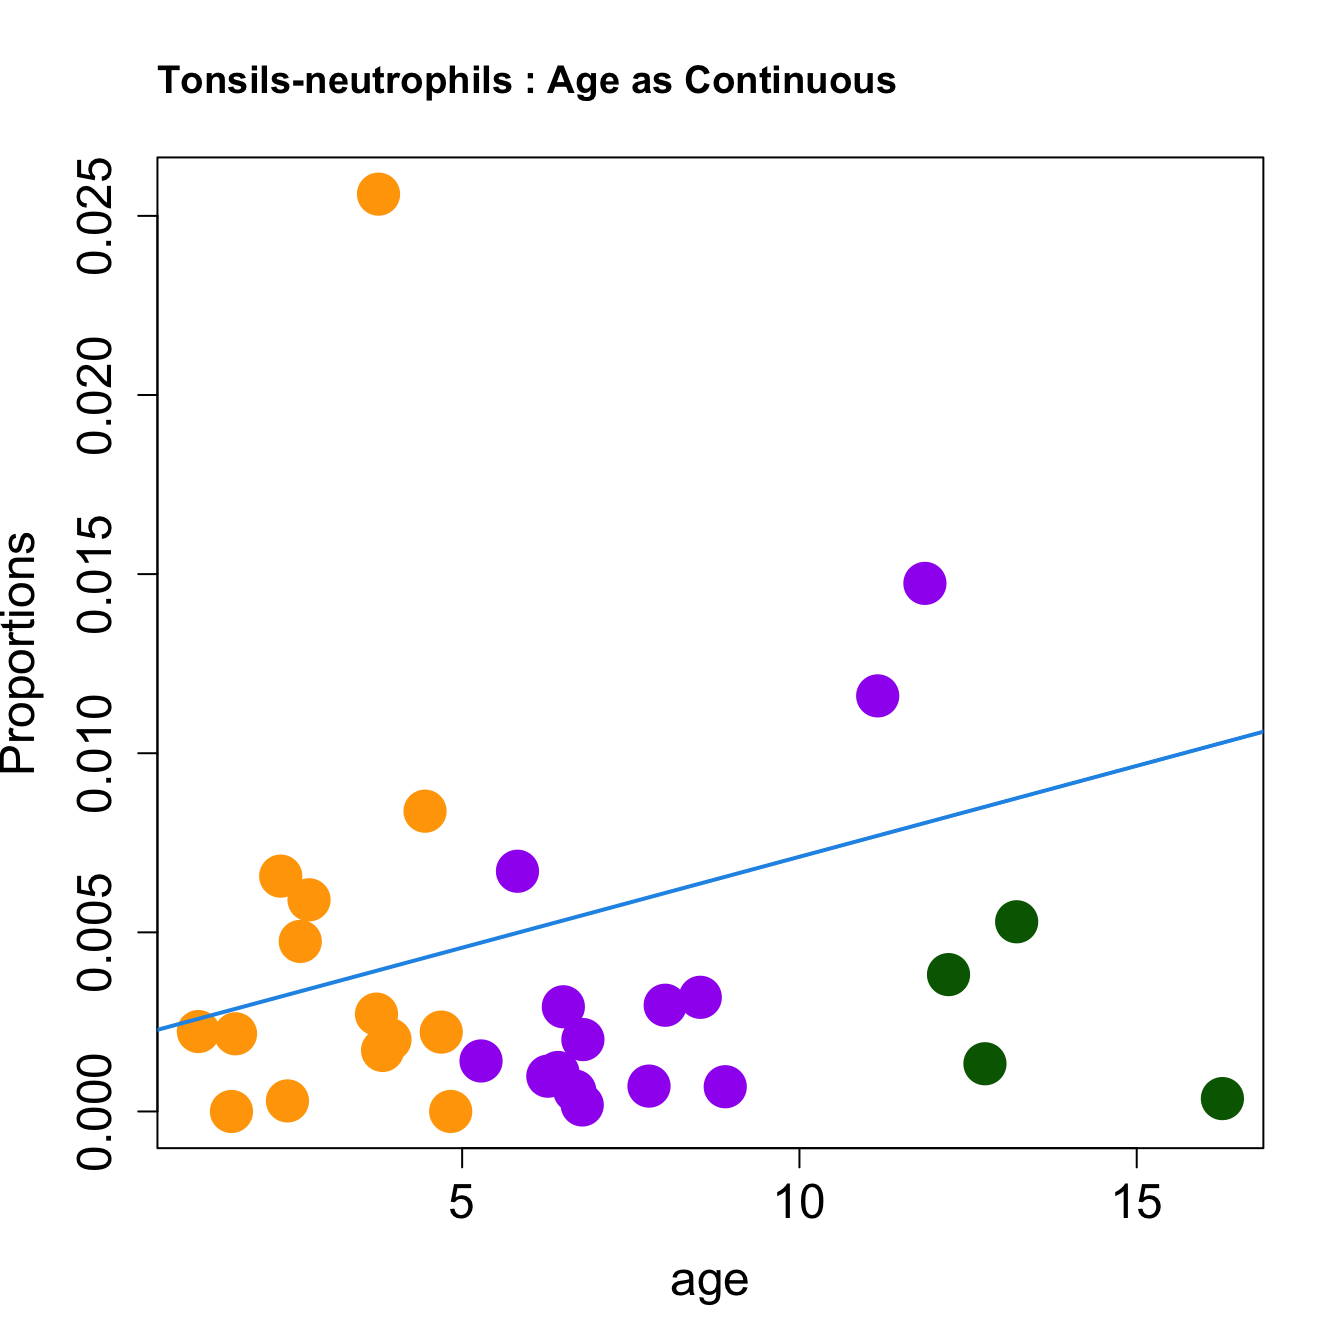
| neutrophils | 0.0044743 | 0.0196783 | -0.0460594 | 0.0524873 | 4.903825 | 0.0065897 | 0.0175726 |
| Naive B cell activated | 0.0065440 | 0.0076935 | -0.0302492 | 0.1777379 | 2.765422 | 0.0584426 | 0.1402623 |
| age | sexM | batchG000231_batch9 | AveExpr | F | P.Value | adj.P.Val | |
|---|---|---|---|---|---|---|---|
| Germinal centre B cell: DZ-LZ transition and/or LZ and/or LZ-DZ | -0.0084452 | -0.0224598 | -0.0283193 | 0.1199224 | 9.463885 | 0.0001627 | 0.0039053 |
| DZ B cells (early or late phase) | -0.0037181 | -0.0097905 | -0.0240633 | 0.0692911 | 8.251433 | 0.0004067 | 0.0048801 |
| Regulatory CD4 T cells | 0.0014747 | -0.0030909 | 0.0088465 | 0.0407203 | 7.303567 | 0.0008671 | 0.0057532 |
| activated DC3 (aDC3)? | -0.0006465 | -0.0060291 | 0.0103591 | 0.0164936 | 6.948272 | 0.0011537 | 0.0057532 |
| CD8 T cells | 0.0037783 | 0.0064033 | 0.0001585 | 0.0420241 | 6.912413 | 0.0011986 | 0.0057532 |
| CM CD4 T cells and/or pre TFH cells | 0.0015077 | -0.0229258 | 0.0326892 | 0.1463575 | 6.371939 | 0.0018967 | 0.0075868 |
| memory B cells | 0.0047209 | 0.0145889 | 0.0155014 | 0.0880232 | 5.176634 | 0.0055069 | 0.0188806 |
| Cycling GM B cells | -0.0049036 | -0.0099528 | 0.0188909 | 0.0805841 | 4.778497 | 0.0079846 | 0.0239539 |
| Naive B cell activated | 0.0023247 | 0.0034793 | -0.0093027 | 0.0329960 | 2.761341 | 0.0600604 | 0.1601612 |
| Pre-T follicular helper / CD4 Treg | -0.0002605 | -0.0003124 | 0.0016358 | 0.0024761 | 2.504281 | 0.0788196 | 0.1834559 |
Nasal_brushings
| age | sexM | batchG000231_batch5 | AveExpr | F | P.Value | adj.P.Val | |
|---|---|---|---|---|---|---|---|
| NK-T cells | -0.0147996 | 0.0735284 | 0.0328663 | 0.1611396 | 3.488244 | 0.0276287 | 0.3000845 |
| monocyte and neutrophil-like | -0.0010021 | 0.0525727 | -0.0879388 | 0.1682310 | 3.146680 | 0.0393800 | 0.3000845 |
| mast cells | 0.0081814 | 0.0109839 | -0.0419161 | 0.0782283 | 2.548362 | 0.0743479 | 0.3000845 |
| plasmacytoid DCs | 0.0018378 | 0.0319181 | -0.0359758 | 0.0512956 | 2.252954 | 0.1023900 | 0.3000845 |
| neutrophils | -0.0040300 | -0.0628129 | -0.0339068 | 0.0791660 | 2.046915 | 0.1282605 | 0.3000845 |
| B cells | -0.0075329 | -0.1448491 | 0.0807056 | 0.2791431 | 2.031871 | 0.1306262 | 0.3000845 |
| CD8 T cells | -0.0136321 | -0.0472306 | 0.1269937 | 0.4502654 | 2.027266 | 0.1312870 | 0.3000845 |
| proliferating T/NK | -0.0051705 | 0.0299025 | -0.0211687 | 0.0884831 | 1.898459 | 0.1509935 | 0.3019871 |
| plasma B cells | -0.0064534 | 0.0015147 | 0.0246574 | 0.0620145 | 1.123979 | 0.3548865 | 0.5193914 |
| viral-activated cells | -0.0065133 | 0.0865647 | -0.0068470 | 0.0836597 | 1.101964 | 0.3636798 | 0.5193914 |
| age | sexM | batchG000231_batch5 | AveExpr | F | P.Value | adj.P.Val | |
|---|---|---|---|---|---|---|---|
| plasmacytoid DCs | 0.0005436 | 0.0041524 | -0.0078962 | 0.0053672 | 2.481066 | 0.0808514 | 0.4688430 |
| NK-T cells | -0.0051875 | 0.0368998 | 0.0168949 | 0.0390653 | 2.417714 | 0.0866305 | 0.4688430 |
| monocyte and neutrophil-like | 0.0002761 | 0.0244582 | -0.0336835 | 0.0364423 | 2.404075 | 0.0879081 | 0.4688430 |
| mast cells | 0.0022573 | 0.0040851 | -0.0163894 | 0.0123677 | 2.008948 | 0.1347357 | 0.5135964 |
| B cells | 0.0004128 | -0.1106854 | 0.0626827 | 0.1071052 | 1.849244 | 0.1604989 | 0.5135964 |
| CD8 T cells | -0.0089496 | -0.0107879 | 0.0931520 | 0.2130470 | 1.534815 | 0.2266501 | 0.5208806 |
| proliferating T/NK | -0.0009965 | 0.0083334 | -0.0072645 | 0.0109445 | 1.352027 | 0.2769961 | 0.5208806 |
| neutrophils | -0.0008920 | -0.0240376 | -0.0172784 | 0.0159943 | 1.331904 | 0.2832750 | 0.5208806 |
| goblet/club/basal cells | 0.0084183 | 0.0076736 | -0.1100610 | 0.3124801 | 1.301163 | 0.2929953 | 0.5208806 |
| ionocytes | 0.0000201 | -0.0003328 | -0.0035608 | 0.0055732 | 1.020224 | 0.3980570 | 0.6342899 |
Model as continuous age- Bronchial brushings and BAL (single batch)
for (tissue_name in c("Bronchial_brushings", "BAL")) {
  tissue_obj <- seurat_objects[[tissue_name]]
tissue_obj <- seurat_objects[[tissue_name]]

props <- getTransformedProps(clusters = tissue_obj$cell_labels,
                             sample = tissue_obj$Sample, transform = "asin")

tissue_obj@meta.data <- tissue_obj@meta.data %>%
  mutate(age_group = case_when(
    age_years >= 1 & age_years < 6  ~ "Preschool_1to5_years",
    age_years >= 6 & age_years < 12 ~ "Kids_6to11_years",
    age_years >= 12 ~ "Adolescent_12to17_years",
    TRUE ~ "Other"
  ))

samples_metadata <- tissue_obj@meta.data %>%
    dplyr::filter(Sample %in% unique(tissue_obj@meta.data$Sample)) %>%
    dplyr::group_by(Sample) %>%
    dplyr::summarise(
      age = dplyr::first(age_years),
      sex = dplyr::first(sex),
      batch = dplyr::first(batch_name),
      age_group = dplyr::first(age_group),
      .groups = 'drop'
    )

  age <- samples_metadata$age
  sex <- as.factor(samples_metadata$sex)
  batch <- as.factor(samples_metadata$batch)
  design <- model.matrix(~age + sex)
  design

  fit <- lmFit(props$TransformedProps, design)
  fit <- eBayes(fit, robust=TRUE)
  toptable.transformedProps <- topTable(fit)

  fit.prop <- lmFit(props$Proportions, design)
  fit.prop <- eBayes(fit.prop, robust=TRUE)
  toptable.props <- topTable(fit.prop, sort.by = "F")


  cat(paste('### ', tissue_name, '\n', sep = ""))
  print(knitr::kable(toptable.transformedProps, caption = paste0("Transformed proportions Toptable results: ", tissue_name)))
  print(knitr::kable(toptable.props, caption = paste0("Proportions Toptable results: ", tissue_name)))
}
Bronchial_brushings
| age | sexM | AveExpr | F | P.Value | adj.P.Val | |
|---|---|---|---|---|---|---|
| mast cells | 0.0116466 | -0.0009733 | 0.1331685 | 2.9266155 | 0.0847851 | 0.6701451 |
| macrophages | 0.0234778 | 0.0419536 | 0.4072729 | 2.3302894 | 0.1321037 | 0.6701451 |
| B cells | -0.0141048 | -0.0058262 | 0.2334501 | 1.8926890 | 0.1856016 | 0.6701451 |
| CD8 T cells | -0.0198651 | 0.1297779 | 0.3950899 | 1.6714969 | 0.2217707 | 0.6701451 |
| plasmacytoid DCs | -0.0056202 | 0.0055107 | 0.0791936 | 1.4637702 | 0.2625753 | 0.6701451 |
| ionocytes | 0.0007057 | 0.0284909 | 0.0517758 | 1.4147059 | 0.2736107 | 0.6701451 |
| mesothelial cells | 0.0043385 | -0.0052527 | 0.0357439 | 1.0080158 | 0.3883600 | 0.6701451 |
| neutrophils | 0.0008549 | -0.0884807 | 0.1205195 | 0.9991736 | 0.3918576 | 0.6701451 |
| monocyte and neutrophil-like | 0.0081777 | -0.0699999 | 0.3273618 | 0.9425358 | 0.4119612 | 0.6701451 |
| monocytes | -0.0074533 | -0.0586614 | 0.0730773 | 0.7869357 | 0.4735021 | 0.6701451 |
| age | sexM | AveExpr | F | P.Value | adj.P.Val | |
|---|---|---|---|---|---|---|
| mast cells | 0.0040779 | -0.0023539 | 0.0228456 | 5.3363097 | 0.0192908 | 0.2893622 |
| B cells | -0.0062234 | -0.0062298 | 0.0643829 | 2.2769239 | 0.1401883 | 0.6266495 |
| macrophages | 0.0158633 | 0.0435442 | 0.1787851 | 2.0869250 | 0.1618952 | 0.6266495 |
| plasmacytoid DCs | -0.0010796 | 0.0018541 | 0.0079512 | 1.5407623 | 0.2489559 | 0.6266495 |
| CD8 T cells | -0.0125703 | 0.0839463 | 0.1710747 | 1.4176603 | 0.2758104 | 0.6266495 |
| neutrophils | 0.0006563 | -0.0351866 | 0.0279557 | 1.3343963 | 0.2955988 | 0.6266495 |
| mesothelial cells | 0.0005451 | 0.0007252 | 0.0025693 | 1.2702643 | 0.3116726 | 0.6266495 |
| monocytes | -0.0044430 | -0.0408158 | 0.0225210 | 1.1034170 | 0.3595967 | 0.6266495 |
| ionocytes | 0.0001560 | 0.0025292 | 0.0035135 | 0.9933136 | 0.3953788 | 0.6266495 |
| monocyte and neutrophil-like | 0.0050388 | -0.0367671 | 0.1126906 | 0.8308037 | 0.4565844 | 0.6266495 |
BAL
| age | sexM | AveExpr | F | P.Value | adj.P.Val | |
|---|---|---|---|---|---|---|
| macro-CCL | 0.0284364 | -0.1956226 | 0.1189898 | 8.227825 | 0.0040601 | 0.0547699 |
| cycling T cells | -0.0046891 | -0.0377098 | 0.0782002 | 7.026875 | 0.0073027 | 0.0547699 |
| basal epithelial cells | 0.0053279 | 0.0547655 | 0.0634272 | 6.223033 | 0.0111270 | 0.0556348 |
| secretory epithelial cells | 0.0082822 | 0.0872567 | 0.1600431 | 4.058494 | 0.0397134 | 0.1365328 |
| B cells | -0.0070608 | -0.0848273 | 0.1874117 | 3.616306 | 0.0530569 | 0.1365328 |
| CD4 T cells | 0.0117651 | -0.0751215 | 0.2069717 | 3.573132 | 0.0546131 | 0.1365328 |
| CD8 T cells | 0.0035335 | -0.0709605 | 0.2523926 | 3.062164 | 0.0775899 | 0.1662641 |
| unknown | 0.0066367 | -0.0779742 | 0.1387083 | 1.995790 | 0.1713692 | 0.3072872 |
| macro-proliferating | -0.0087665 | 0.0081691 | 0.1419812 | 1.903085 | 0.1843723 | 0.3072872 |
| plasma B cells | -0.0035736 | -0.0001937 | 0.0327661 | 1.473782 | 0.2612708 | 0.3919061 |
| age | sexM | AveExpr | F | P.Value | adj.P.Val | |
|---|---|---|---|---|---|---|
| cycling T cells | -0.0007932 | -0.0065097 | 0.0074173 | 7.862979 | 0.0052799 | 0.0547638 |
| macro-CCL | 0.0130786 | -0.0892528 | 0.0335833 | 7.184407 | 0.0073018 | 0.0547638 |
| secretory epithelial cells | 0.0044322 | 0.0336076 | 0.0341704 | 5.692053 | 0.0157986 | 0.0669654 |
| basal epithelial cells | 0.0015079 | 0.0073824 | 0.0067140 | 5.470208 | 0.0178574 | 0.0669654 |
| B cells | -0.0035809 | -0.0354194 | 0.0427189 | 3.427660 | 0.0619486 | 0.1858459 |
| CD8 T cells | 0.0013578 | -0.0334899 | 0.0652950 | 2.642141 | 0.1068786 | 0.2553534 |
| CD4 T cells | 0.0051477 | -0.0245968 | 0.0469998 | 2.492730 | 0.1191649 | 0.2553534 |
| unknown | 0.0010737 | -0.0251501 | 0.0248860 | 1.668217 | 0.2245401 | 0.4210128 |
| macro-lipid | -0.0322758 | 0.1594412 | 0.2734180 | 1.379164 | 0.2846821 | 0.4744701 |
| macro-proliferating | -0.0020999 | 0.0018987 | 0.0232386 | 1.228027 | 0.3230471 | 0.4845706 |
Age modelling with updated cell-labels
#rm(merged_list)
gc()
used (Mb) gc trigger (Mb) limit (Mb) max used (Mb)Ncells 10720940 572.6 18111504 967.3 NA 18111504 967.3 Vcells 3401094522 25948.3 4906635422 37434.7 143360 3441797318 26258.9
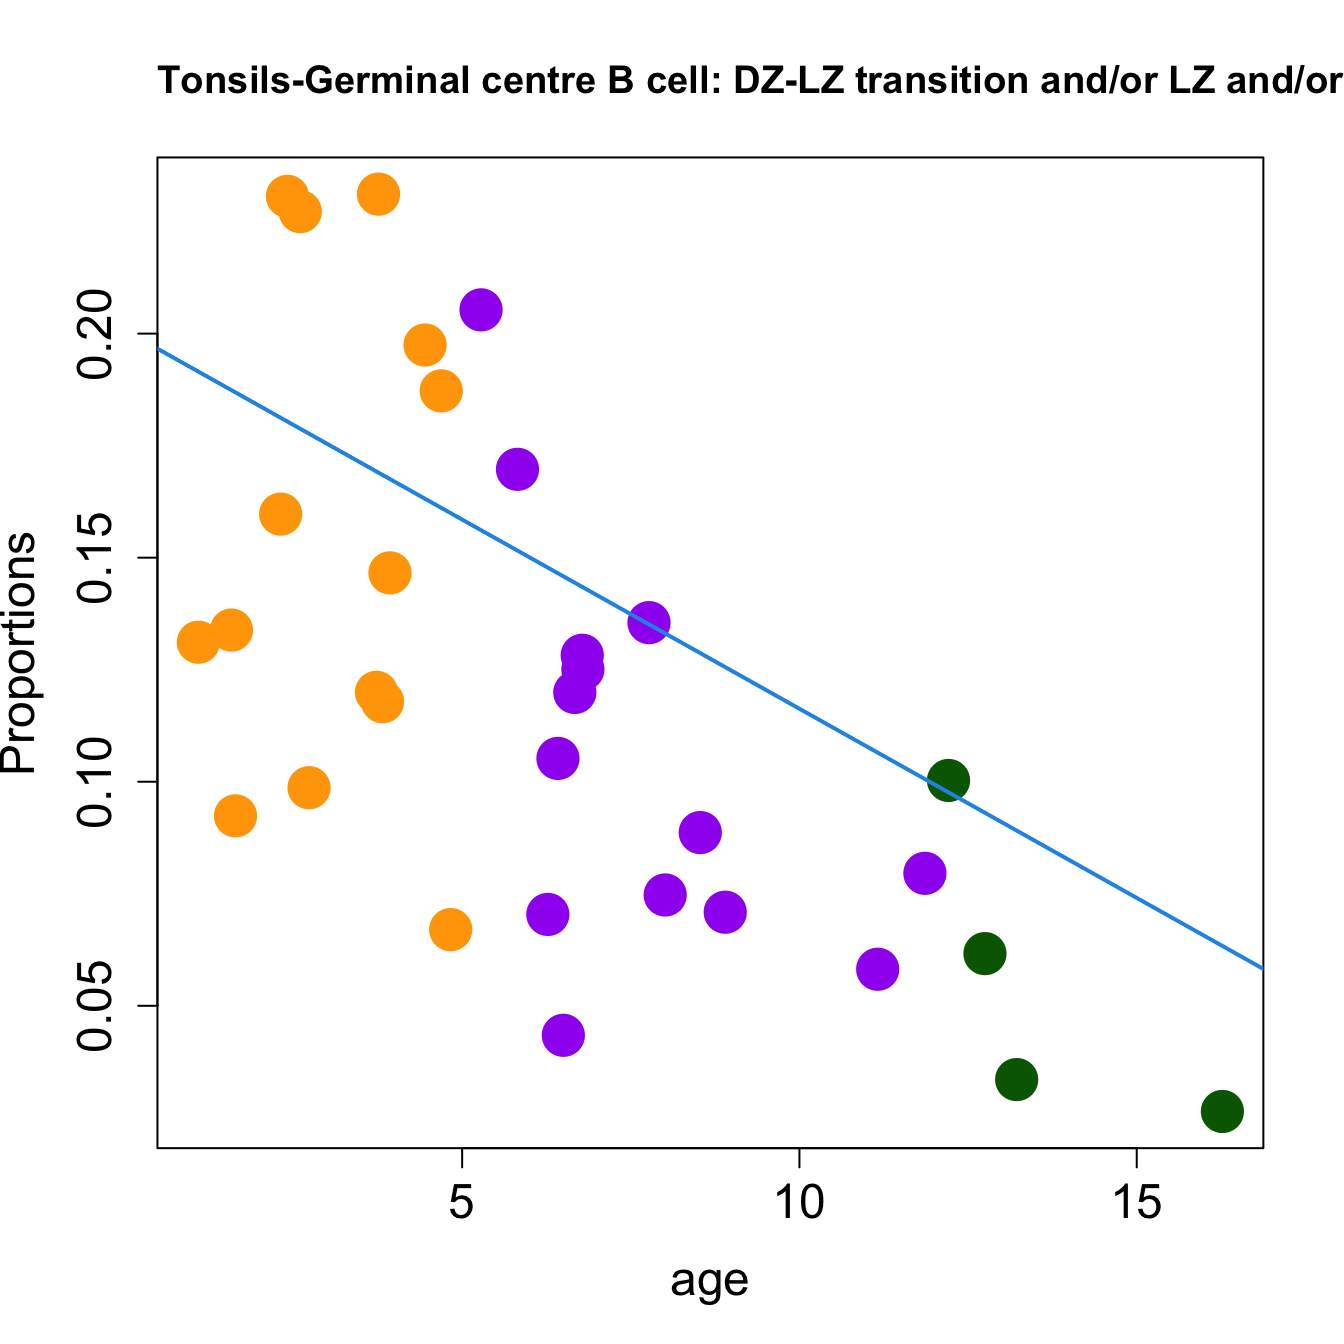
get_age_group_color <- function(age) {
if (age >= 1 && age <= 5) {
return("orange") # Preschool (1-5 years)
} else if (age > 5 && age <= 12) {
return("purple") # Kids (6-11 years)
} else if (age > 12 && age <= 17) {
return("darkgreen") # Adolescent (12-17 years)
} else {
return("black") # Default color for other cases
}
}
for (tissue_name in c("Adenoids", "Tonsils","Nasal_brushings")) {
tissue_obj <- seurat_objects[[tissue_name]]
props <- getTransformedProps(clusters = tissue_obj$cell_labels,
sample = tissue_obj$Sample, transform = "asin")
tissue_obj@meta.data <- tissue_obj@meta.data %>%
mutate(age_group = case_when(
age_years >= 1 & age_years < 6 ~ "Preschool_1to5_years",
age_years >= 6 & age_years < 12 ~ "Kids_6to11_years",
age_years >= 12 ~ "Adolescent_12to17_years",
TRUE ~ "Other"
))
samples_metadata <- tissue_obj@meta.data %>%
dplyr::filter(Sample %in% unique(tissue_obj@meta.data$Sample)) %>%
dplyr::group_by(Sample) %>%
dplyr::summarise(
age = dplyr::first(age_years),
sex = dplyr::first(sex),
batch = dplyr::first(batch_name),
age_group = dplyr::first(age_group),
.groups = 'drop'
)
age <- samples_metadata$age
sex <- as.factor(samples_metadata$sex)
batch <- as.factor(samples_metadata$batch)
design <- model.matrix(~age + sex + batch)
design
fit <- lmFit(props$TransformedProps, design)
fit <- eBayes(fit, robust=TRUE)
toptable.transformedProps <- topTable(fit)
fit.prop <- lmFit(props$Proportions, design)
fit.prop <- eBayes(fit.prop, robust=TRUE)
toptable.props <- topTable(fit.prop, sort.by = "F")
age_group_colors <- sapply(age, get_age_group_color)
# Add tabset for each tissue
cat(paste0("### ", tissue_name, " {.tabset}\n\n"))
sorted_indices <- match(rownames(toptable.transformedProps), rownames(props$Proportions))
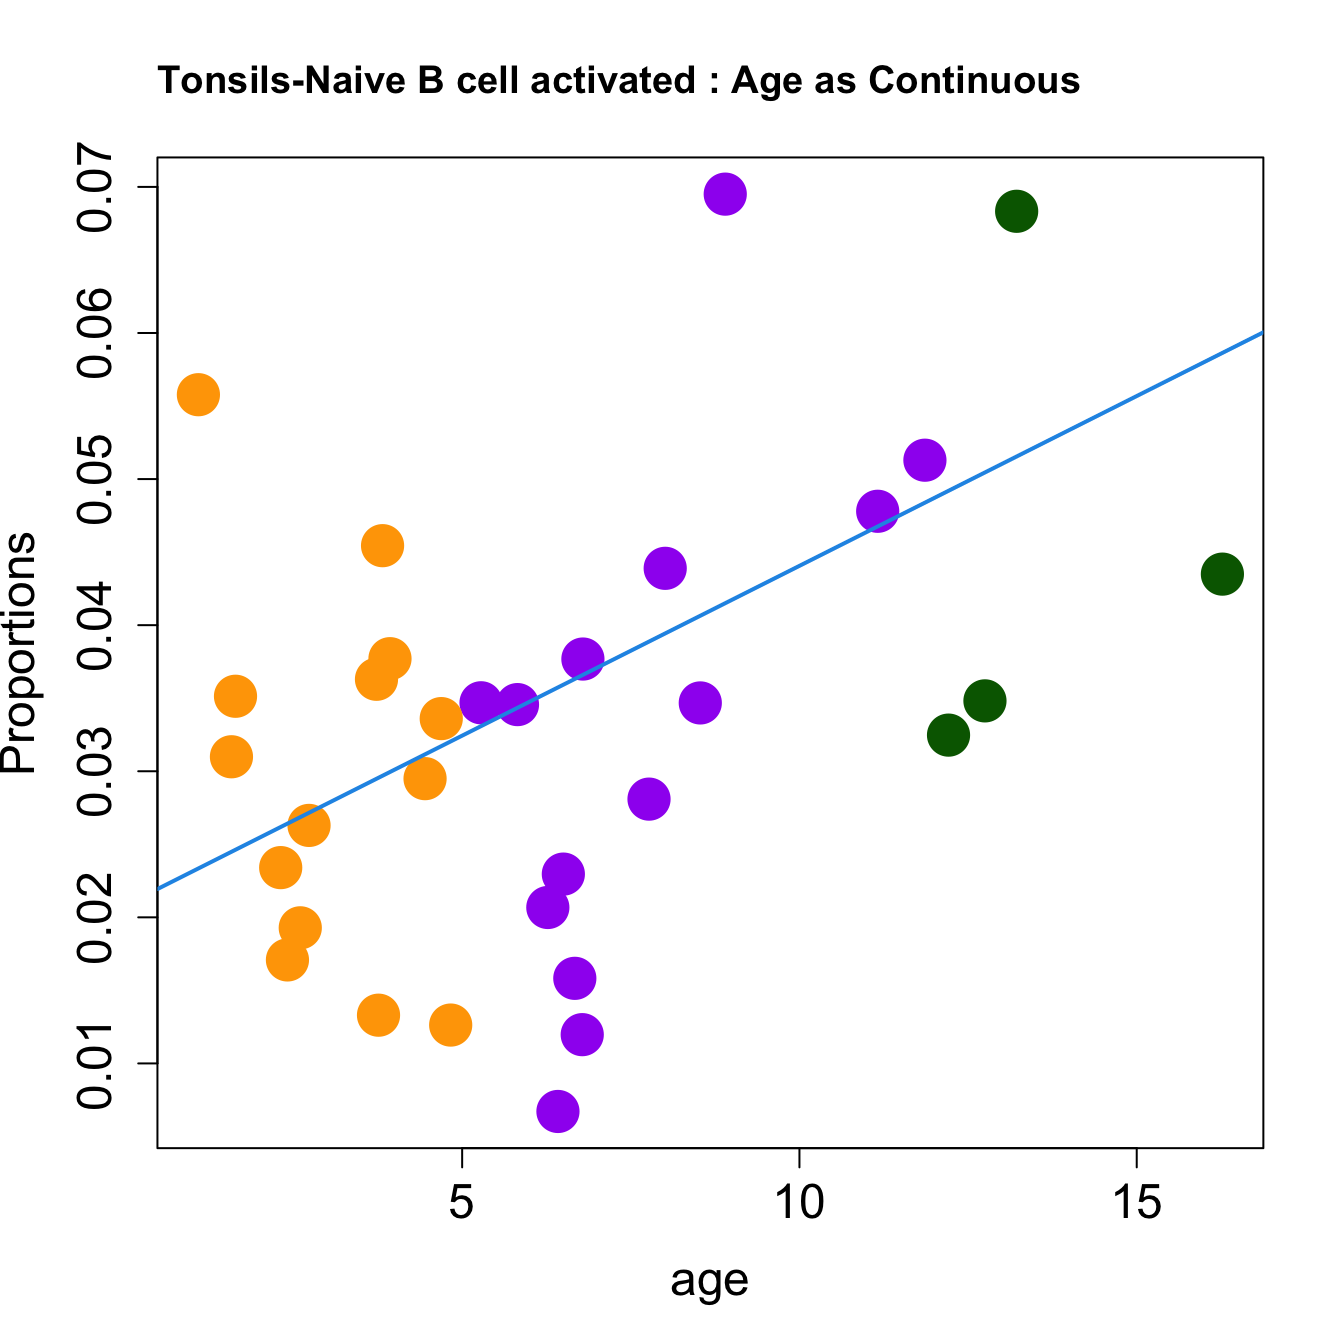
# Plot Age as Continuous
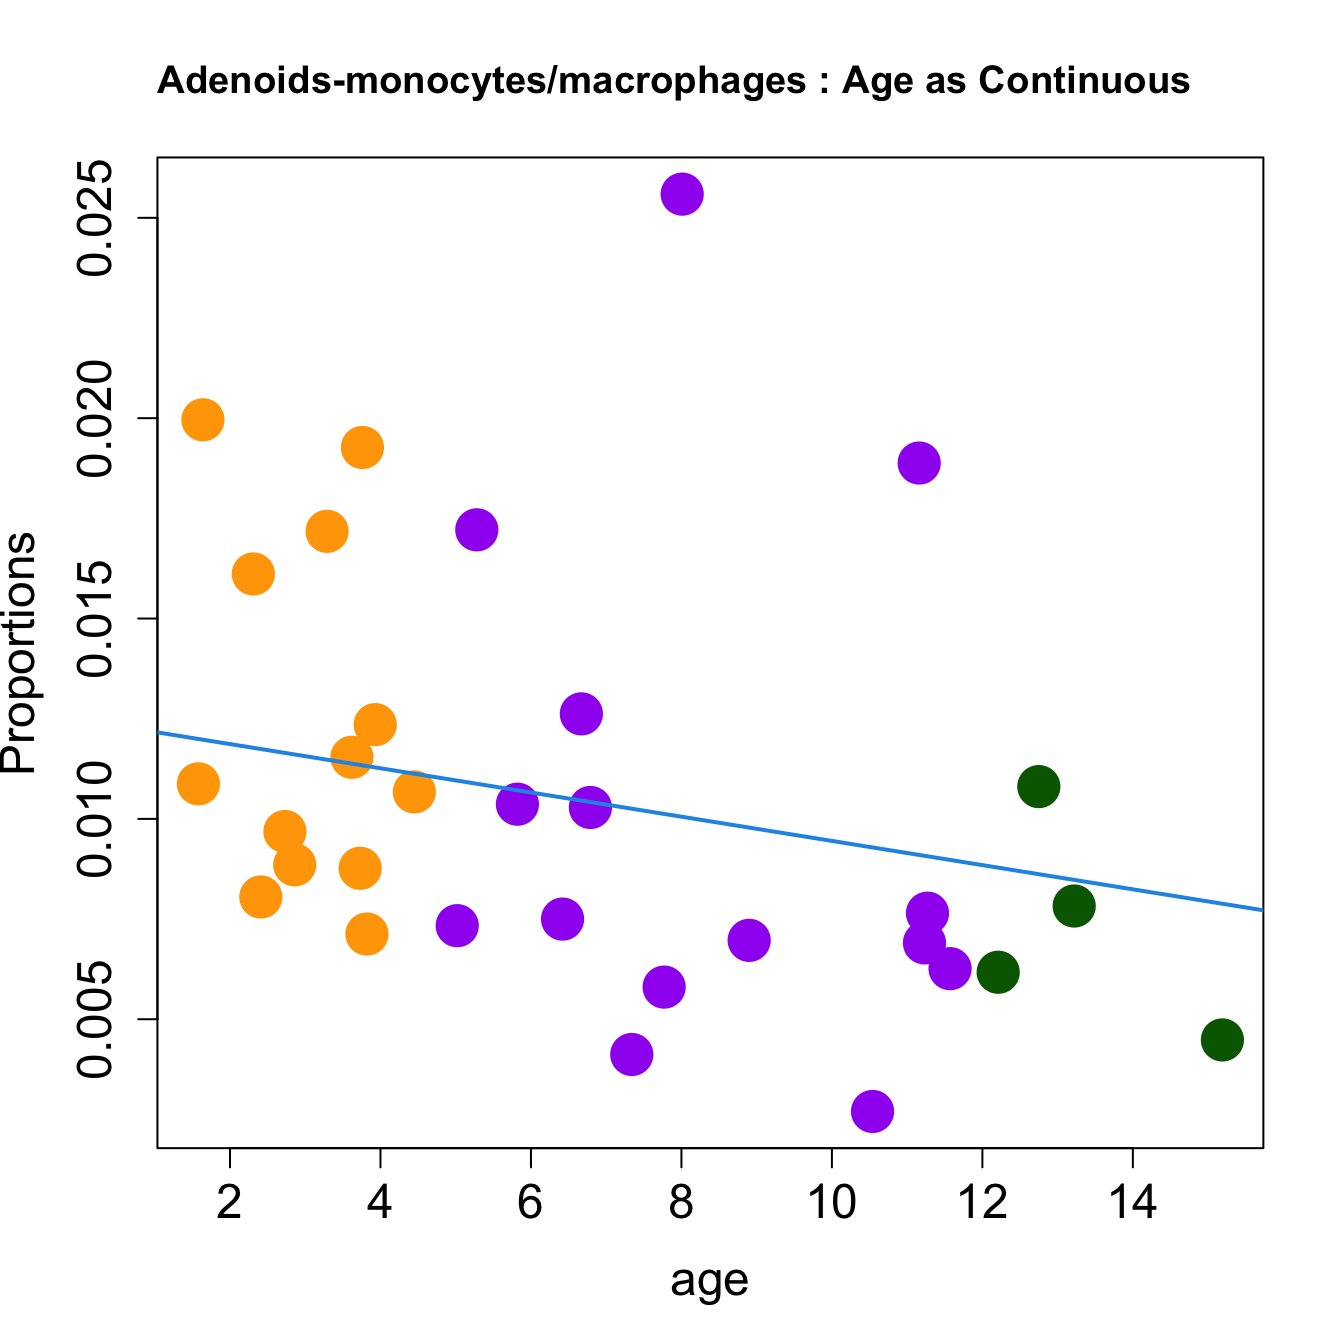
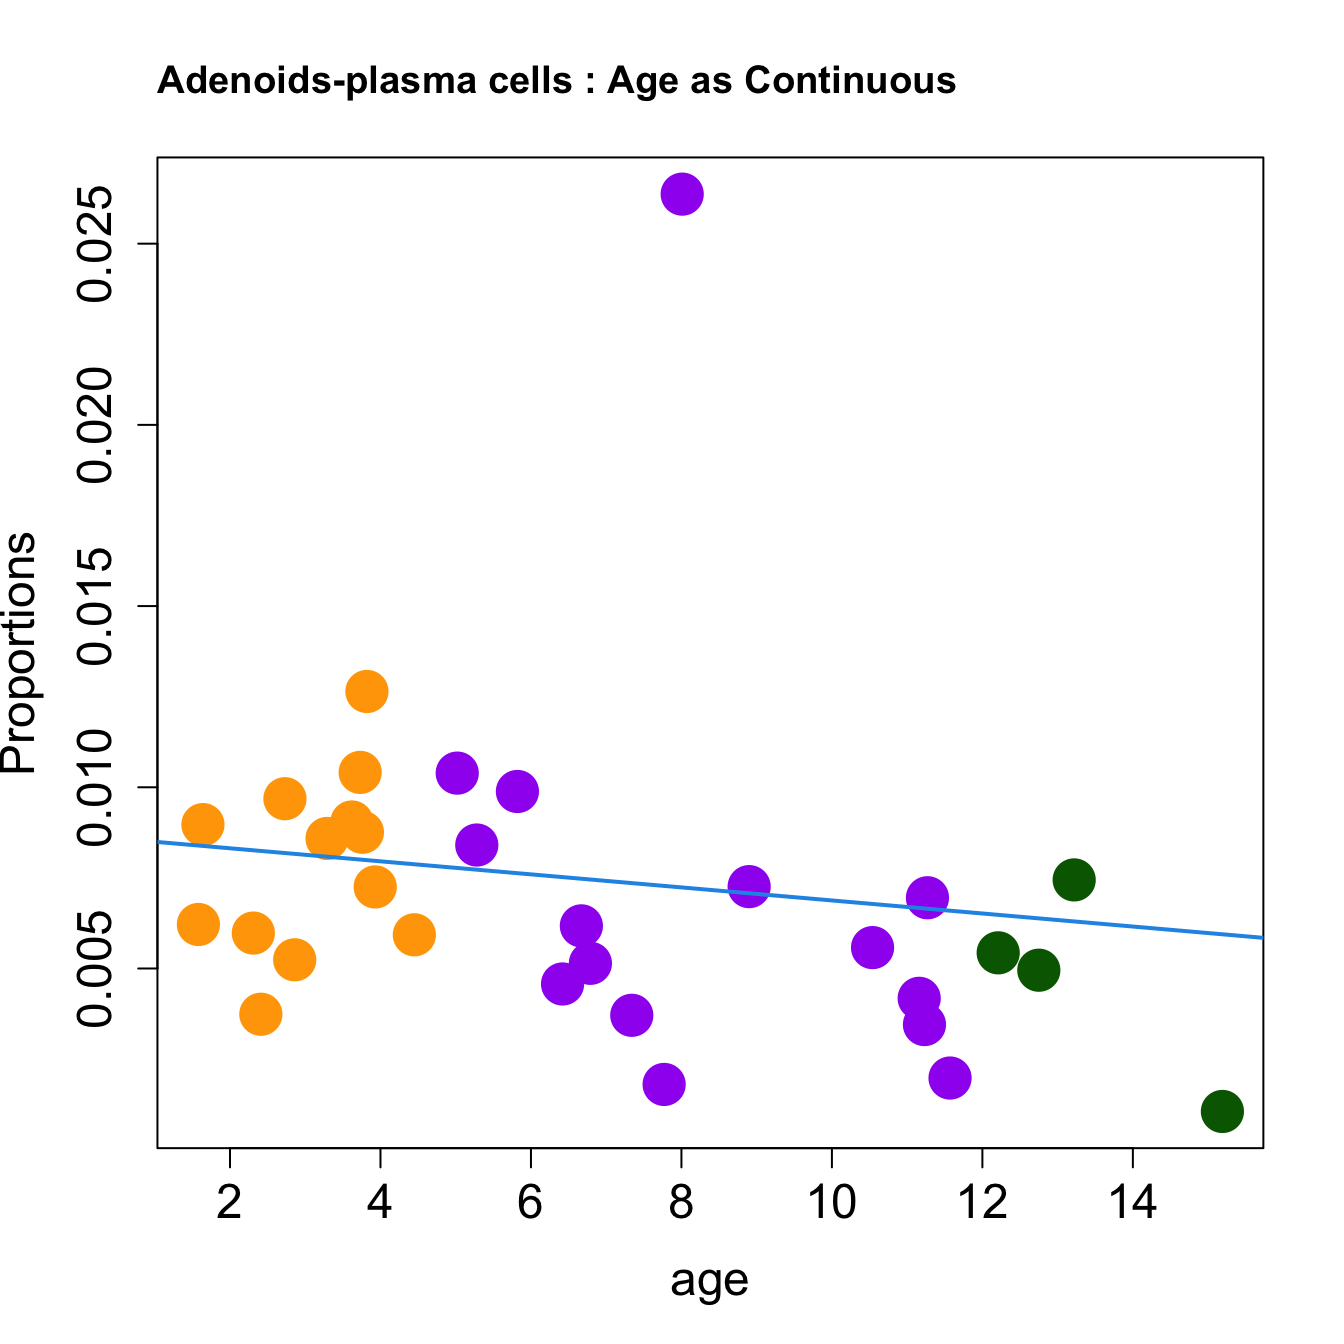
cat(paste0("#### Age as Continuous","\n", sep = ""))
#pdf(file = here("output/plots/", paste0(tissue_name, "_proportions_Age.pdf")), width = 15)
par(mfrow=c(1,1))
for (i in sorted_indices) {
plot(age, props$Proportions[i,],
pch=16, cex=3, ylab="Proportions", cex.lab=1.5, cex.axis=1.5,
cex.main=2, col=age_group_colors)
abline(a=fit.prop$coefficients[i, 1], b=fit.prop$coefficients[i, 2], col=4,
lwd=2)
title(paste0(tissue_name, "-", rownames(props$Proportions)[i], " : Age as Continuous"), cex.main = 1.2, adj = 0)
}
#dev.off()
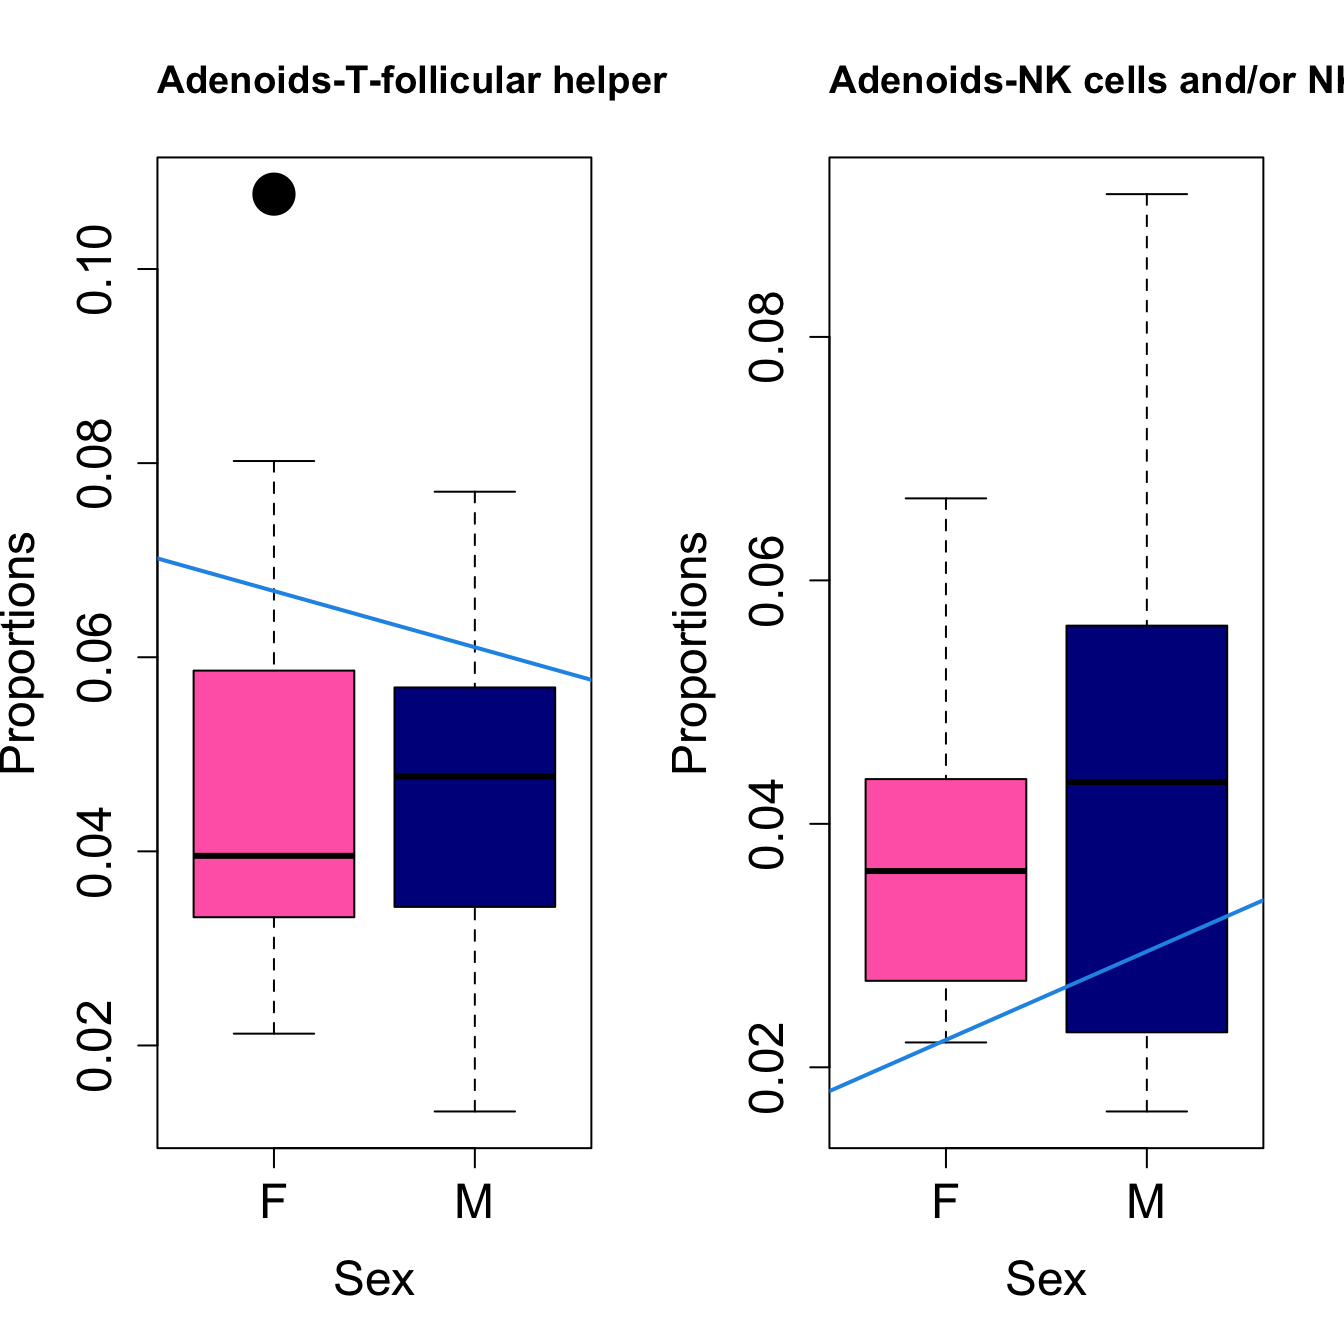
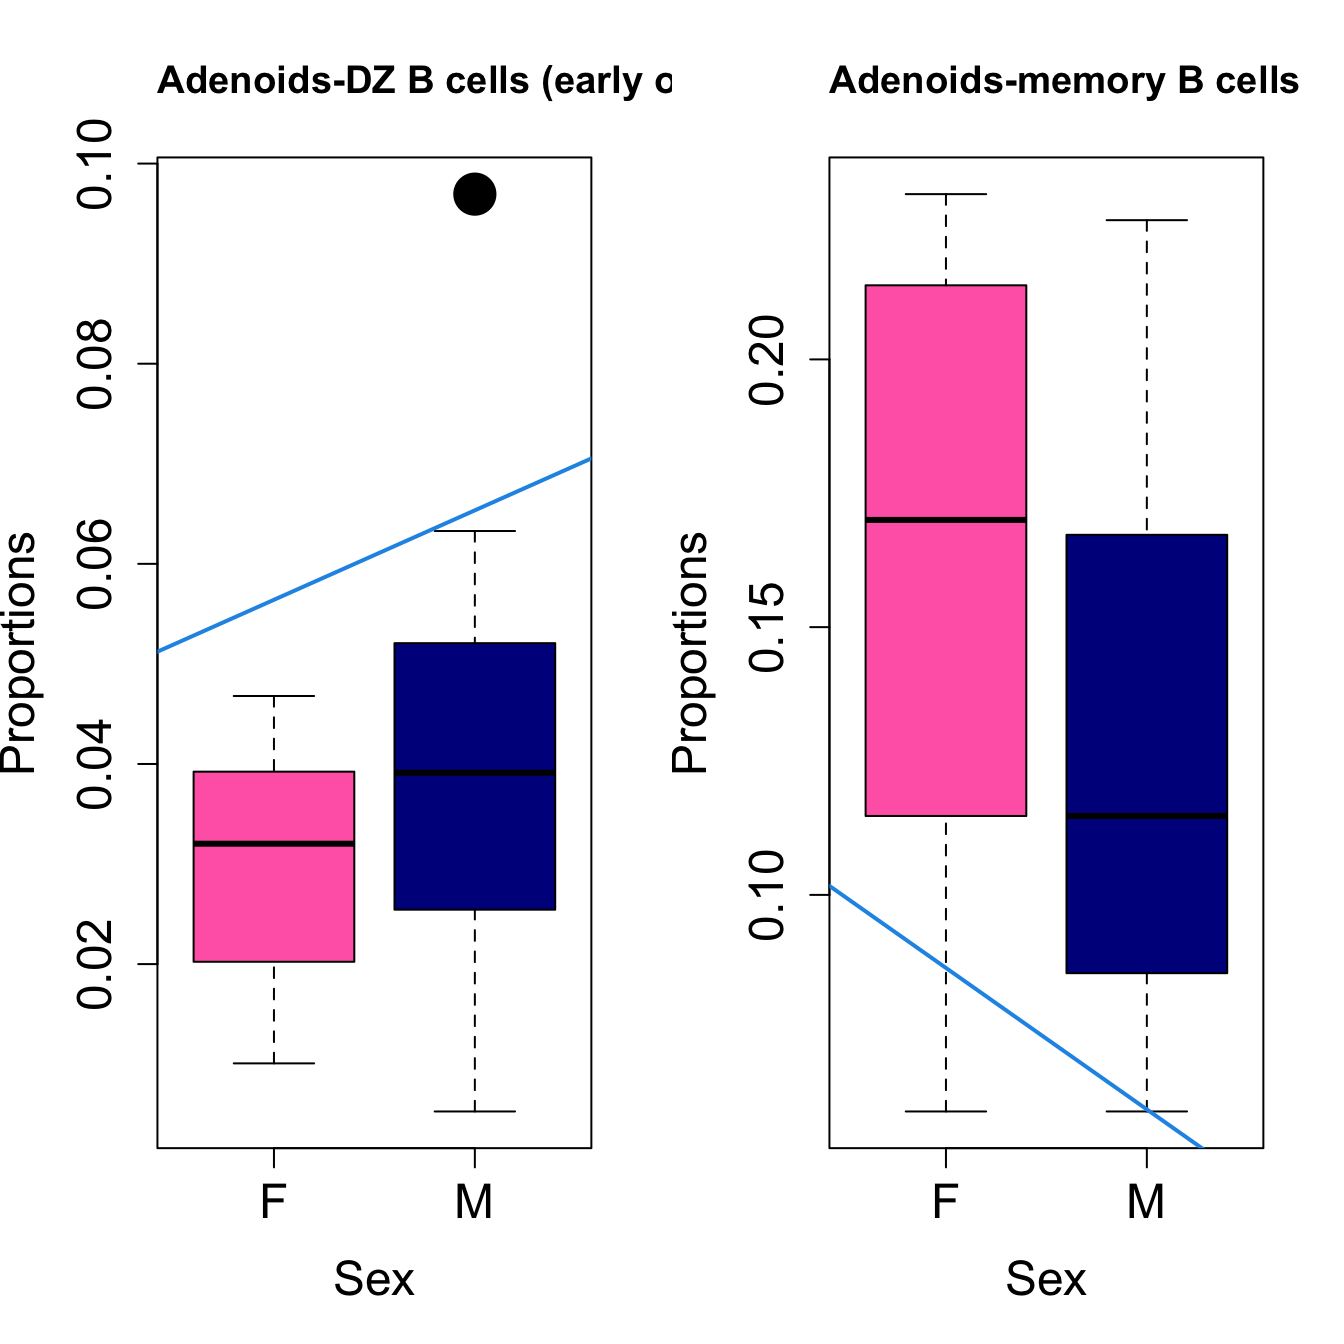
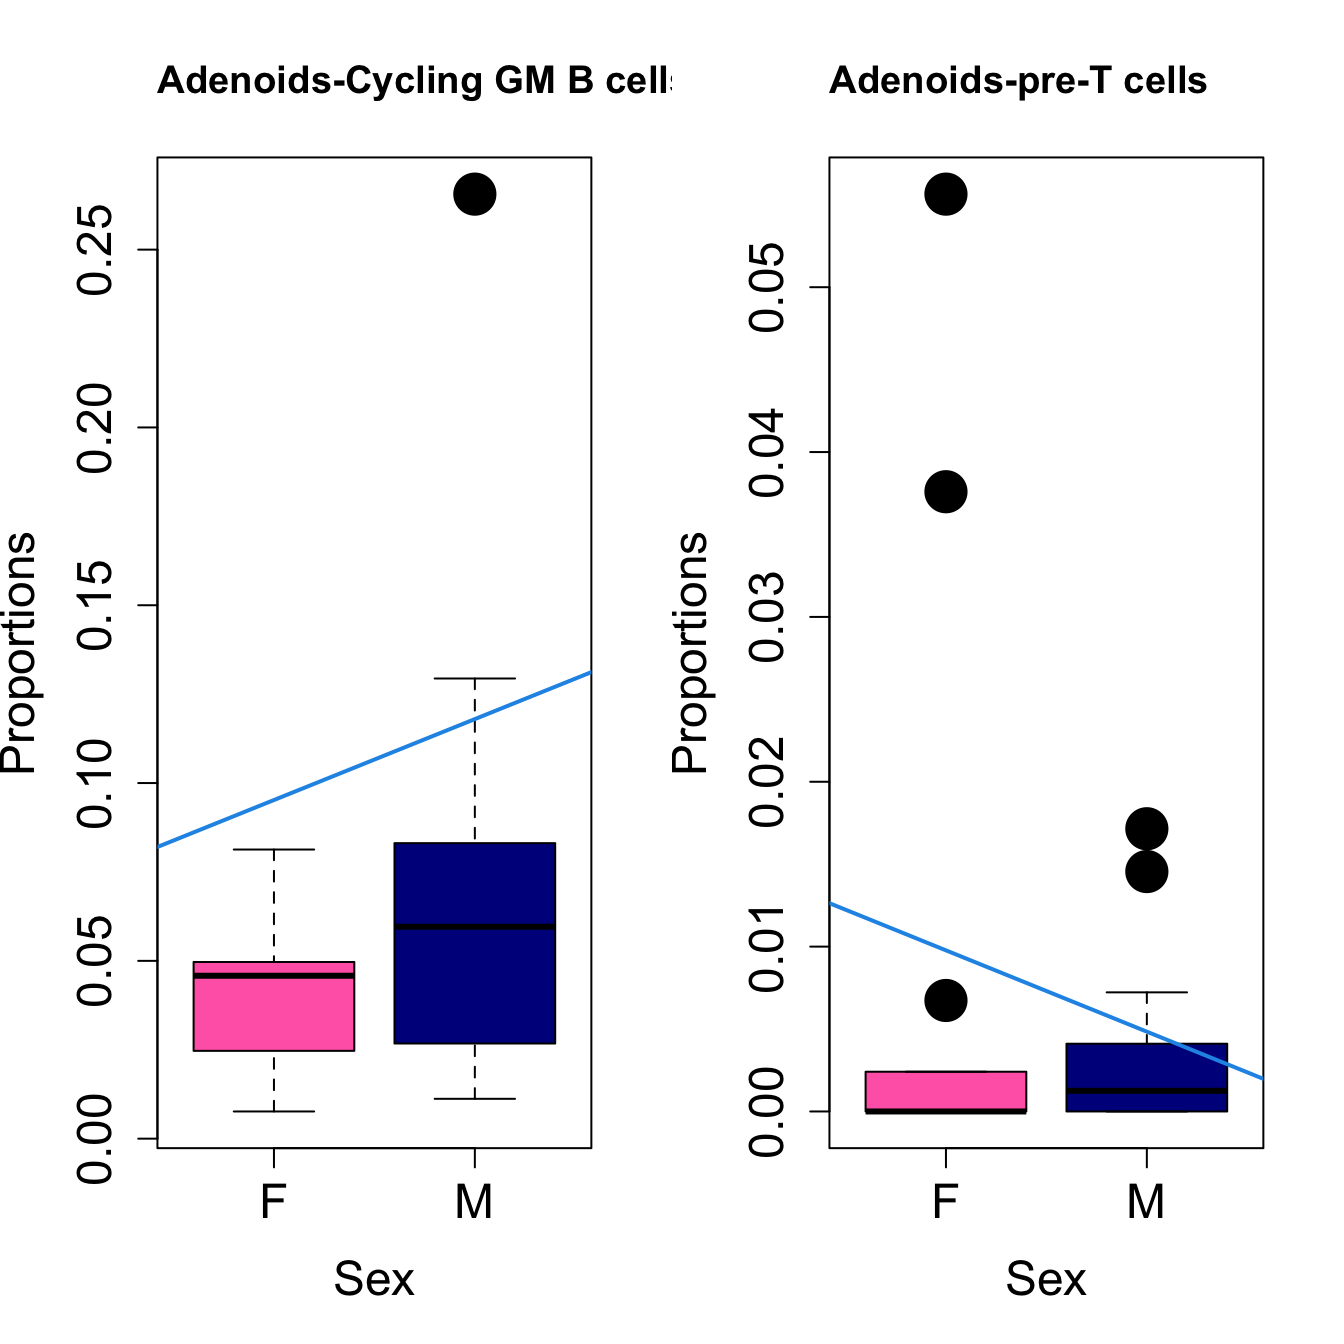
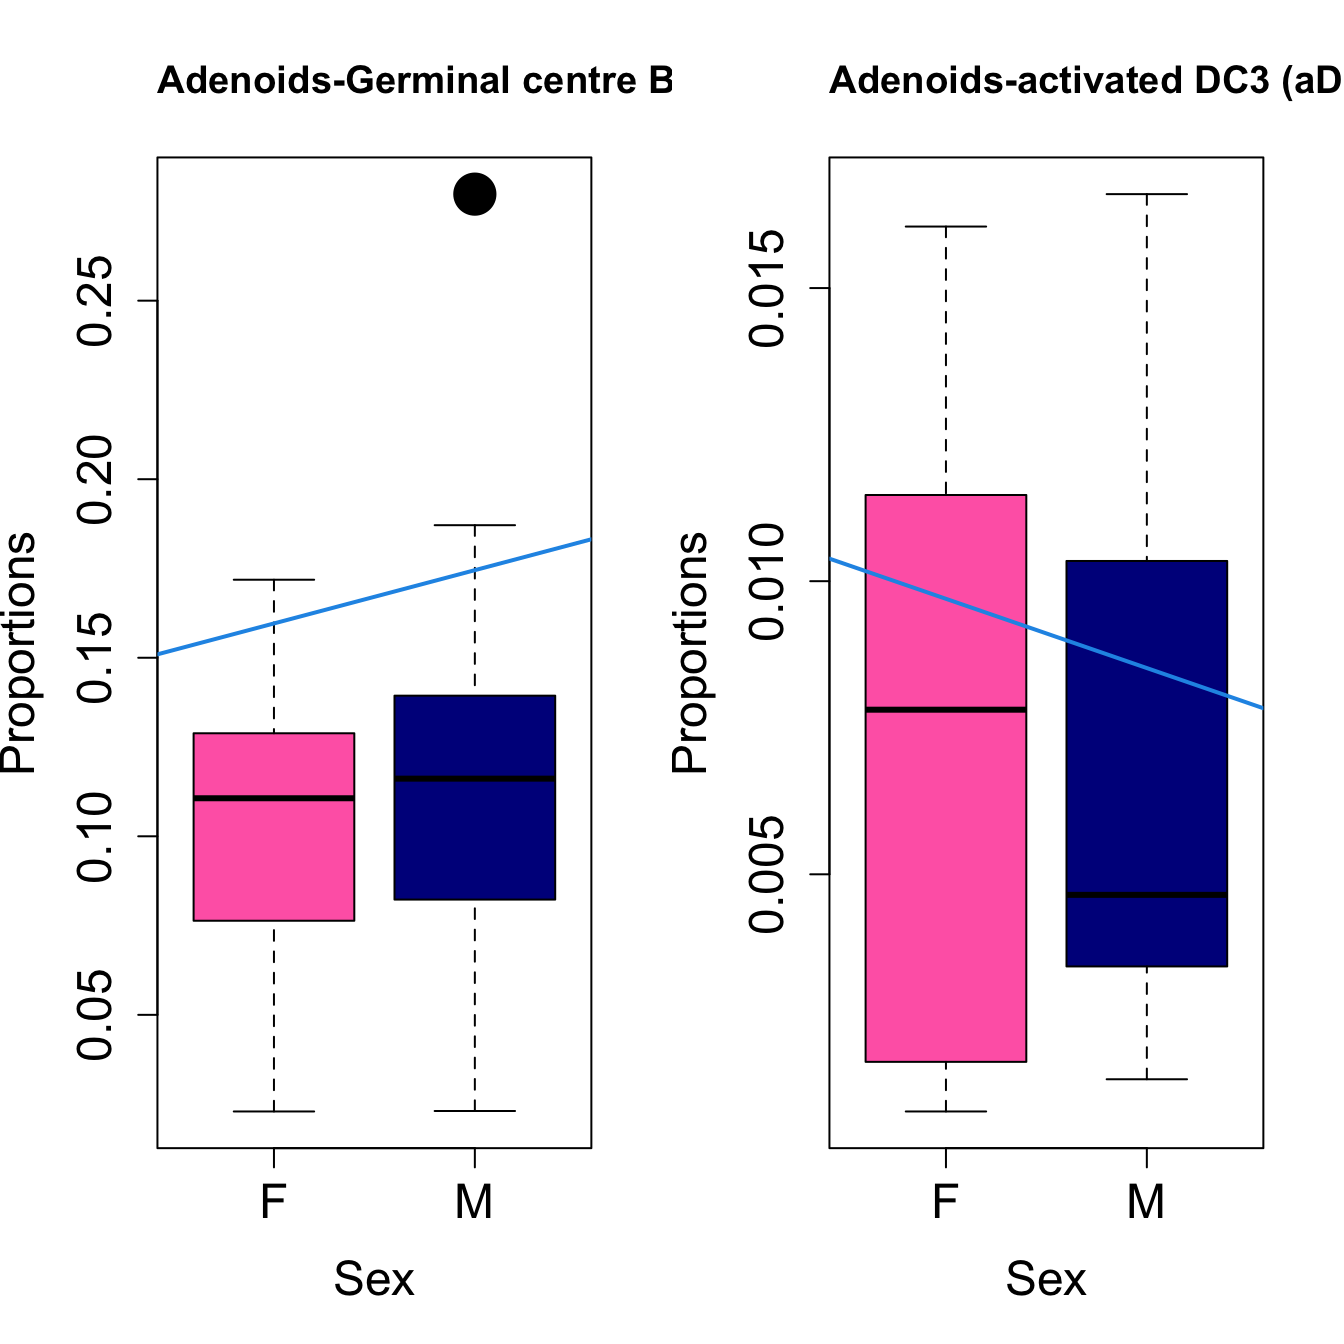
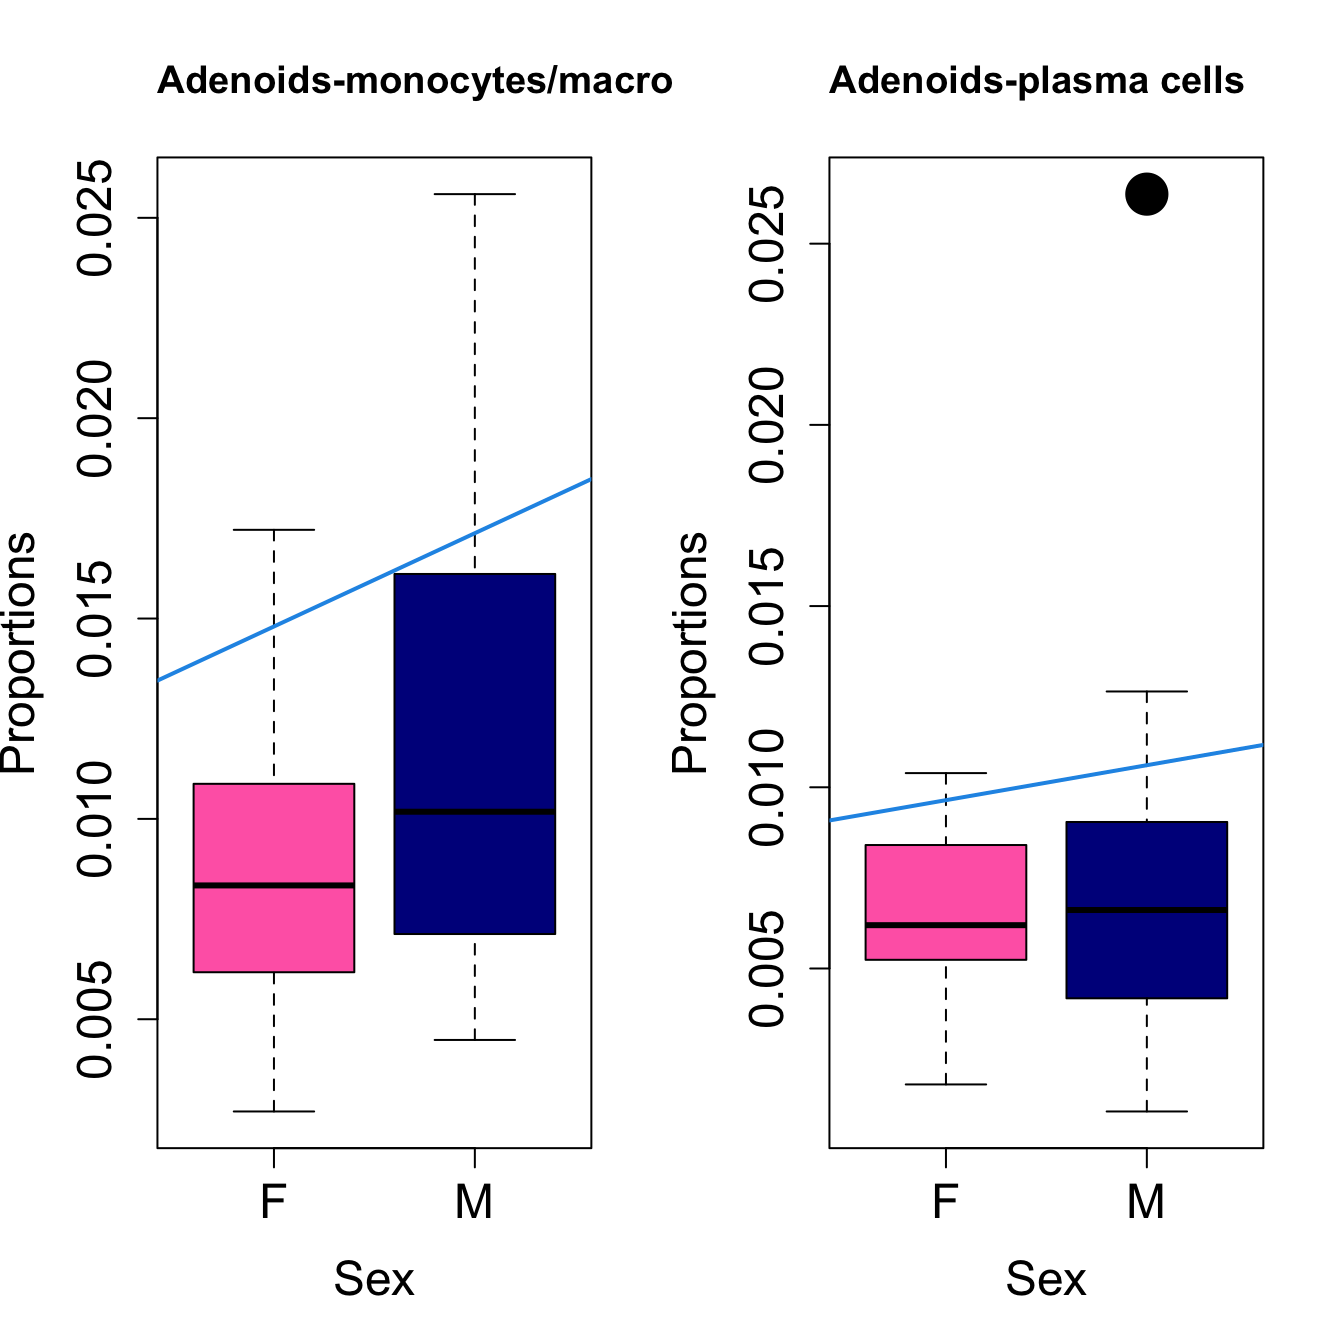
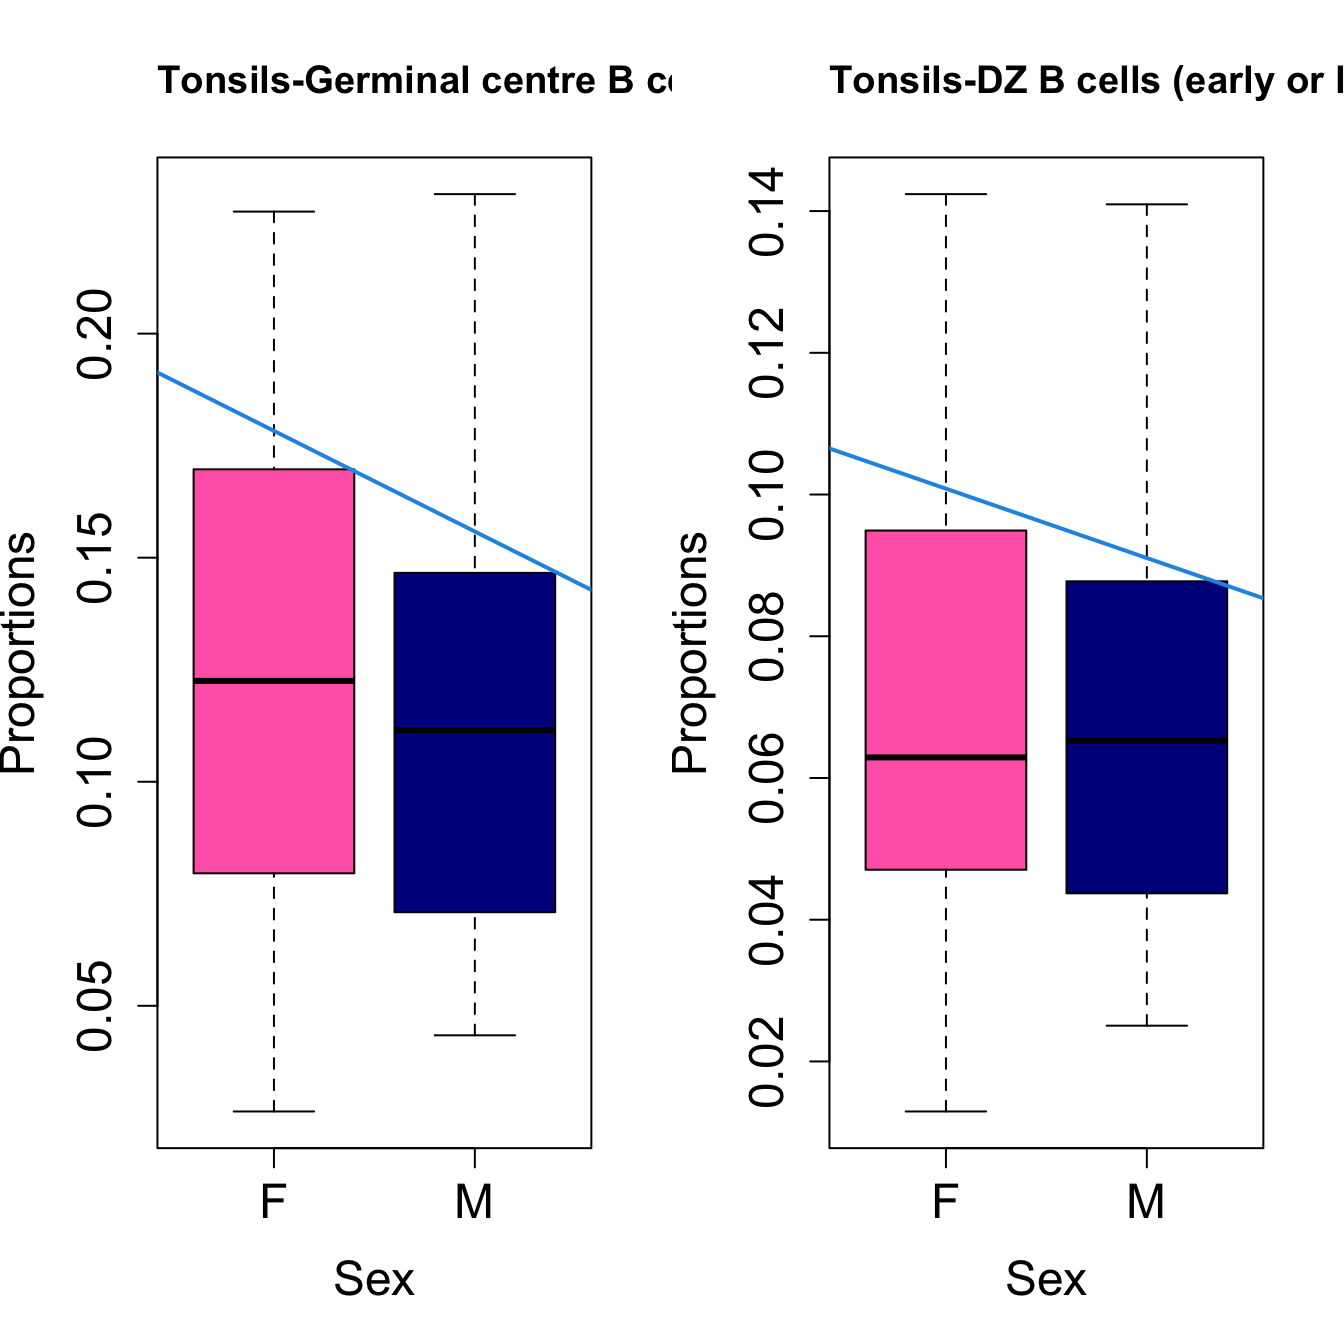
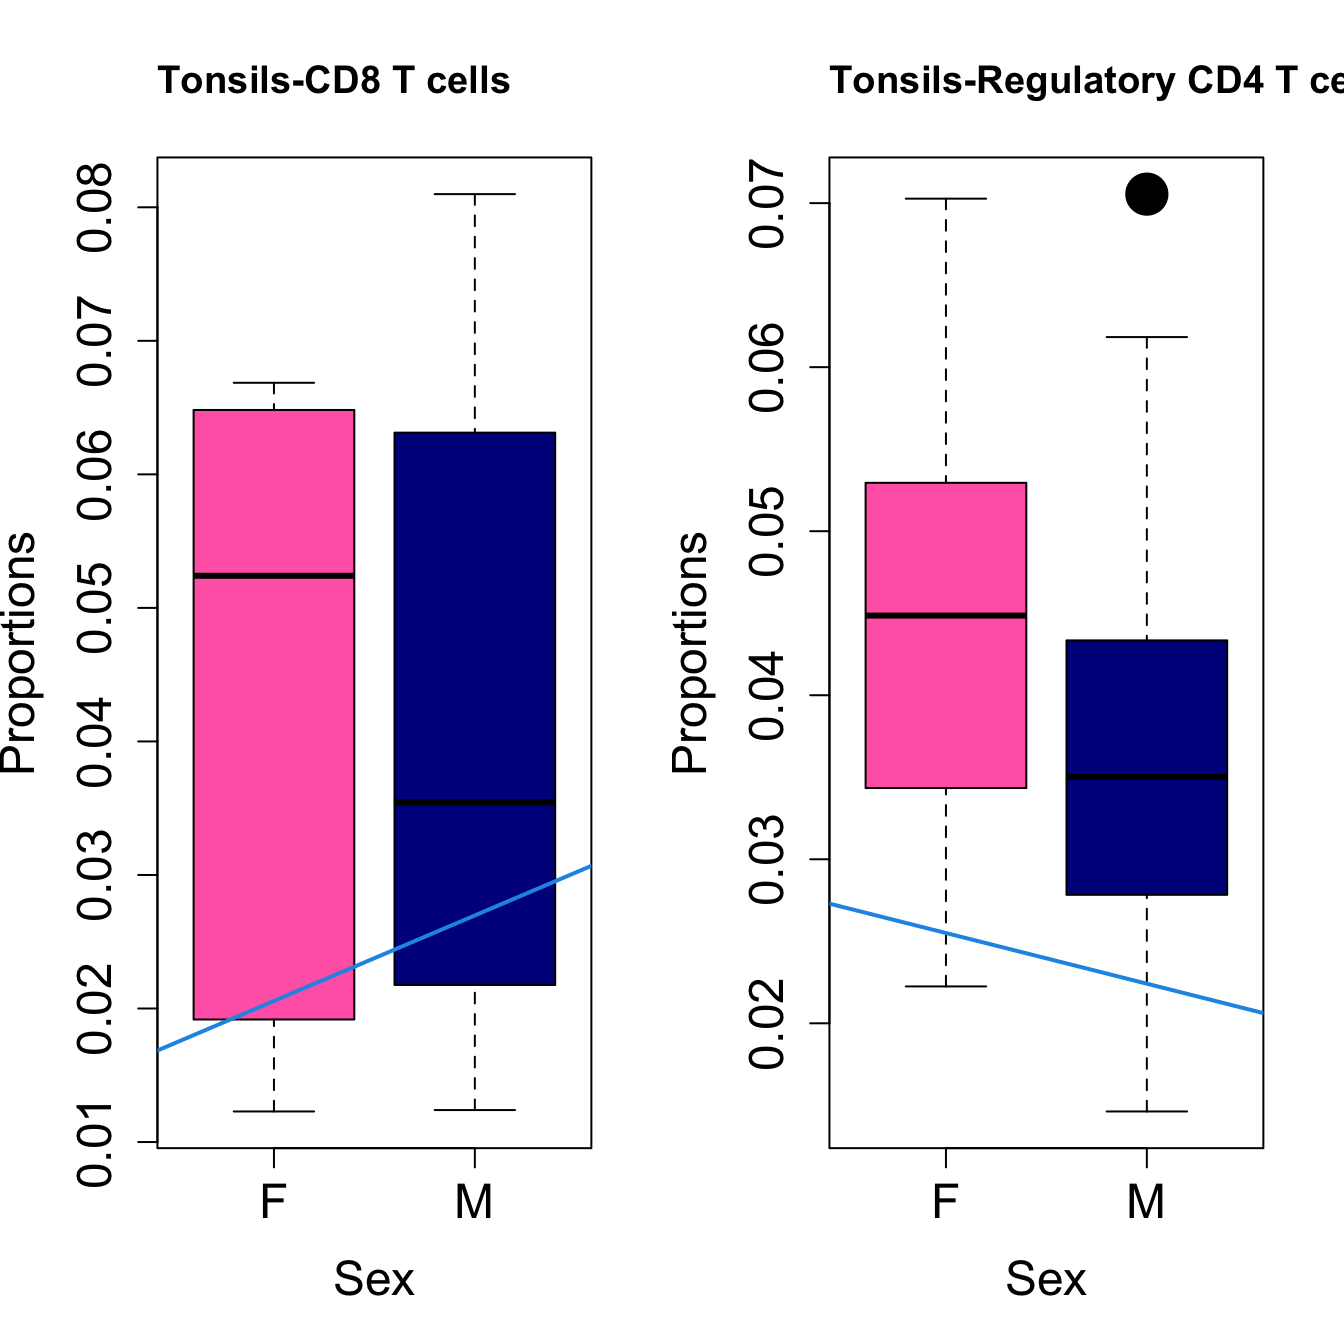
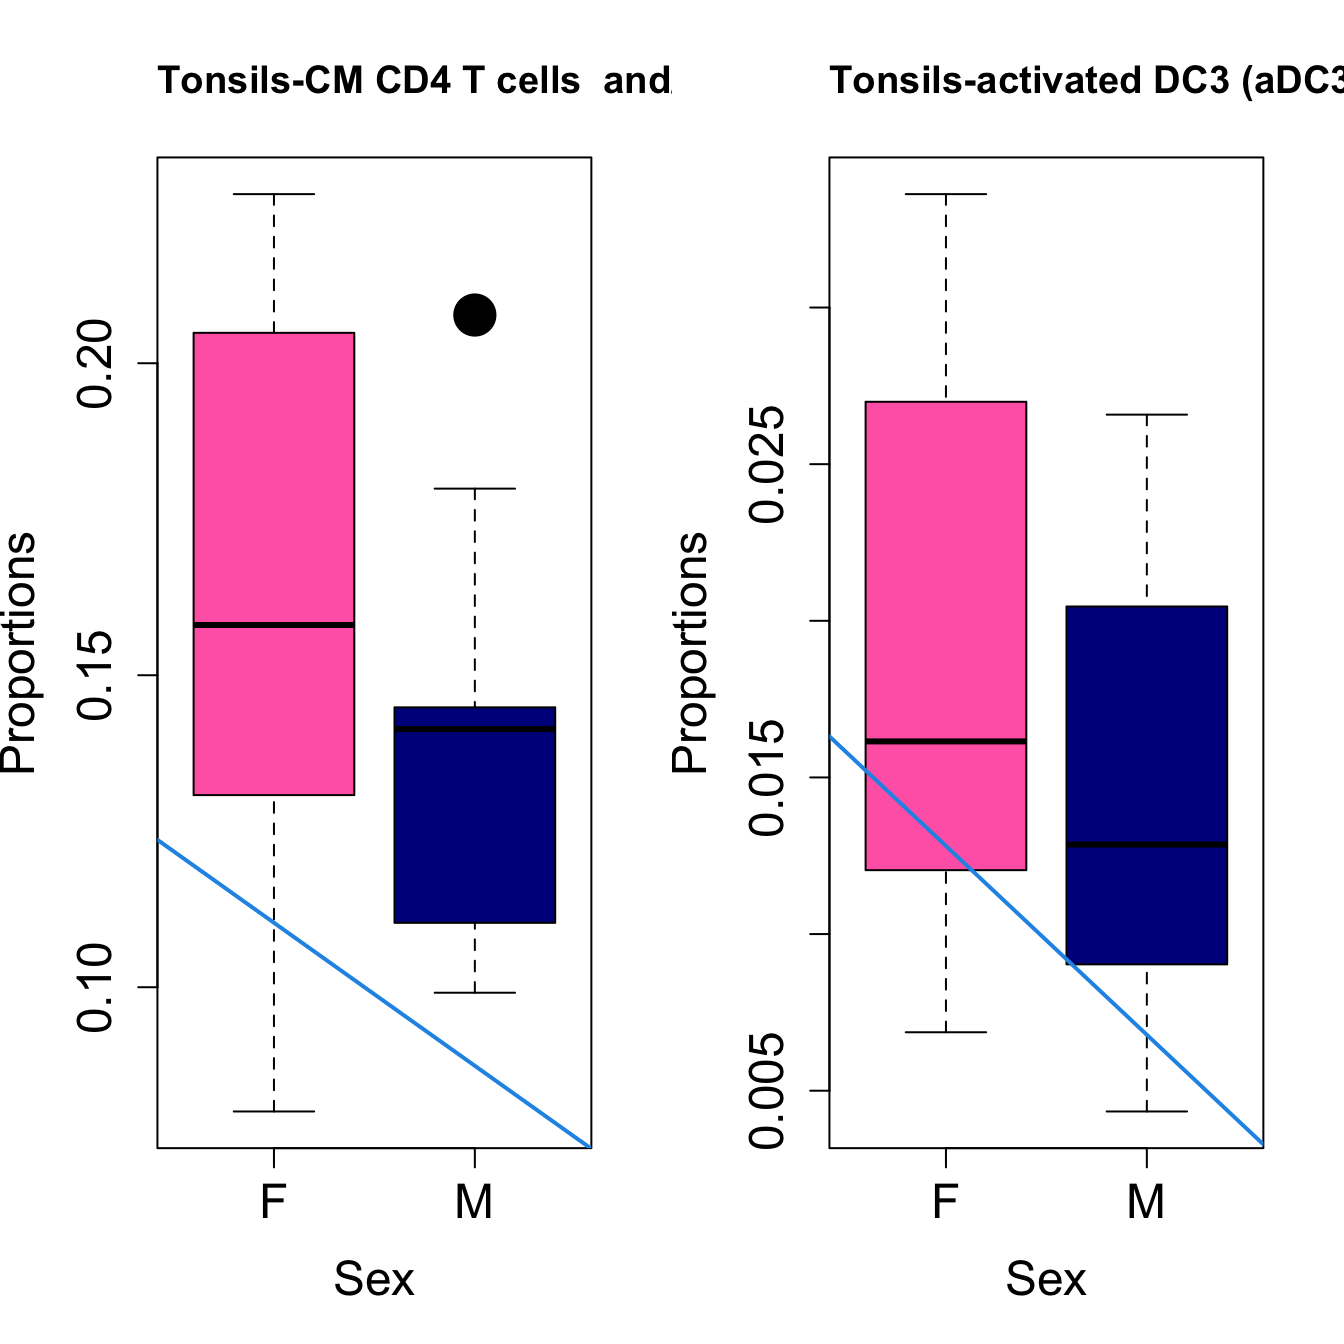
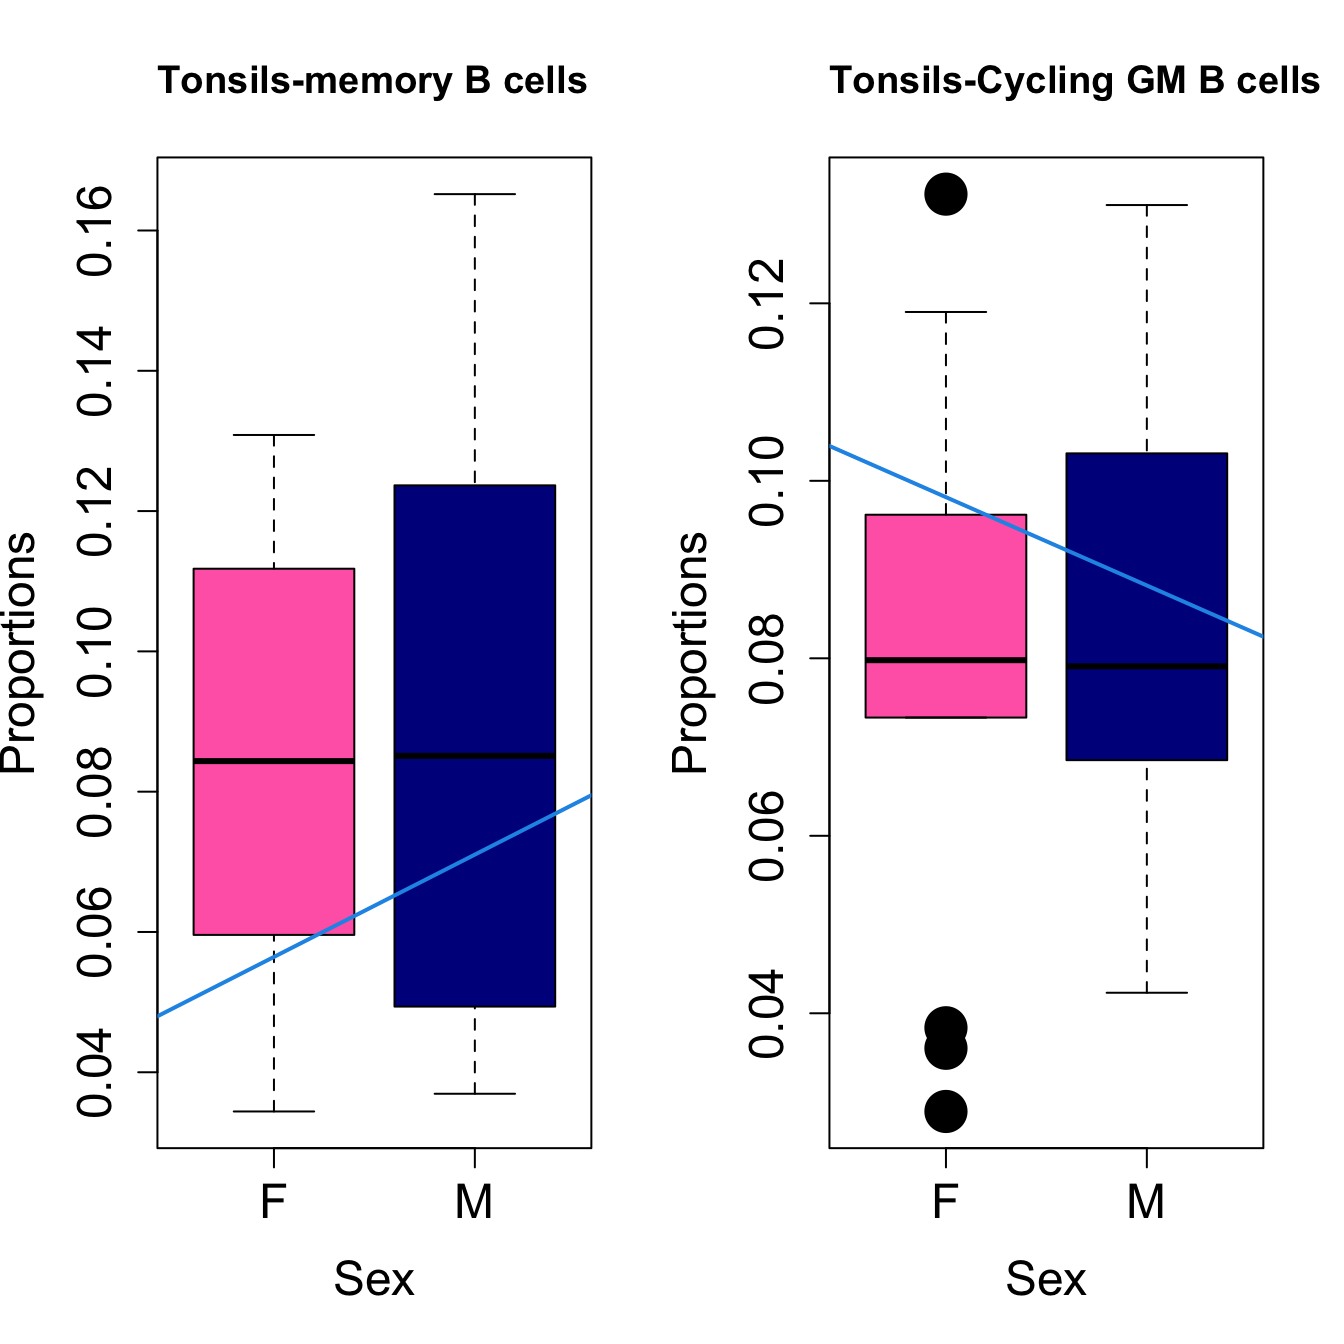
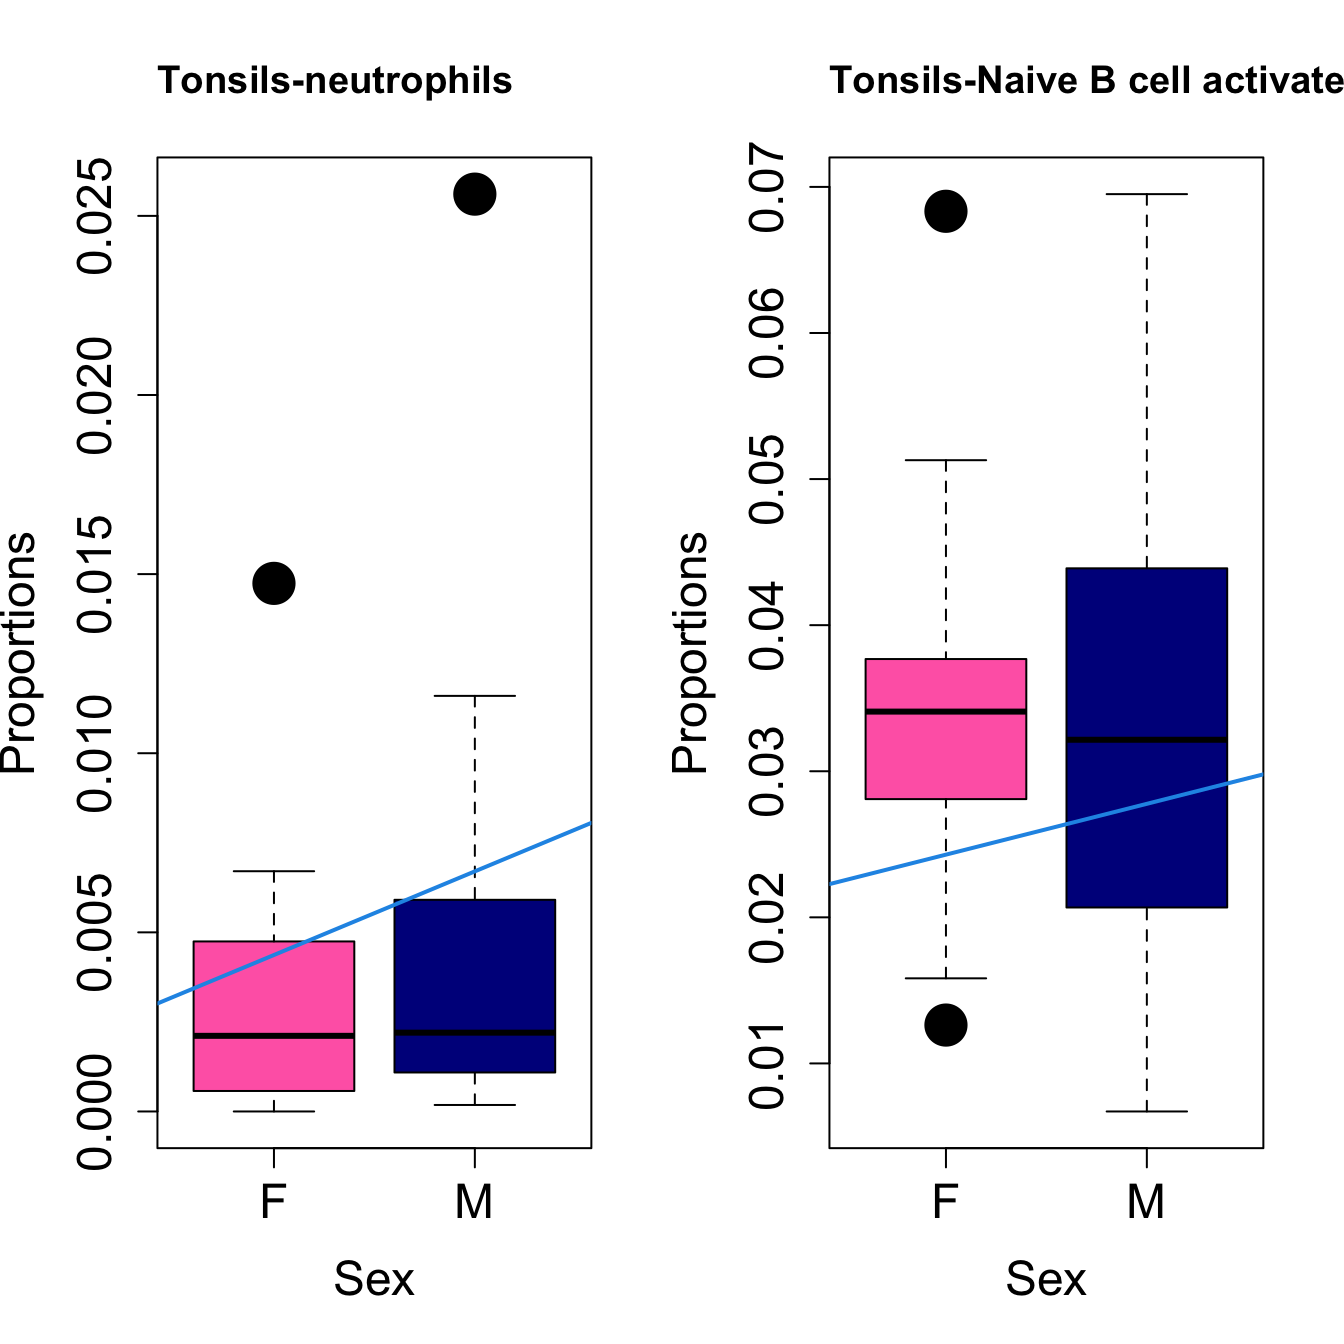
# Plot Sex
cat(paste0("#### Sex"," {.tabset}\n\n"))
#pdf(file = here("output/plots/", paste0(tissue_name, "_proportions_Sex.pdf")), width = 15)
par(mfrow=c(1,2))
for (i in sorted_indices) {
plot(sex, props$Proportions[i,],
pch=16, cex=3, ylab="Proportions", xlab="Sex", cex.lab=1.5, cex.axis=1.5,
cex.main=2, col=c("hotpink", "darkblue"))
abline(a=fit.prop$coefficients[i, 1], b=fit.prop$coefficients[i, 3], col=4,
lwd=2)
title(paste0(tissue_name, "-", rownames(props$Proportions)[i]), cex.main = 1.2, adj = 0)
}
#dev.off()
# Print the tables
cat(paste0("#### Transformed proportions Toptable results: ", tissue_name, "\n", sep = ""))
print(knitr::kable(toptable.transformedProps, caption = paste0("Transformed proportions Toptable results: ", tissue_name)))
cat(paste0("#### Proportions Toptable results: ", tissue_name, "\n", sep = ""))
print(knitr::kable(toptable.props, caption = paste0("Proportions Toptable results: ", tissue_name)))
}Adenoids
Age as Continuous
 ####
Sex {.tabset}
####
Sex {.tabset}
 ####
Transformed proportions Toptable results: Adenoids
####
Transformed proportions Toptable results: Adenoids
| age | sexM | batchG000231_batch8 | AveExpr | F | P.Value | adj.P.Val | |
|---|---|---|---|---|---|---|---|
| T-follicular helper and/or T-follicular memory and/or CD4 Treg | -0.0117037 | -0.0120926 | 0.0517669 | 0.2141541 | 17.985088 | 0.0000007 | 0.0000154 |
| NK cells and/or NK- T cells and/or gamma delta T cells | 0.0080113 | 0.0150085 | -0.0007604 | 0.1987685 | 9.471398 | 0.0001451 | 0.0015960 |
| DZ B cells (early or late phase) | -0.0067509 | 0.0203084 | -0.0027247 | 0.1855346 | 5.843507 | 0.0028550 | 0.0170125 |
| memory B cells | 0.0142844 | -0.0360757 | -0.0601674 | 0.3792752 | 5.771221 | 0.0030932 | 0.0170125 |
| Cycling GM B cells | -0.0118589 | 0.0406248 | 0.0047769 | 0.2228255 | 5.033119 | 0.0061036 | 0.0268557 |
| pre-T cells | -0.0089586 | -0.0108462 | 0.0118156 | 0.0413268 | 3.953251 | 0.0173828 | 0.0637369 |
| Germinal centre B cell: DZ-LZ transition and/or LZ and/or LZ-DZ | -0.0112149 | 0.0200866 | 0.0137227 | 0.3355456 | 3.483934 | 0.0279487 | 0.0878388 |
| activated DC3 (aDC3)? | -0.0016382 | -0.0050395 | -0.0198613 | 0.0795866 | 3.187446 | 0.0377645 | 0.1038523 |
| monocytes/macrophages | -0.0015626 | 0.0110010 | -0.0126048 | 0.1003342 | 2.954046 | 0.0482559 | 0.1179590 |
| plasma cells | -0.0012890 | 0.0024777 | -0.0144053 | 0.0810940 | 2.397421 | 0.0875522 | 0.1815055 |
Proportions Toptable results: Adenoids
| age | sexM | batchG000231_batch8 | AveExpr | F | P.Value | adj.P.Val | |
|---|---|---|---|---|---|---|---|
| T-follicular helper and/or T-follicular memory and/or CD4 Treg | -0.0050606 | -0.0057930 | 0.0241311 | 0.0470619 | 21.585749 | 0.0000002 | 0.0000035 |
| NK cells and/or NK- T cells and/or gamma delta T cells | 0.0032333 | 0.0072623 | -0.0005919 | 0.0407381 | 9.738957 | 0.0001348 | 0.0014823 |
| memory B cells | 0.0093029 | -0.0264214 | -0.0380241 | 0.1420777 | 5.321678 | 0.0048456 | 0.0271595 |
| DZ B cells (early or late phase) | -0.0022529 | 0.0089447 | -0.0021345 | 0.0361300 | 5.300340 | 0.0049381 | 0.0271595 |
| Germinal centre B cell: DZ-LZ transition and/or LZ and/or LZ-DZ | -0.0061409 | 0.0149197 | 0.0044698 | 0.1136184 | 2.922459 | 0.0507906 | 0.2046084 |
| activated DC3 (aDC3)? | -0.0002176 | -0.0011815 | -0.0032367 | 0.0071207 | 2.772420 | 0.0593692 | 0.2046084 |
| Cycling GM B cells | -0.0049410 | 0.0227681 | 0.0068758 | 0.0551574 | 2.584207 | 0.0725826 | 0.2046084 |
| neutrophils | 0.0007822 | -0.0025766 | -0.0057039 | 0.0024897 | 2.457390 | 0.0830003 | 0.2046084 |
| CM CD4 T cells and/or pre TFH cells | 0.0044829 | -0.0315803 | 0.0079408 | 0.1383713 | 2.401684 | 0.0882148 | 0.2046084 |
| monocytes/macrophages | -0.0003022 | 0.0023282 | -0.0022167 | 0.0106225 | 2.351417 | 0.0930038 | 0.2046084 |
Tonsils
Age as Continuous
 ####
Sex {.tabset}
####
Sex {.tabset}
 ####
Transformed proportions Toptable results: Tonsils
####
Transformed proportions Toptable results: Tonsils
| age | sexM | batchG000231_batch9 | AveExpr | F | P.Value | adj.P.Val | |
|---|---|---|---|---|---|---|---|
| Germinal centre B cell: DZ-LZ transition and/or LZ and/or LZ-DZ | -0.0141598 | -0.0343478 | -0.0451938 | 0.3441087 | 12.120142 | 0.0000205 | 0.0004913 |
| DZ B cells (early or late phase) | -0.0083404 | -0.0178757 | -0.0458115 | 0.2588213 | 9.766035 | 0.0001087 | 0.0013045 |
| CD8 T cells | 0.0099773 | 0.0176558 | -0.0010949 | 0.1993472 | 7.068491 | 0.0009379 | 0.0058935 |
| Regulatory CD4 T cells | 0.0036381 | -0.0087860 | 0.0229636 | 0.2002894 | 6.994355 | 0.0009823 | 0.0058935 |
| CM CD4 T cells and/or pre TFH cells | 0.0021446 | -0.0306858 | 0.0463883 | 0.3897797 | 6.370373 | 0.0017215 | 0.0082632 |
| activated DC3 (aDC3)? | -0.0023906 | -0.0236181 | 0.0405279 | 0.1252740 | 6.082416 | 0.0021956 | 0.0087825 |
| memory B cells | 0.0089230 | 0.0235752 | 0.0258019 | 0.2944656 | 5.637572 | 0.0033380 | 0.0114447 |
| Cycling GM B cells | -0.0096661 | -0.0175264 | 0.0359624 | 0.2839906 | 5.292177 | 0.0046029 | 0.0138087 |
| neutrophils | 0.0044743 | 0.0196783 | -0.0460594 | 0.0524873 | 4.903825 | 0.0065897 | 0.0175726 |
| Naive B cell activated | 0.0065440 | 0.0076935 | -0.0302492 | 0.1777379 | 2.765422 | 0.0584426 | 0.1402623 |
Proportions Toptable results: Tonsils
| age | sexM | batchG000231_batch9 | AveExpr | F | P.Value | adj.P.Val | |
|---|---|---|---|---|---|---|---|
| Germinal centre B cell: DZ-LZ transition and/or LZ and/or LZ-DZ | -0.0084452 | -0.0224598 | -0.0283193 | 0.1199224 | 9.463885 | 0.0001627 | 0.0039053 |
| DZ B cells (early or late phase) | -0.0037181 | -0.0097905 | -0.0240633 | 0.0692911 | 8.251433 | 0.0004067 | 0.0048801 |
| Regulatory CD4 T cells | 0.0014747 | -0.0030909 | 0.0088465 | 0.0407203 | 7.303567 | 0.0008671 | 0.0057532 |
| activated DC3 (aDC3)? | -0.0006465 | -0.0060291 | 0.0103591 | 0.0164936 | 6.948272 | 0.0011537 | 0.0057532 |
| CD8 T cells | 0.0037783 | 0.0064033 | 0.0001585 | 0.0420241 | 6.912413 | 0.0011986 | 0.0057532 |
| CM CD4 T cells and/or pre TFH cells | 0.0015077 | -0.0229258 | 0.0326892 | 0.1463575 | 6.371939 | 0.0018967 | 0.0075868 |
| memory B cells | 0.0047209 | 0.0145889 | 0.0155014 | 0.0880232 | 5.176634 | 0.0055069 | 0.0188806 |
| Cycling GM B cells | -0.0049036 | -0.0099528 | 0.0188909 | 0.0805841 | 4.778497 | 0.0079846 | 0.0239539 |
| Naive B cell activated | 0.0023247 | 0.0034793 | -0.0093027 | 0.0329960 | 2.761341 | 0.0600604 | 0.1601612 |
| Pre-T follicular helper / CD4 Treg | -0.0002605 | -0.0003124 | 0.0016358 | 0.0024761 | 2.504281 | 0.0788196 | 0.1834559 |
Nasal_brushings
Age as Continuous
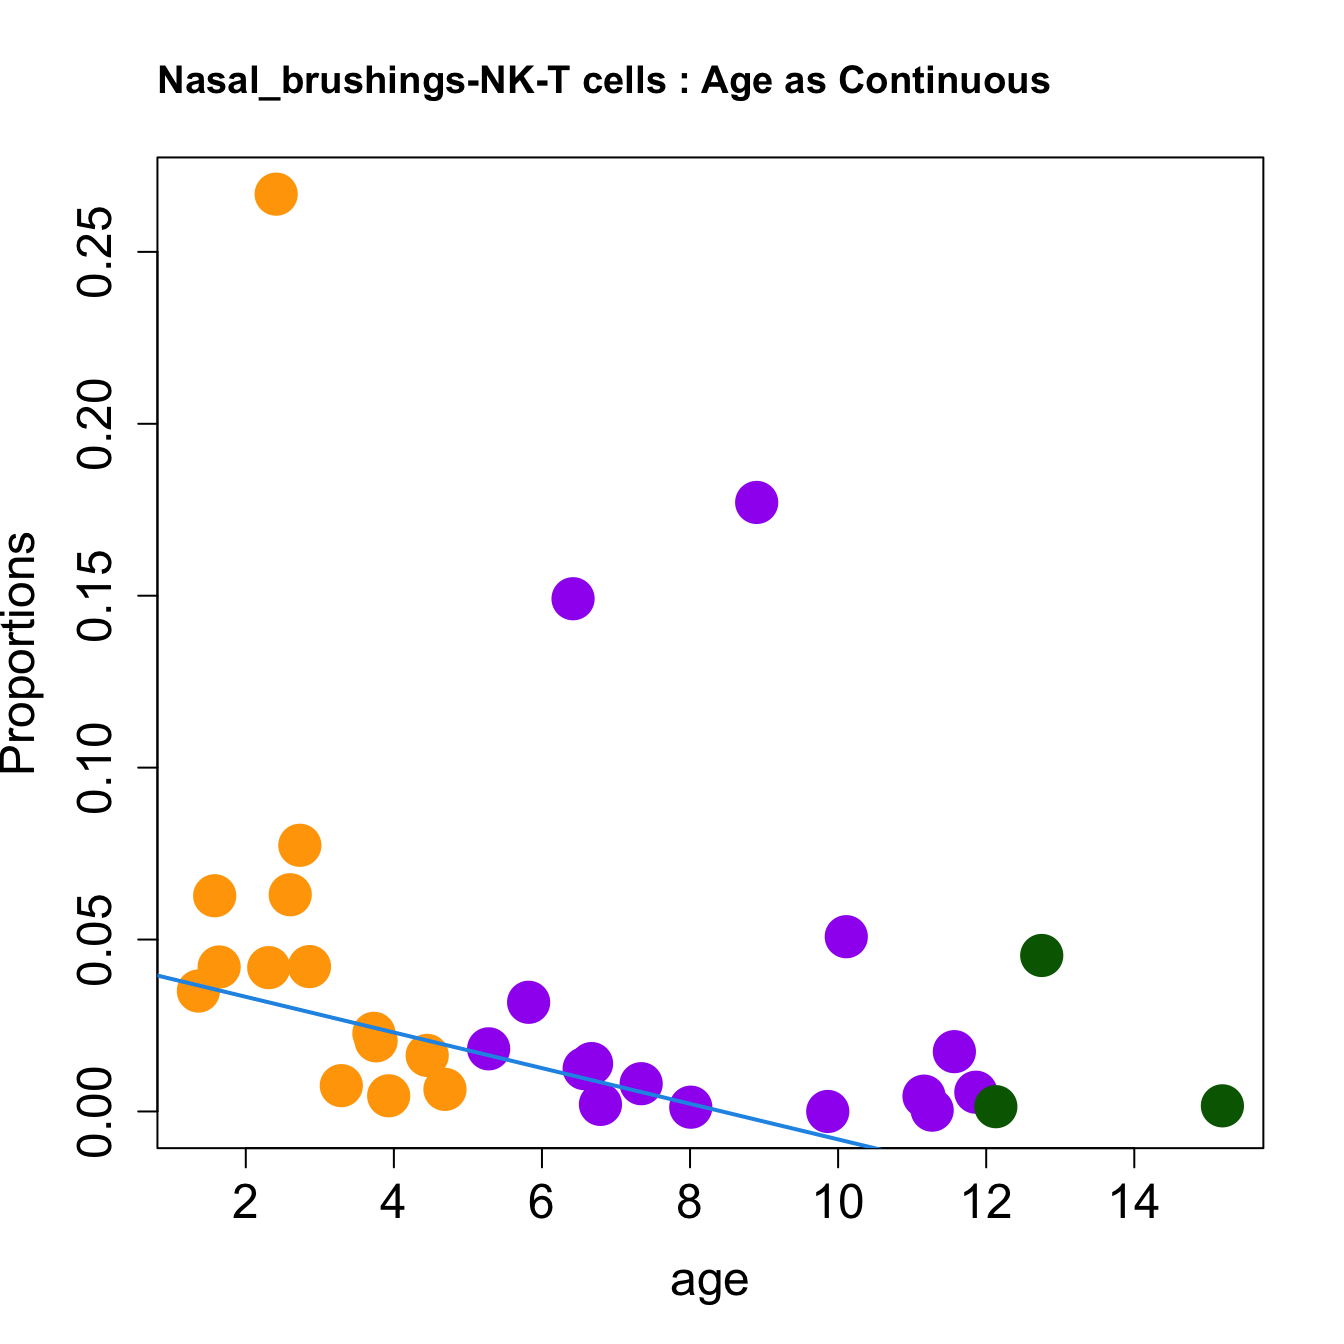
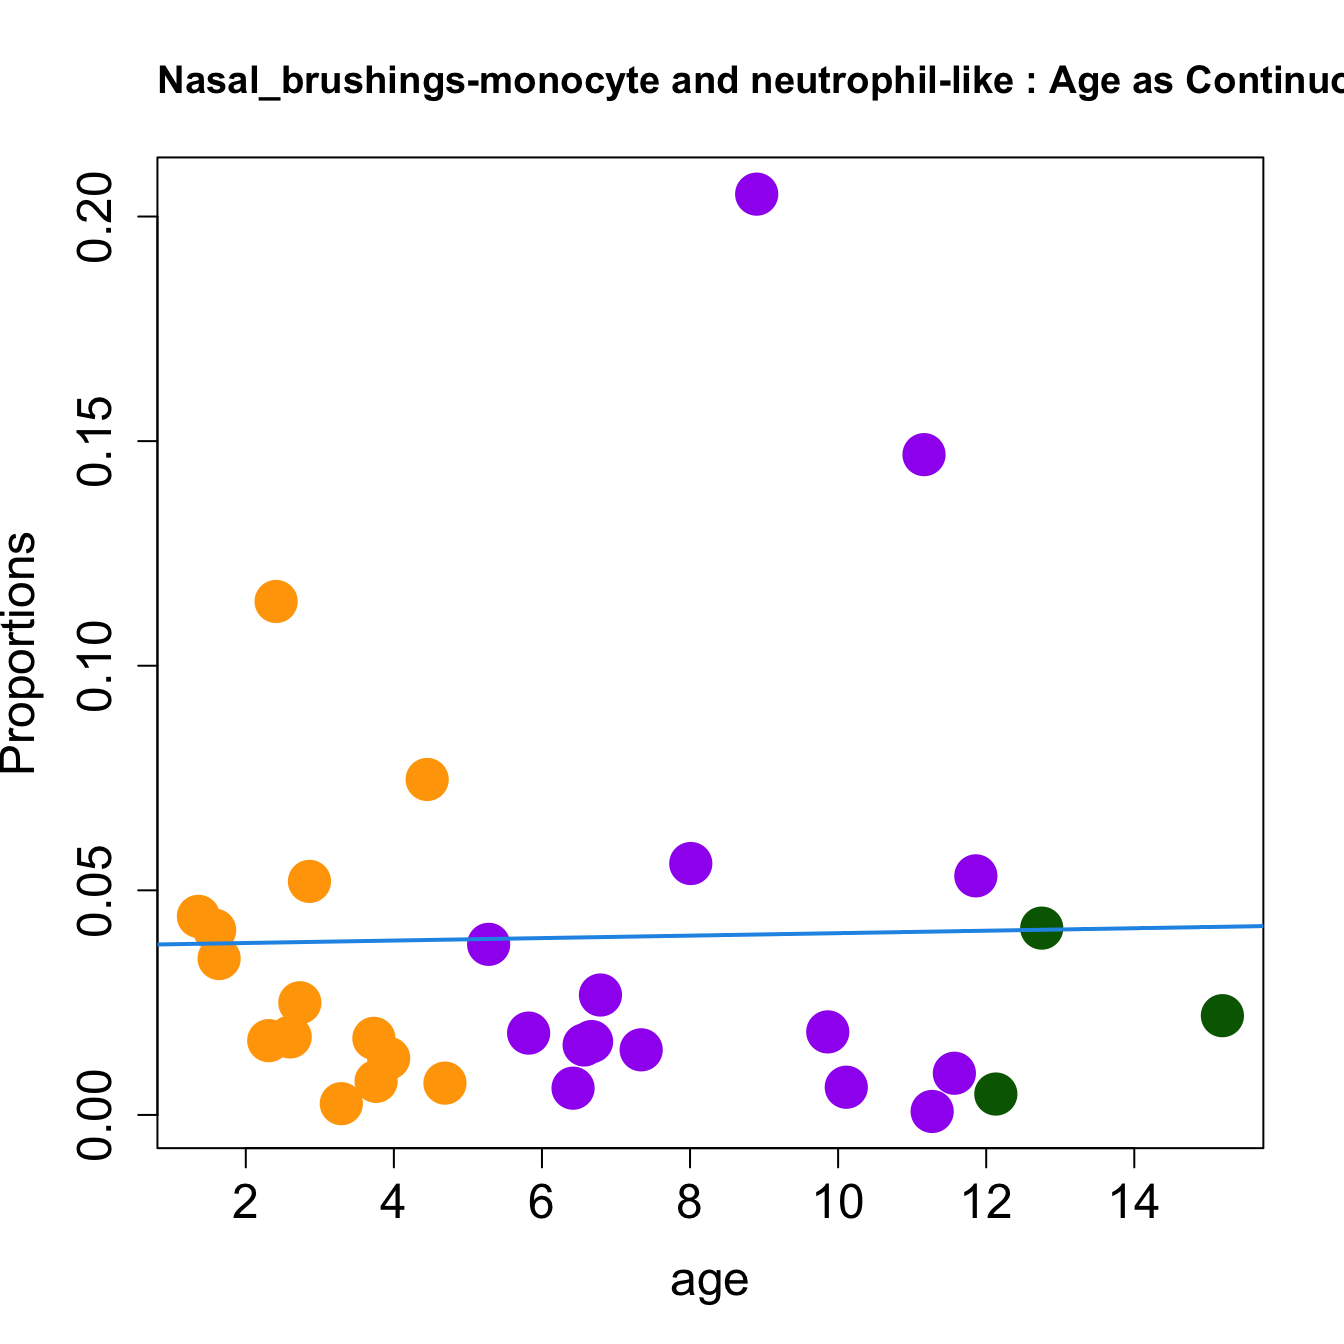
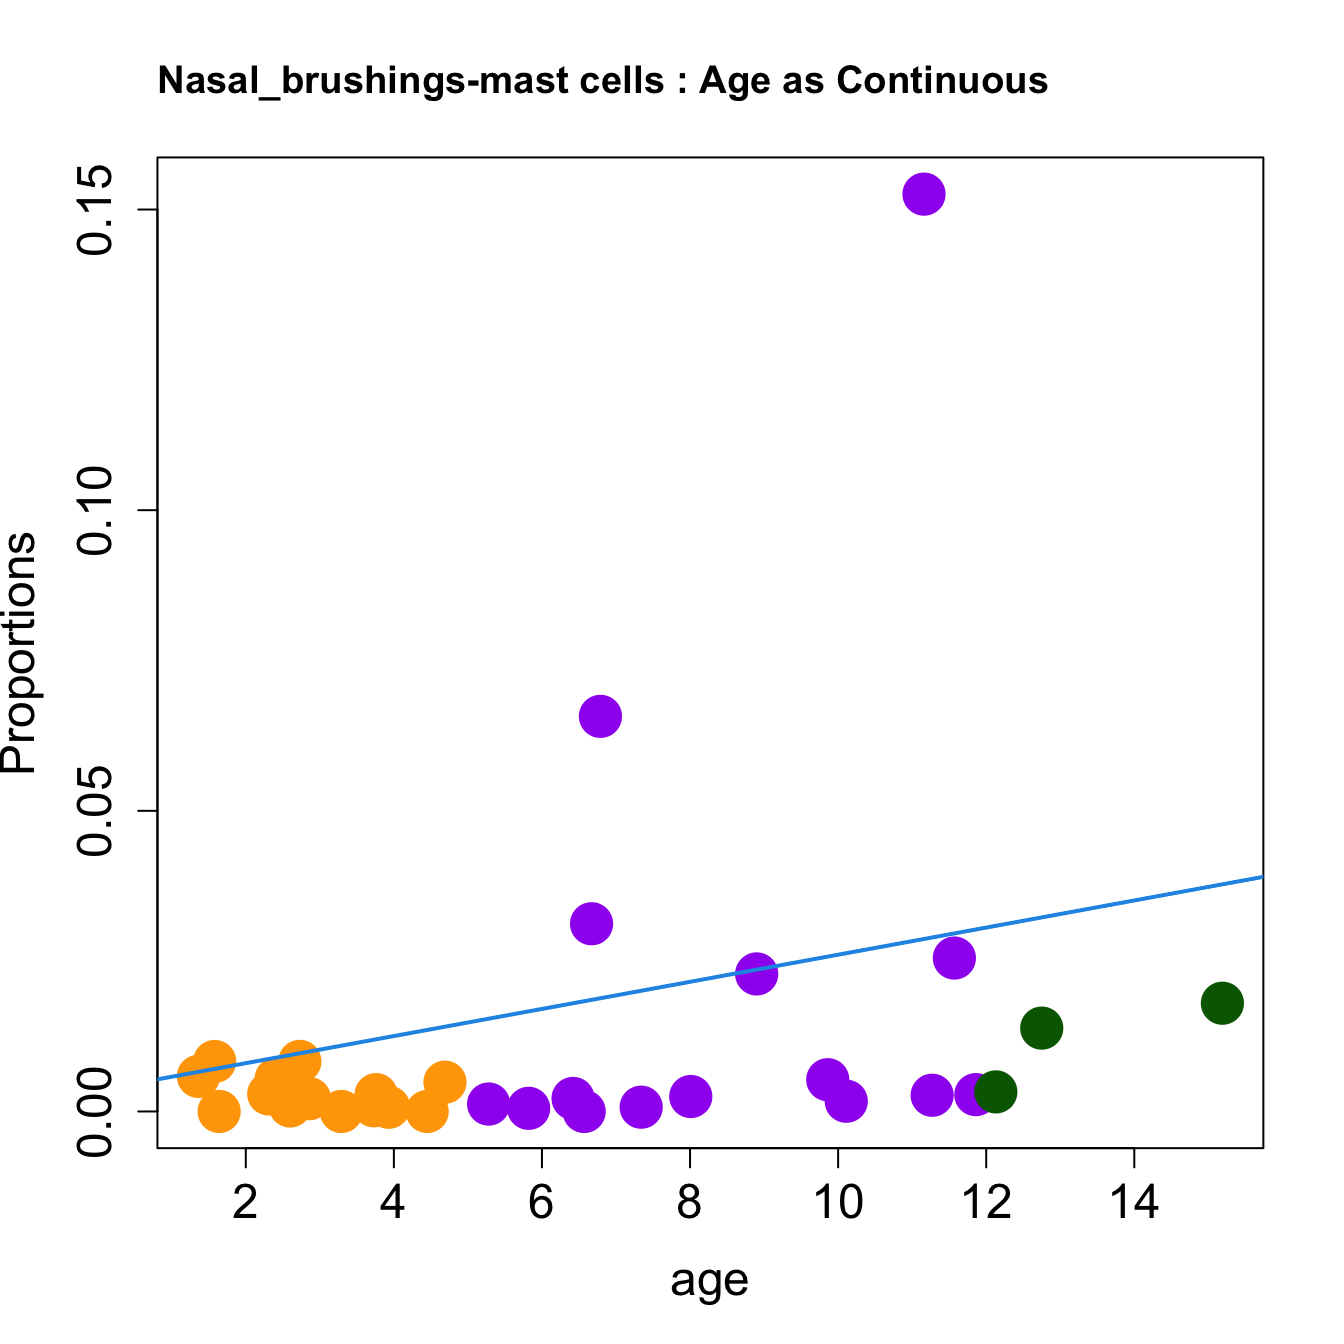
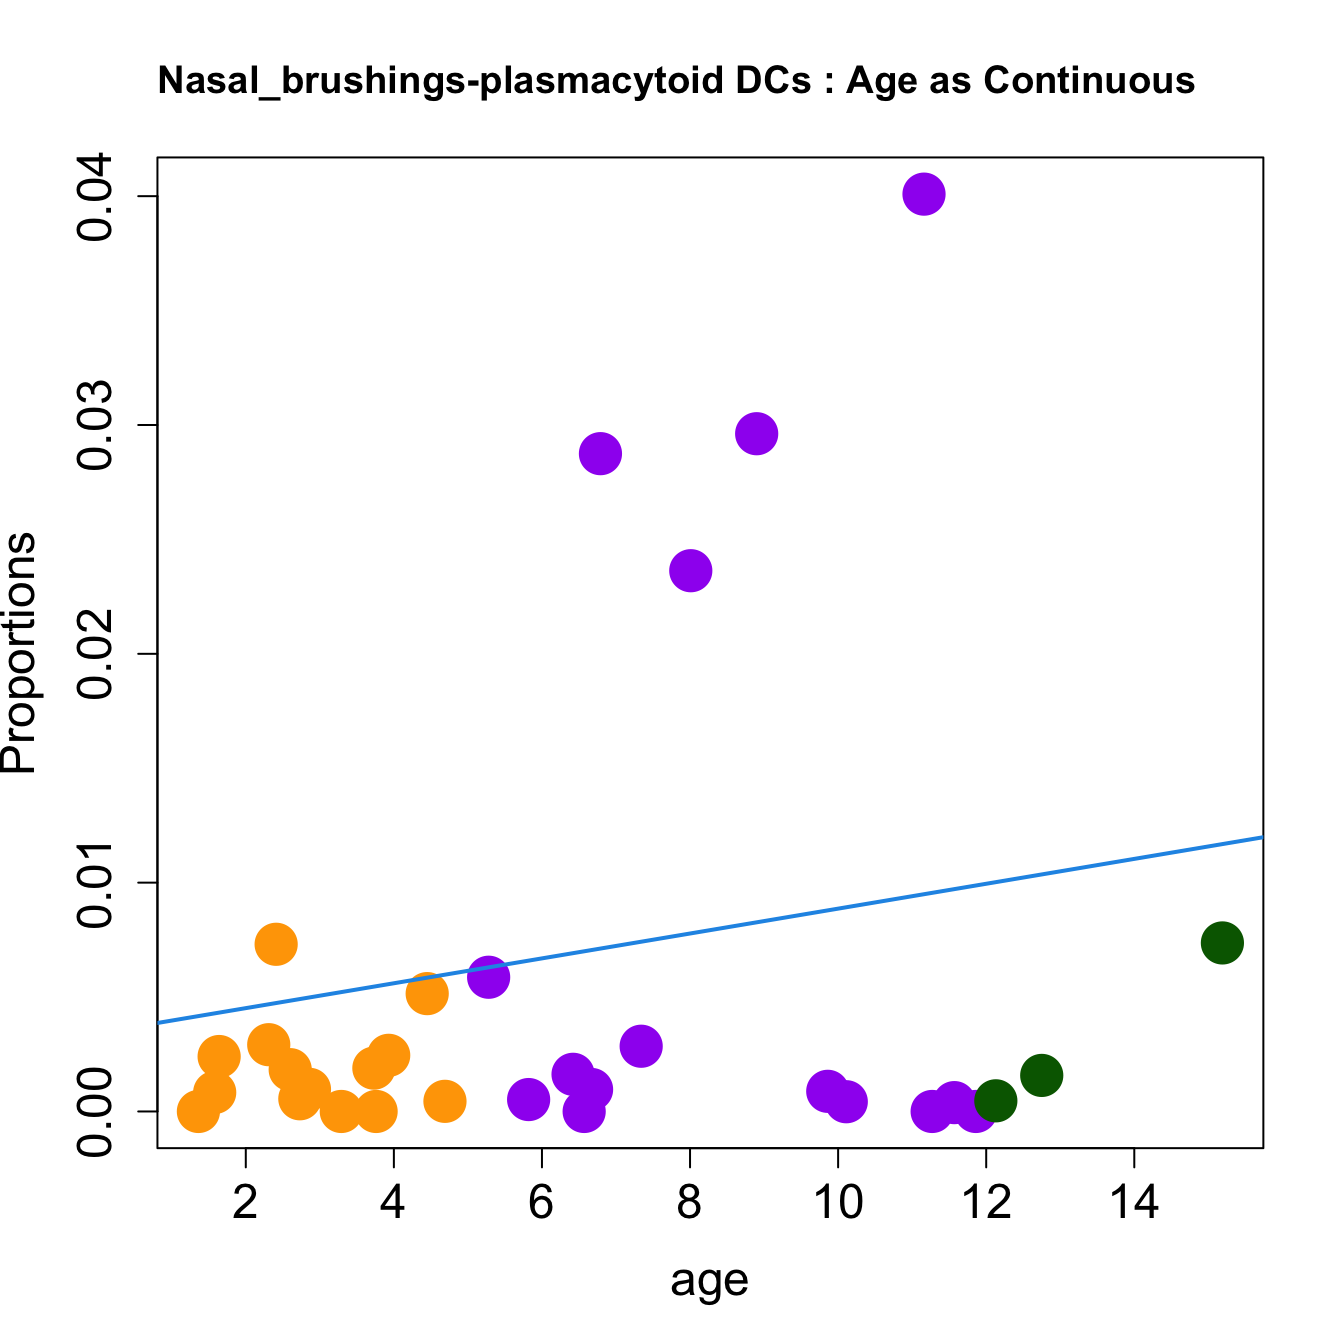
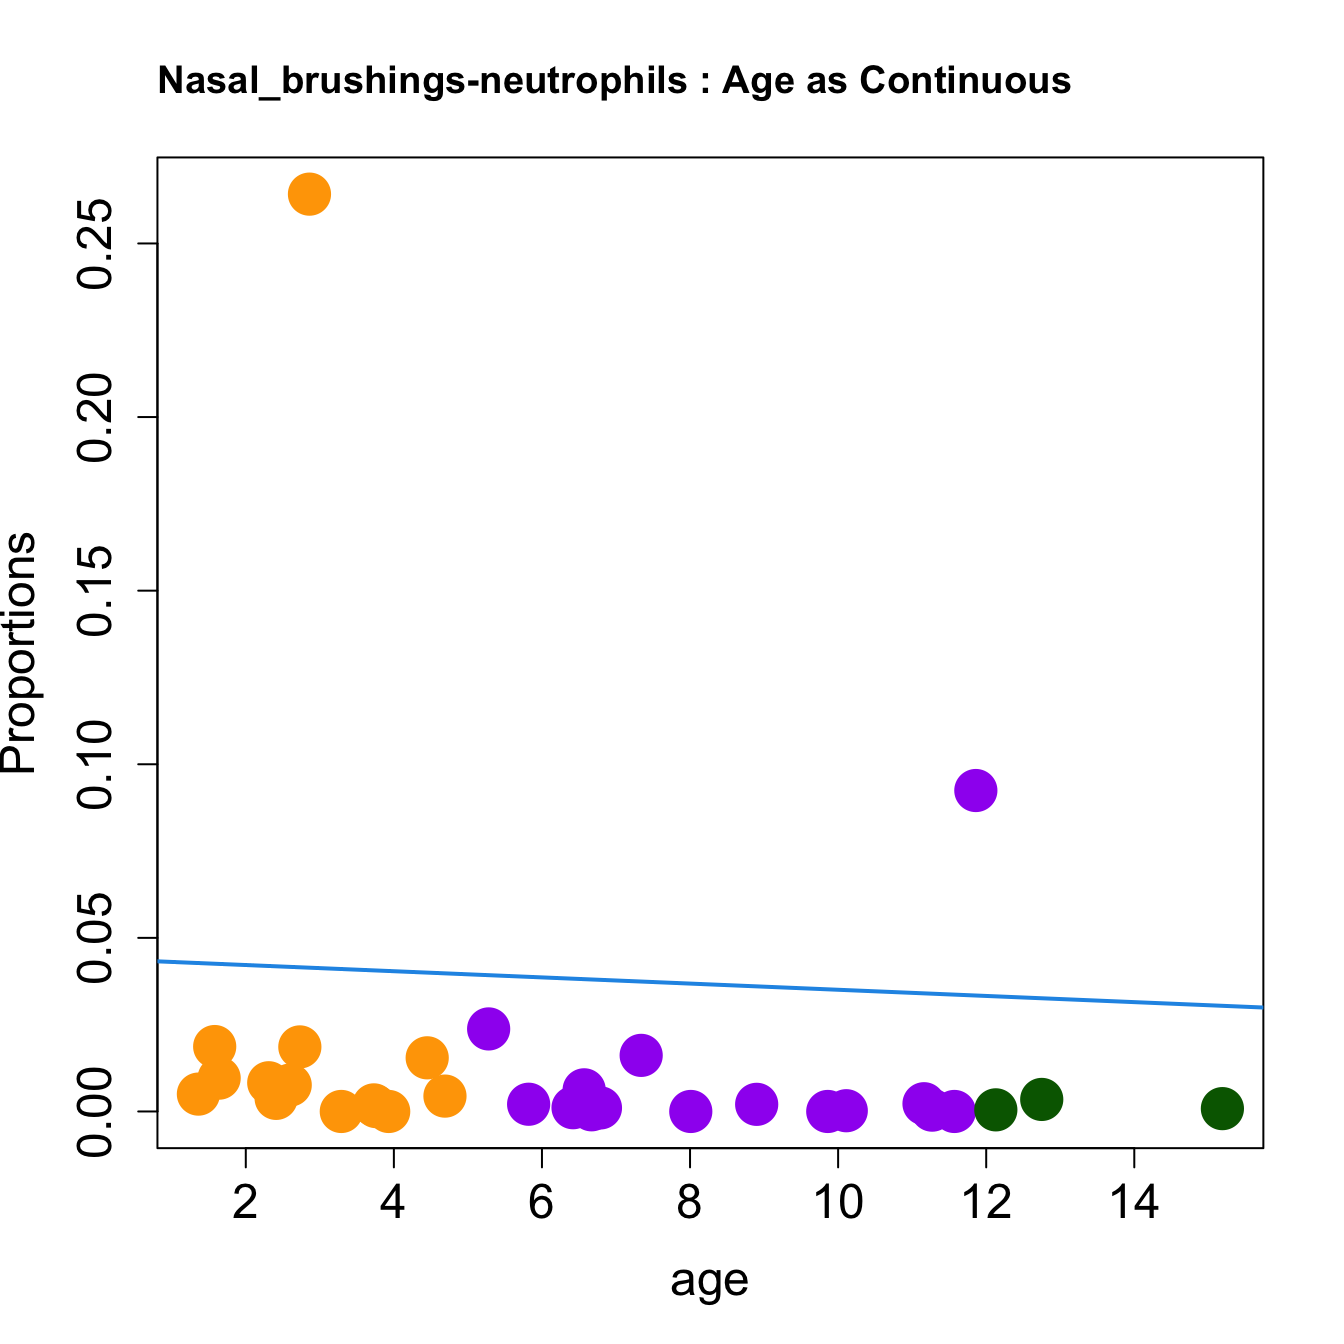
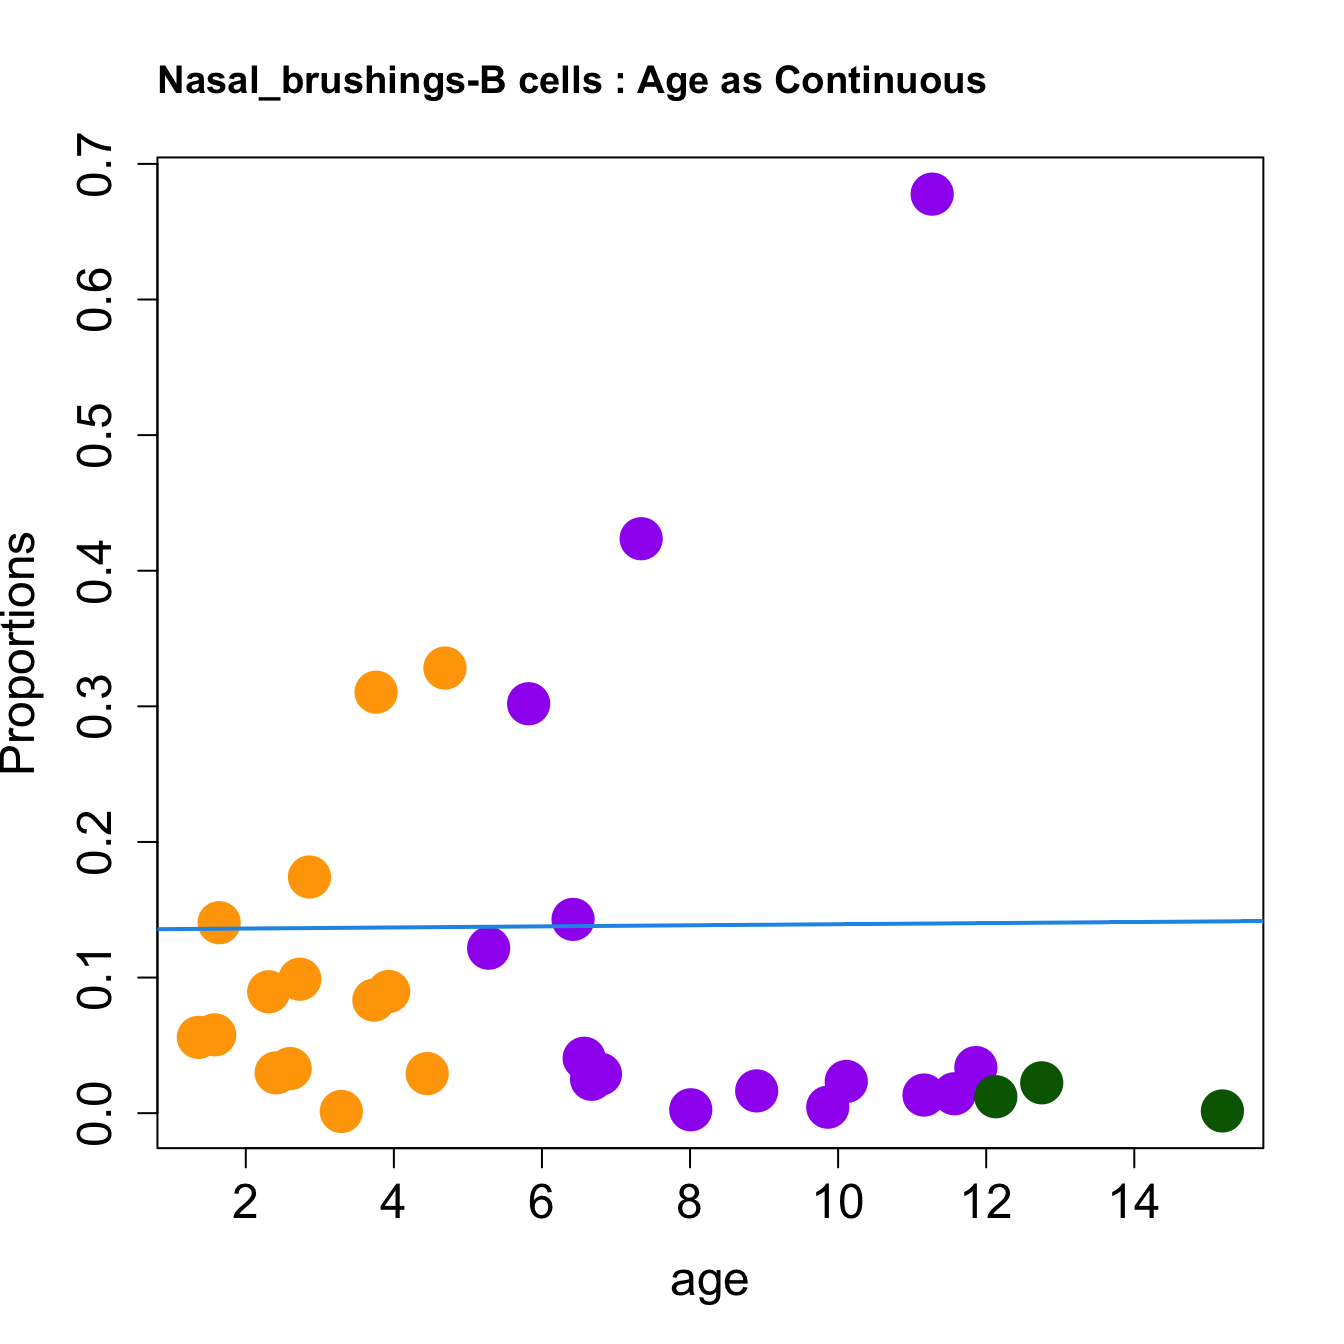
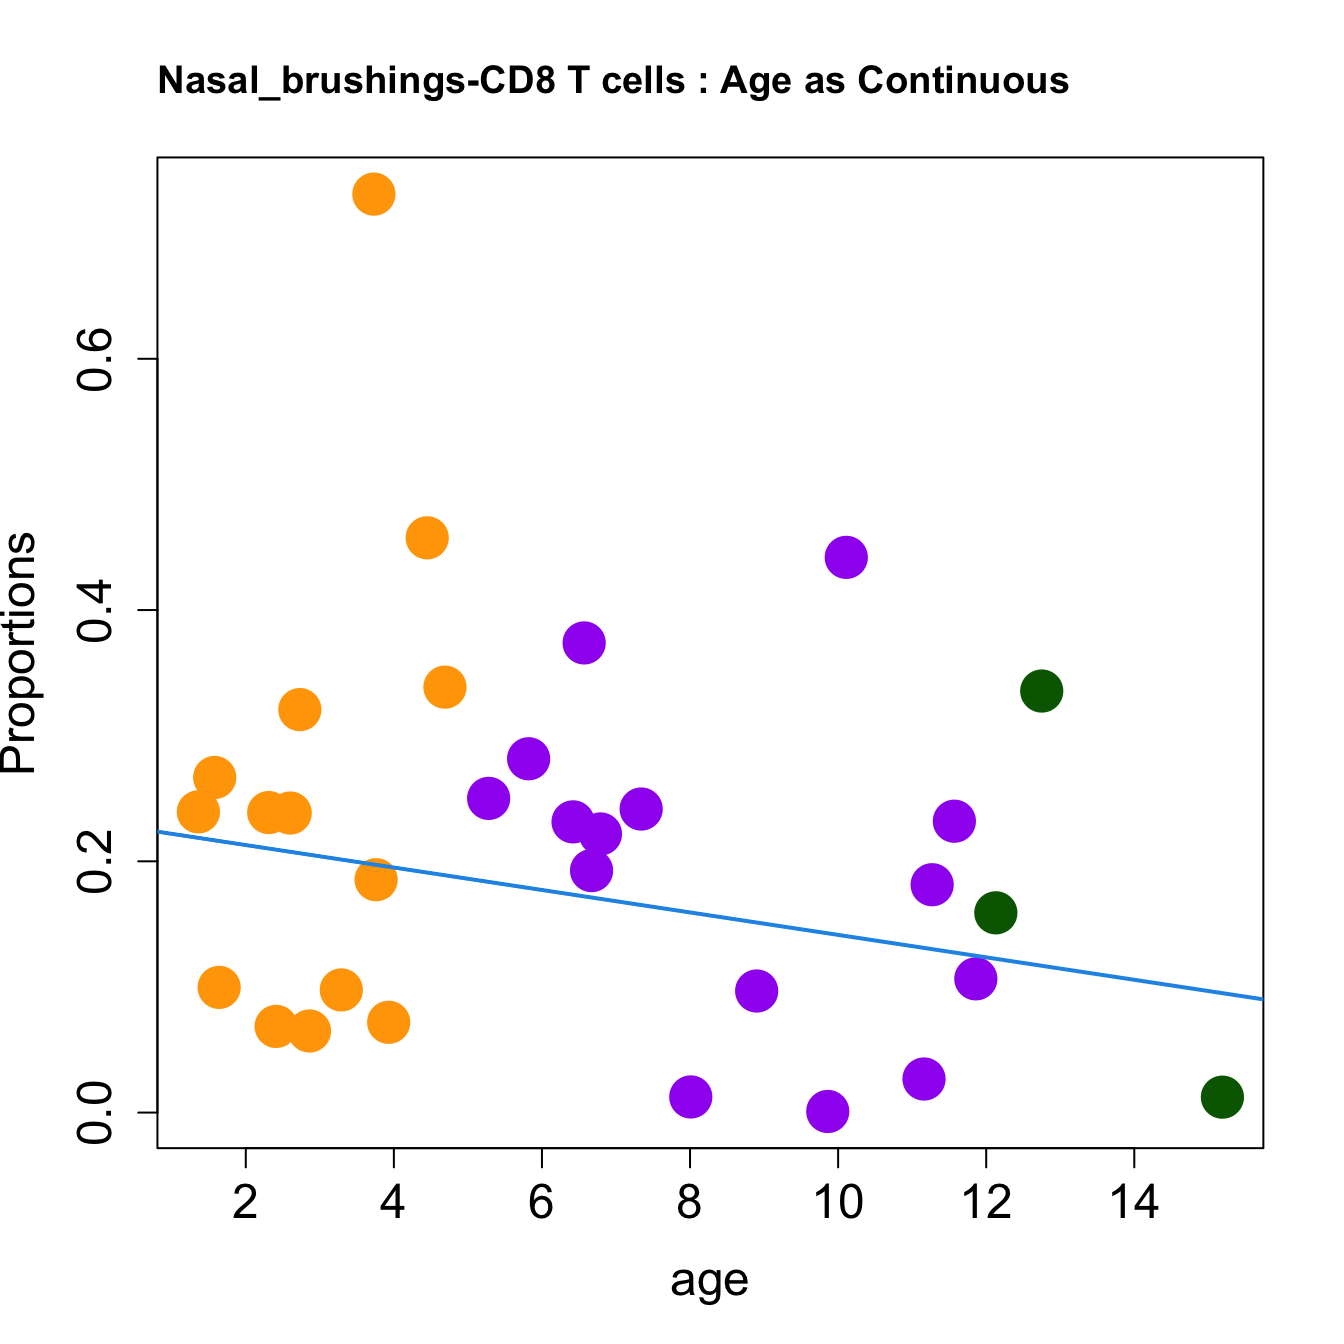
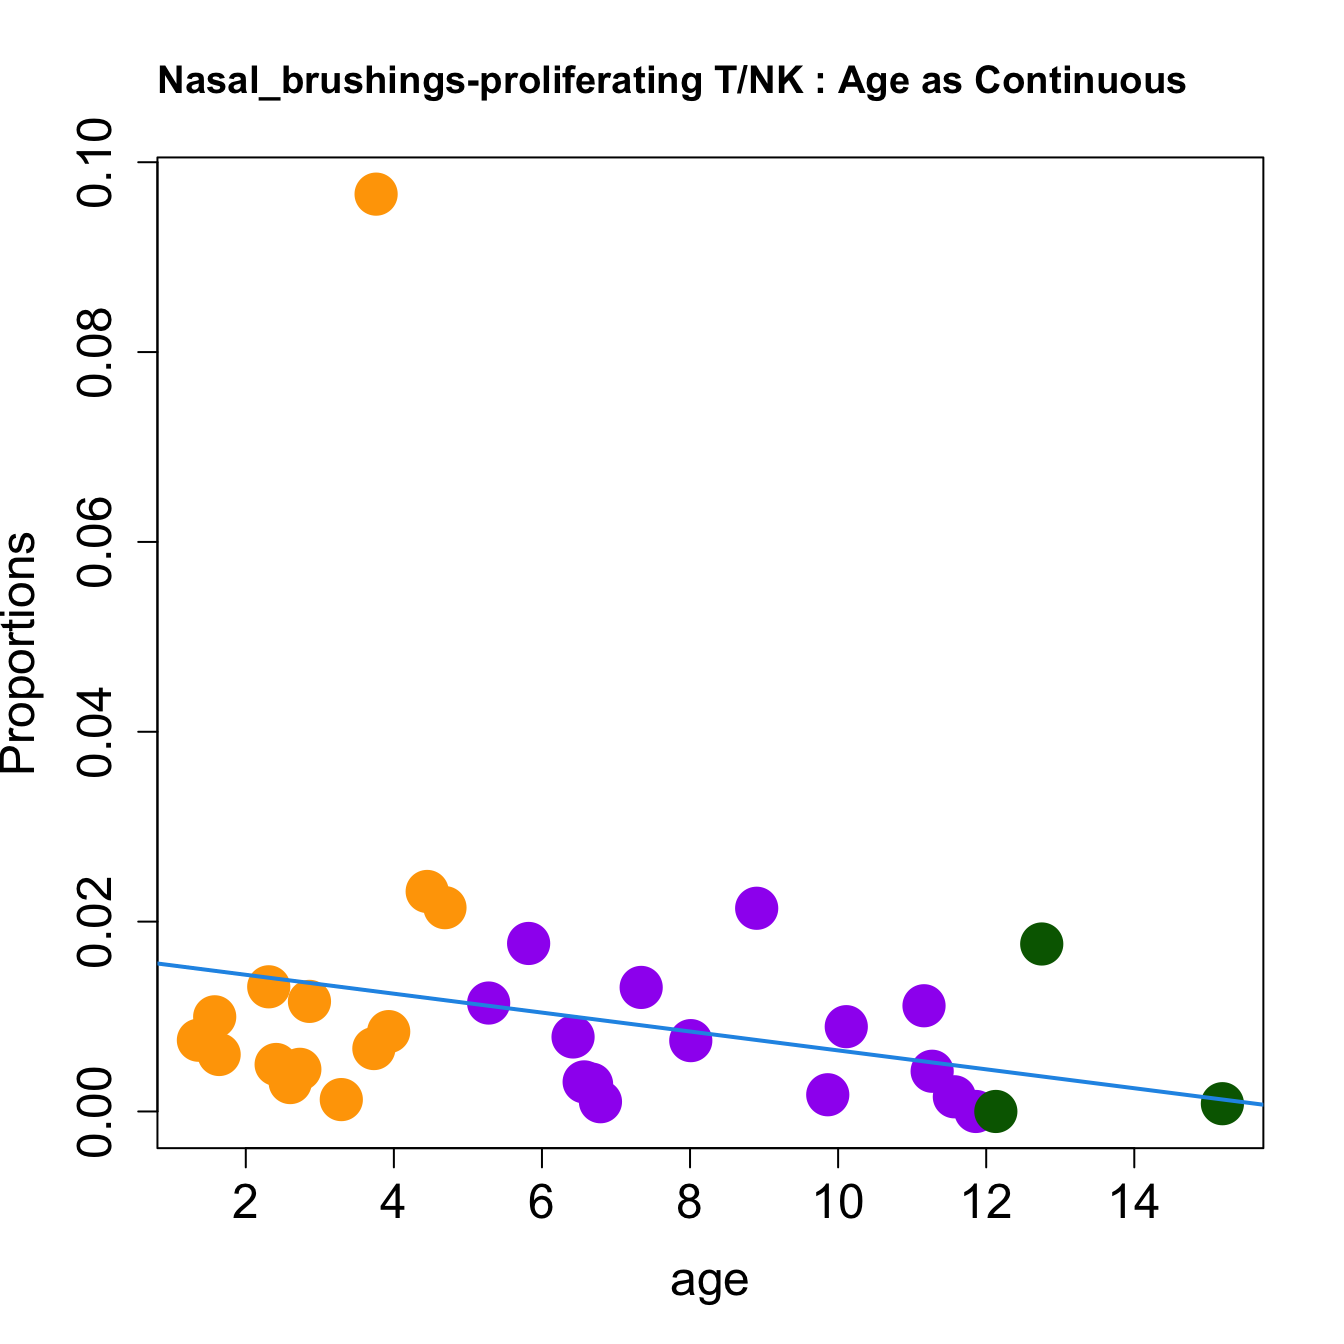
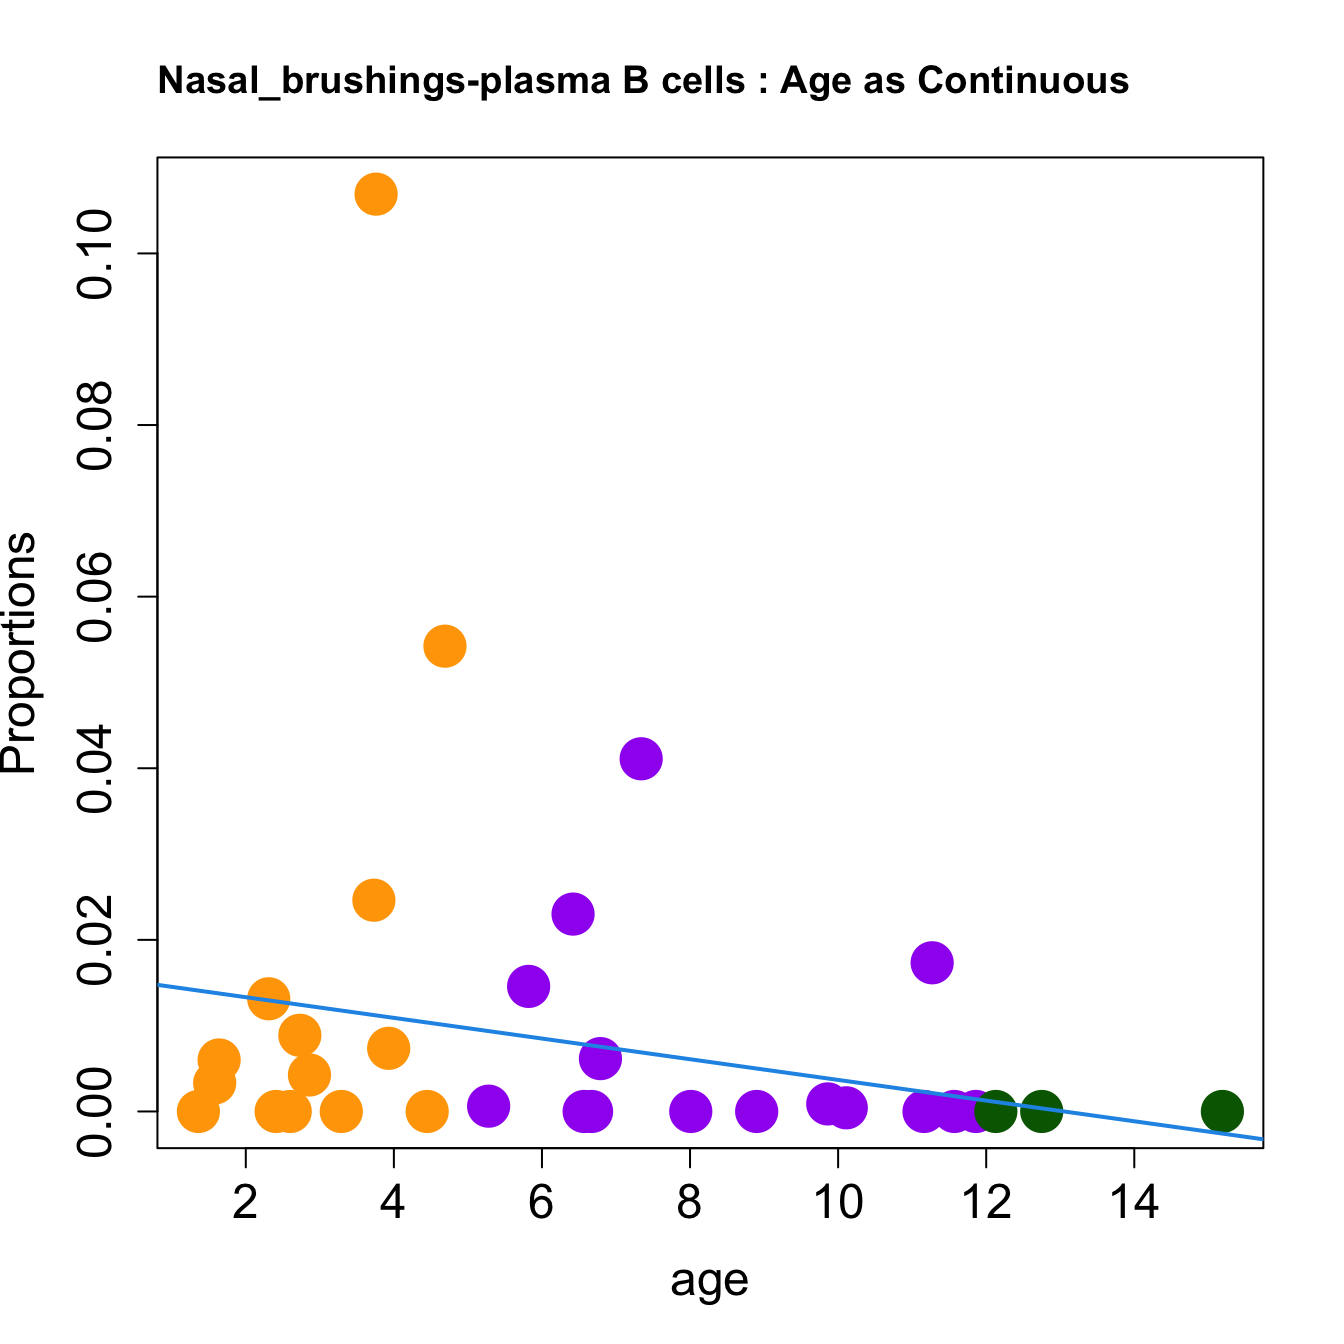
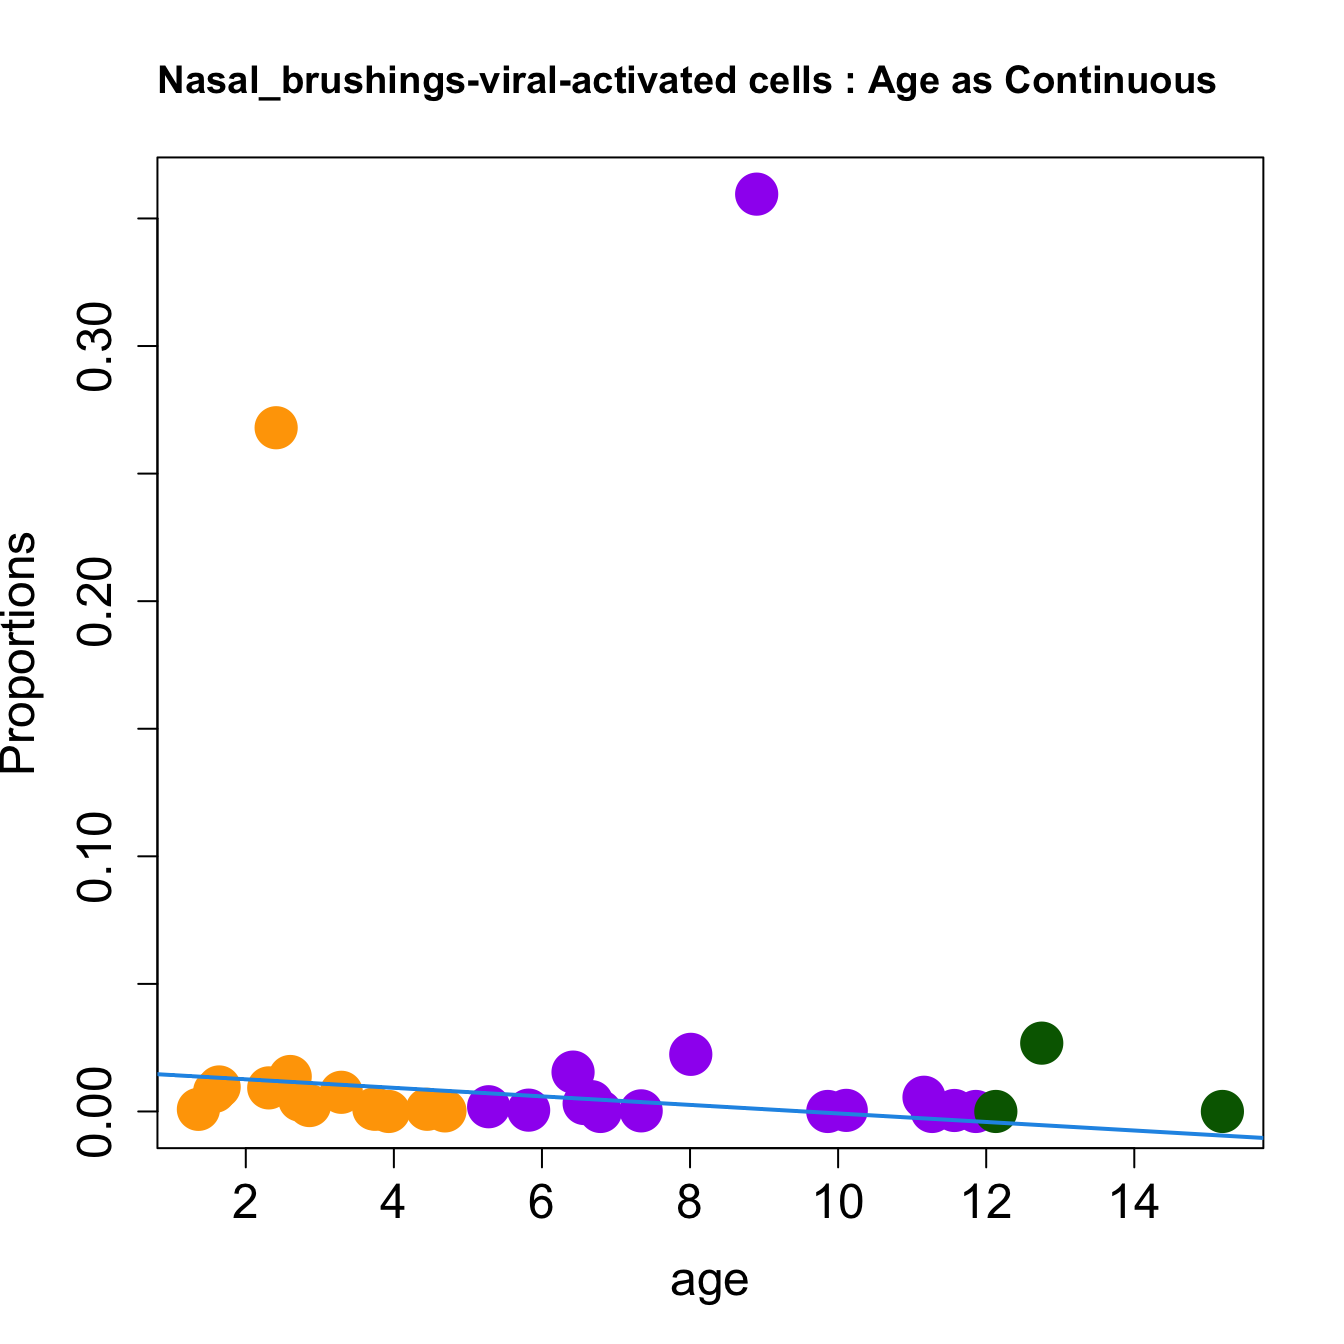 ####
Sex {.tabset}
####
Sex {.tabset}
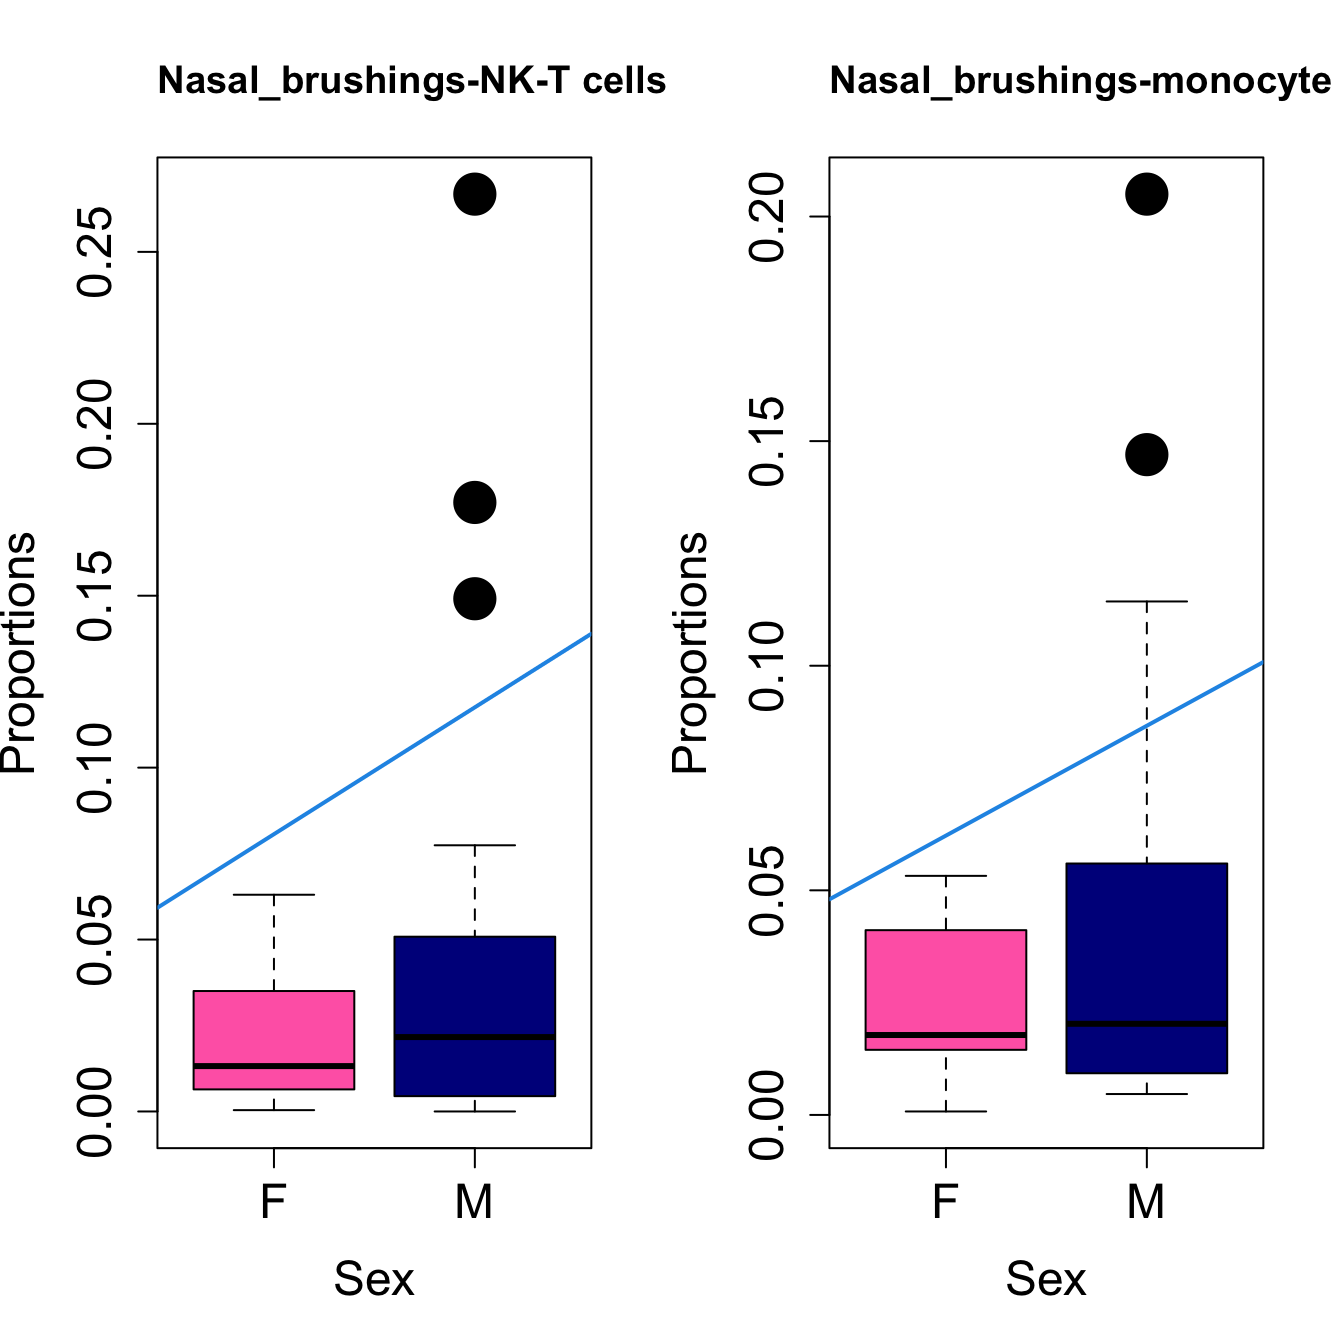
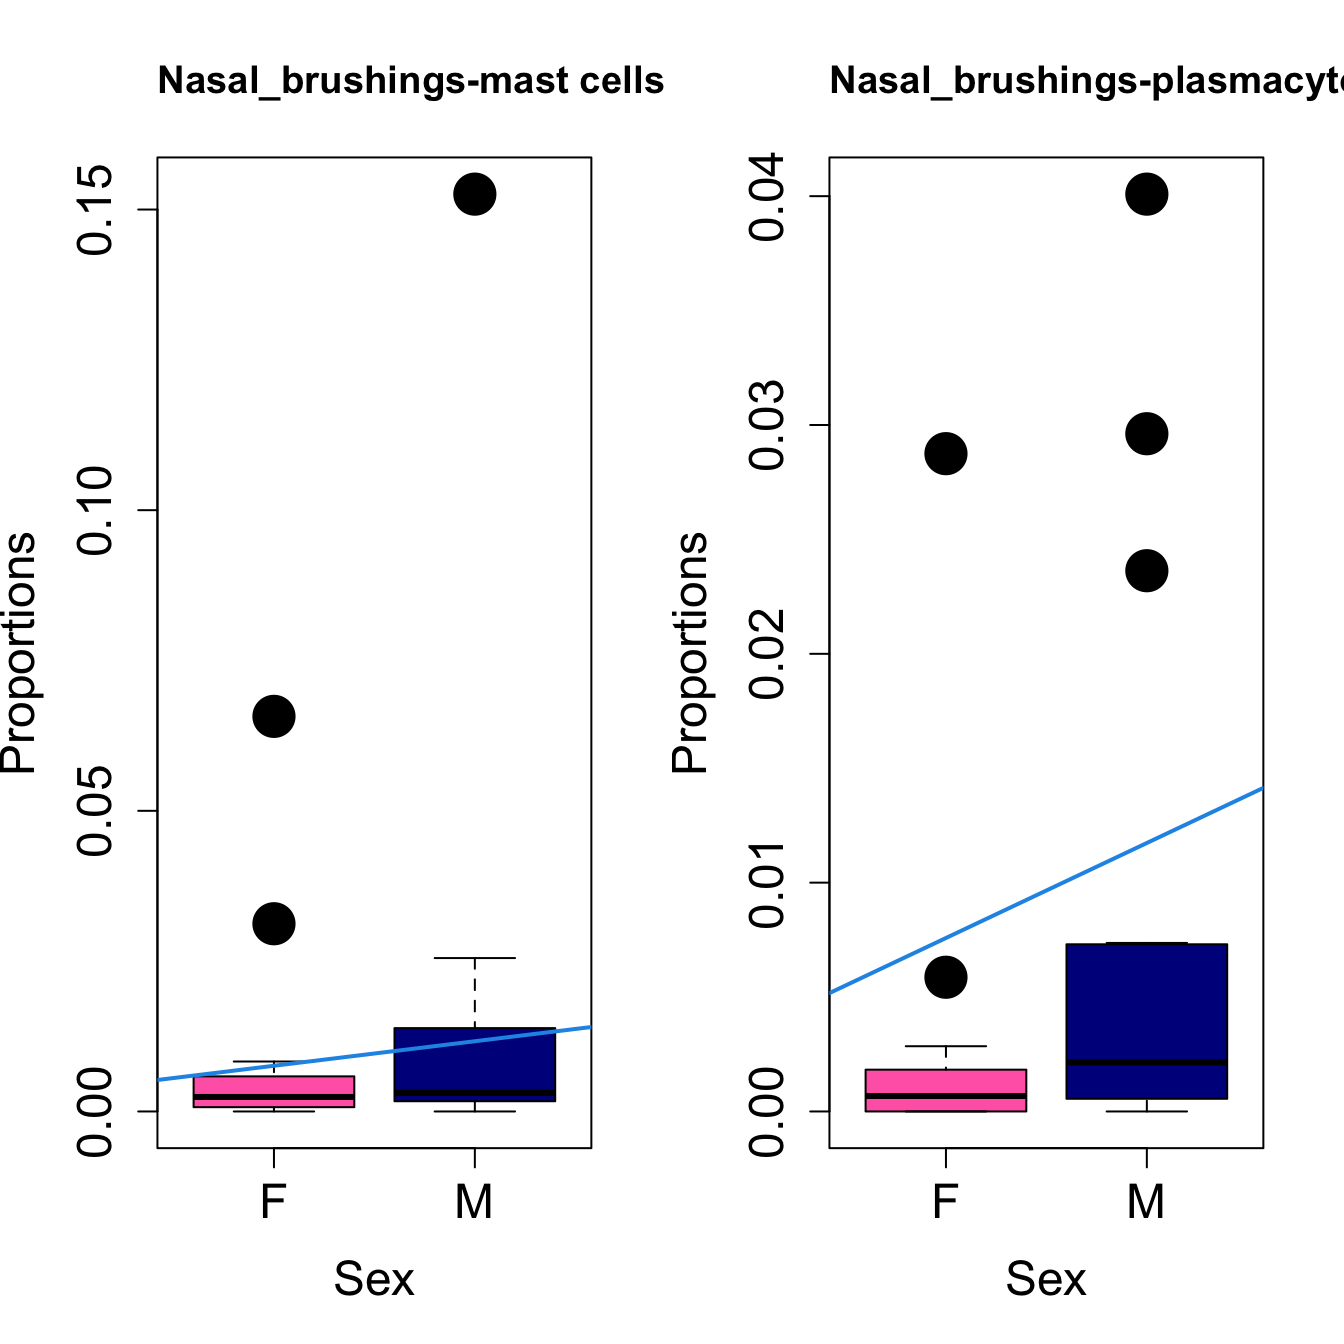
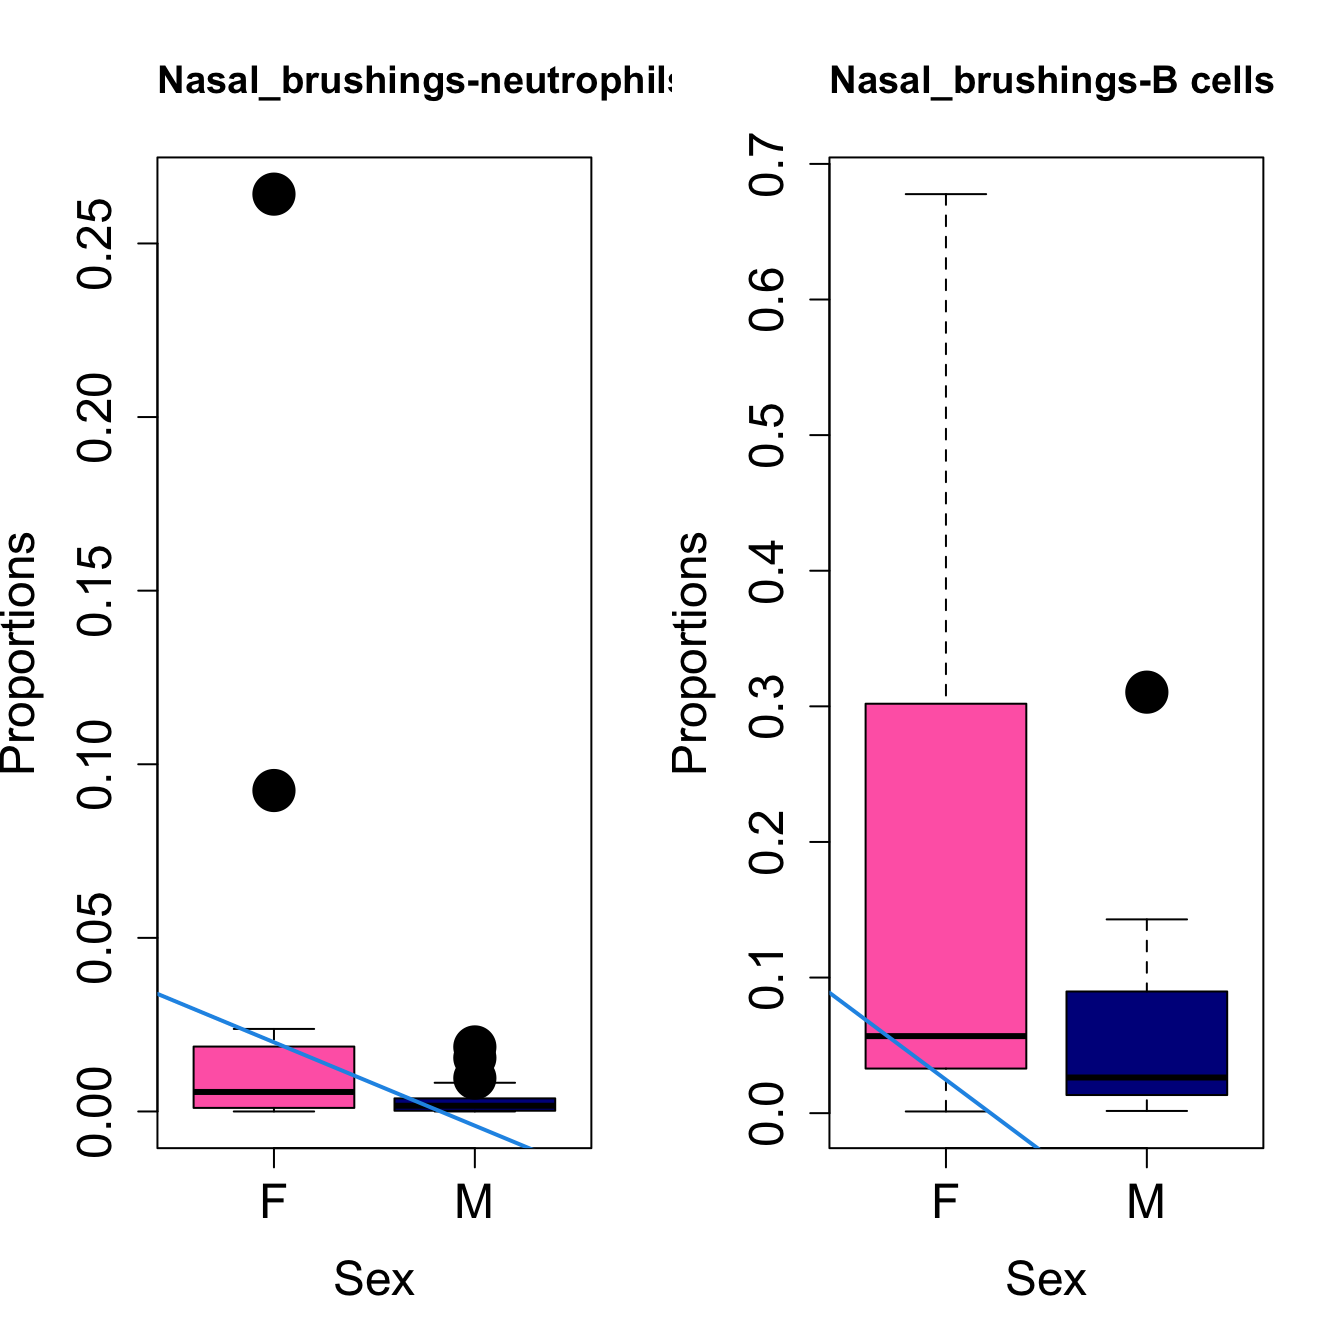
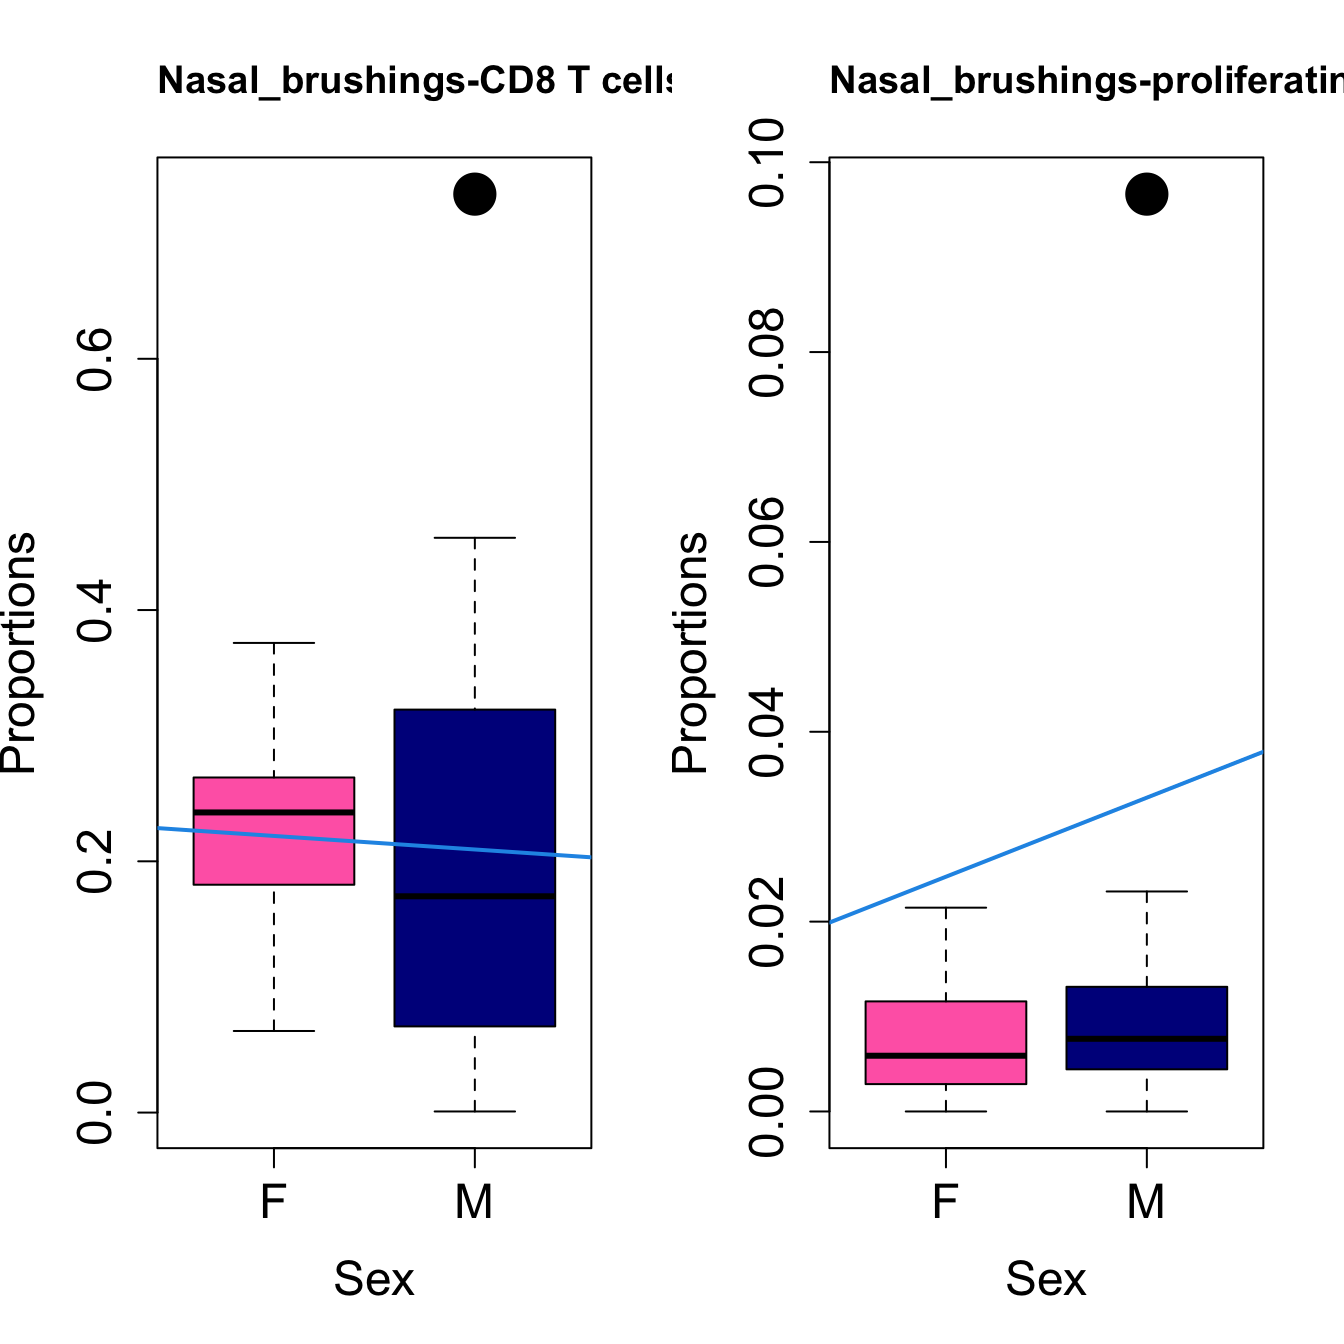
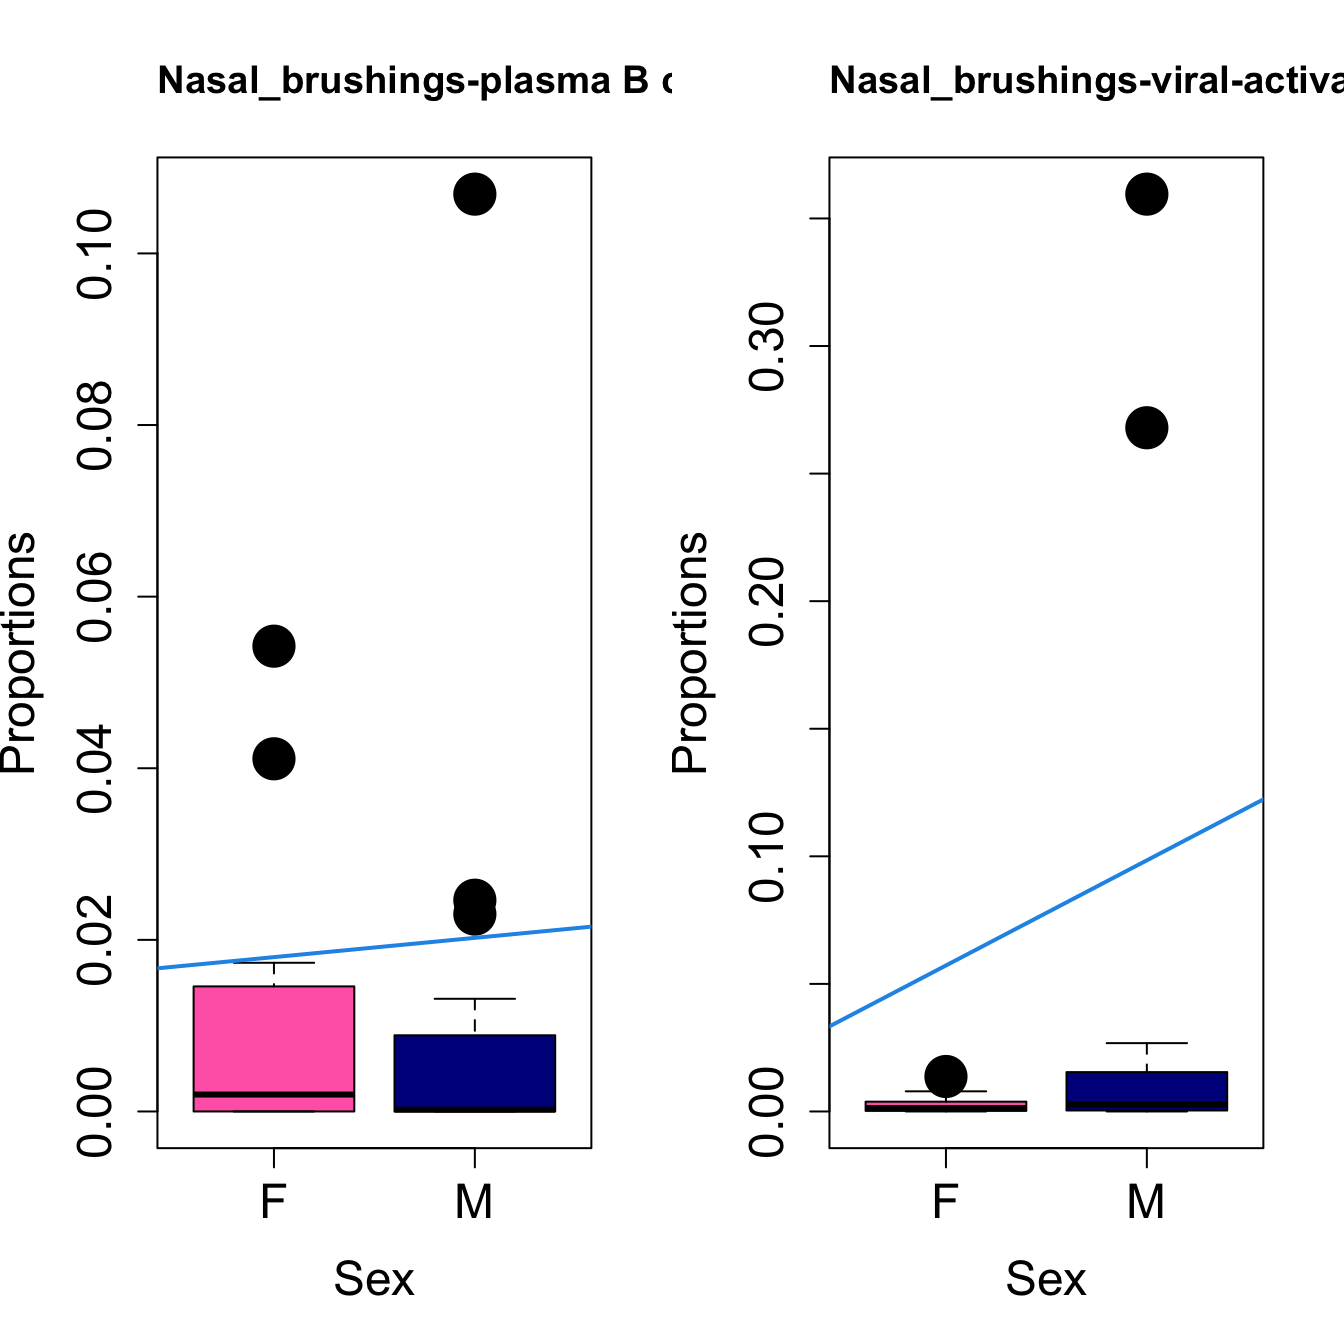 ####
Transformed proportions Toptable results: Nasal_brushings
####
Transformed proportions Toptable results: Nasal_brushings
| age | sexM | batchG000231_batch5 | AveExpr | F | P.Value | adj.P.Val | |
|---|---|---|---|---|---|---|---|
| NK-T cells | -0.0147996 | 0.0735284 | 0.0328663 | 0.1611396 | 3.488244 | 0.0276287 | 0.3000845 |
| monocyte and neutrophil-like | -0.0010021 | 0.0525727 | -0.0879388 | 0.1682310 | 3.146680 | 0.0393800 | 0.3000845 |
| mast cells | 0.0081814 | 0.0109839 | -0.0419161 | 0.0782283 | 2.548362 | 0.0743479 | 0.3000845 |
| plasmacytoid DCs | 0.0018378 | 0.0319181 | -0.0359758 | 0.0512956 | 2.252954 | 0.1023900 | 0.3000845 |
| neutrophils | -0.0040300 | -0.0628129 | -0.0339068 | 0.0791660 | 2.046915 | 0.1282605 | 0.3000845 |
| B cells | -0.0075329 | -0.1448491 | 0.0807056 | 0.2791431 | 2.031871 | 0.1306262 | 0.3000845 |
| CD8 T cells | -0.0136321 | -0.0472306 | 0.1269937 | 0.4502654 | 2.027266 | 0.1312870 | 0.3000845 |
| proliferating T/NK | -0.0051705 | 0.0299025 | -0.0211687 | 0.0884831 | 1.898459 | 0.1509935 | 0.3019871 |
| plasma B cells | -0.0064534 | 0.0015147 | 0.0246574 | 0.0620145 | 1.123979 | 0.3548865 | 0.5193914 |
| viral-activated cells | -0.0065133 | 0.0865647 | -0.0068470 | 0.0836597 | 1.101964 | 0.3636798 | 0.5193914 |
Proportions Toptable results: Nasal_brushings
| age | sexM | batchG000231_batch5 | AveExpr | F | P.Value | adj.P.Val | |
|---|---|---|---|---|---|---|---|
| plasmacytoid DCs | 0.0005436 | 0.0041524 | -0.0078962 | 0.0053672 | 2.481066 | 0.0808514 | 0.4688430 |
| NK-T cells | -0.0051875 | 0.0368998 | 0.0168949 | 0.0390653 | 2.417714 | 0.0866305 | 0.4688430 |
| monocyte and neutrophil-like | 0.0002761 | 0.0244582 | -0.0336835 | 0.0364423 | 2.404075 | 0.0879081 | 0.4688430 |
| mast cells | 0.0022573 | 0.0040851 | -0.0163894 | 0.0123677 | 2.008948 | 0.1347357 | 0.5135964 |
| B cells | 0.0004128 | -0.1106854 | 0.0626827 | 0.1071052 | 1.849244 | 0.1604989 | 0.5135964 |
| CD8 T cells | -0.0089496 | -0.0107879 | 0.0931520 | 0.2130470 | 1.534815 | 0.2266501 | 0.5208806 |
| proliferating T/NK | -0.0009965 | 0.0083334 | -0.0072645 | 0.0109445 | 1.352027 | 0.2769961 | 0.5208806 |
| neutrophils | -0.0008920 | -0.0240376 | -0.0172784 | 0.0159943 | 1.331904 | 0.2832750 | 0.5208806 |
| goblet/club/basal cells | 0.0084183 | 0.0076736 | -0.1100610 | 0.3124801 | 1.301163 | 0.2929953 | 0.5208806 |
| ionocytes | 0.0000201 | -0.0003328 | -0.0035608 | 0.0055732 | 1.020224 | 0.3980570 | 0.6342899 |
Bronchial and BAL
tissue_list <- c("Bronchial_brushings", "BAL")

seurat_objects[["BAL"]]@meta.data$Sample <- sub("_\\d+$", "", seurat_objects[["BAL"]]@meta.data$Sample)

# Loop over each tissue
for (tissue_name in tissue_list) {
  tissue_obj <- seurat_objects[[tissue_name]]

  props <- getTransformedProps(clusters = tissue_obj$cell_labels,
                               sample = tissue_obj$Sample, transform = "asin")

  tissue_obj@meta.data <- tissue_obj@meta.data %>%
    mutate(age_group = case_when(
      age_years >= 1 & age_years < 6  ~ "Preschool_1to5_years",
      age_years >= 6 & age_years < 12 ~ "Kids_6to11_years",
      age_years >= 12 ~ "Adolescent_12to17_years",
      TRUE ~ "Other"
    ))

  samples_metadata <- tissue_obj@meta.data %>%
    dplyr::filter(Sample %in% unique(tissue_obj@meta.data$Sample)) %>%
    dplyr::group_by(Sample) %>%
    dplyr::summarise(
      age = dplyr::first(age_years),
      sex = dplyr::first(sex),
      batch = dplyr::first(batch_name),
      age_group = dplyr::first(age_group),
      .groups = 'drop'
    )

  age <- samples_metadata$age
  sex <- as.factor(samples_metadata$sex)
  batch <- as.factor(samples_metadata$batch)
  design <- model.matrix(~age + sex)

  fit <- lmFit(props$TransformedProps, design)
  fit <- eBayes(fit, robust=TRUE)
  toptable.transformedProps <- topTable(fit)

  fit.prop <- lmFit(props$Proportions, design)
  fit.prop <- eBayes(fit.prop, robust=TRUE)
  toptable.props <- topTable(fit.prop, sort.by = "F")

  age_group_colors <- sapply(age, get_age_group_color)

  # Add tabset for each tissue
  cat(paste0("### ", tissue_name, " {.tabset}\n\n"))

  sorted_indices <- match(rownames(toptable.transformedProps), rownames(props$Proportions))

  # Plot Age as Continuous
  cat(paste0("#### Age as Continuous\n"))
  #pdf(file = here("output/plots/", paste0(tissue_name, "_proportions_Age.pdf")), width = 15)
  par(mfrow=c(1,1))
  for (i in sorted_indices) {
    plot(age, props$Proportions[i,],
         pch=16, cex=3, ylab="Proportions", cex.lab=1.5, cex.axis=1.5,
         cex.main=2, col=age_group_colors)
    abline(a=fit.prop$coefficients[i, 1], b=fit.prop$coefficients[i, 2], col=4,
           lwd=2)
    title(paste0(tissue_name, "-", rownames(props$Proportions)[i], " : Age as Continuous"), cex.main = 1.8, adj = 0)
  }
  #dev.off()

  # Plot Sex
  cat(paste0("##Sex\n"))
  #pdf(file = here("output/plots/", paste0(tissue_name, "_proportions_Sex.pdf")), width = 15)
  par(mfrow=c(1,2))
  for (i in sorted_indices) {
    plot(sex, props$Proportions[i,],
         pch=16, cex=3, ylab="Proportions", xlab="Sex", cex.lab=1.5, cex.axis=1.5,
         cex.main=2, col=c("hotpink", "darkblue"))
    abline(a=fit.prop$coefficients[i, 1], b=fit.prop$coefficients[i, 3], col=4,
           lwd=2)
    title(paste0(tissue_name, "-", rownames(props$Proportions)[i]), cex.main = 2, adj = 0)
  }
  #dev.off()

  # Print the tables
  cat(paste0("## Transformed proportions Toptable results: ", tissue_name, "\n"))
  print(knitr::kable(toptable.transformedProps, caption = paste0("Transformed proportions Toptable results: ", tissue_name)))

  cat(paste0("## Proportions Toptable results: ", tissue_name, "\n"))
  print(knitr::kable(toptable.props, caption = paste0("Proportions Toptable results: ", tissue_name)))
}
Bronchial_brushings
Age as Continuous
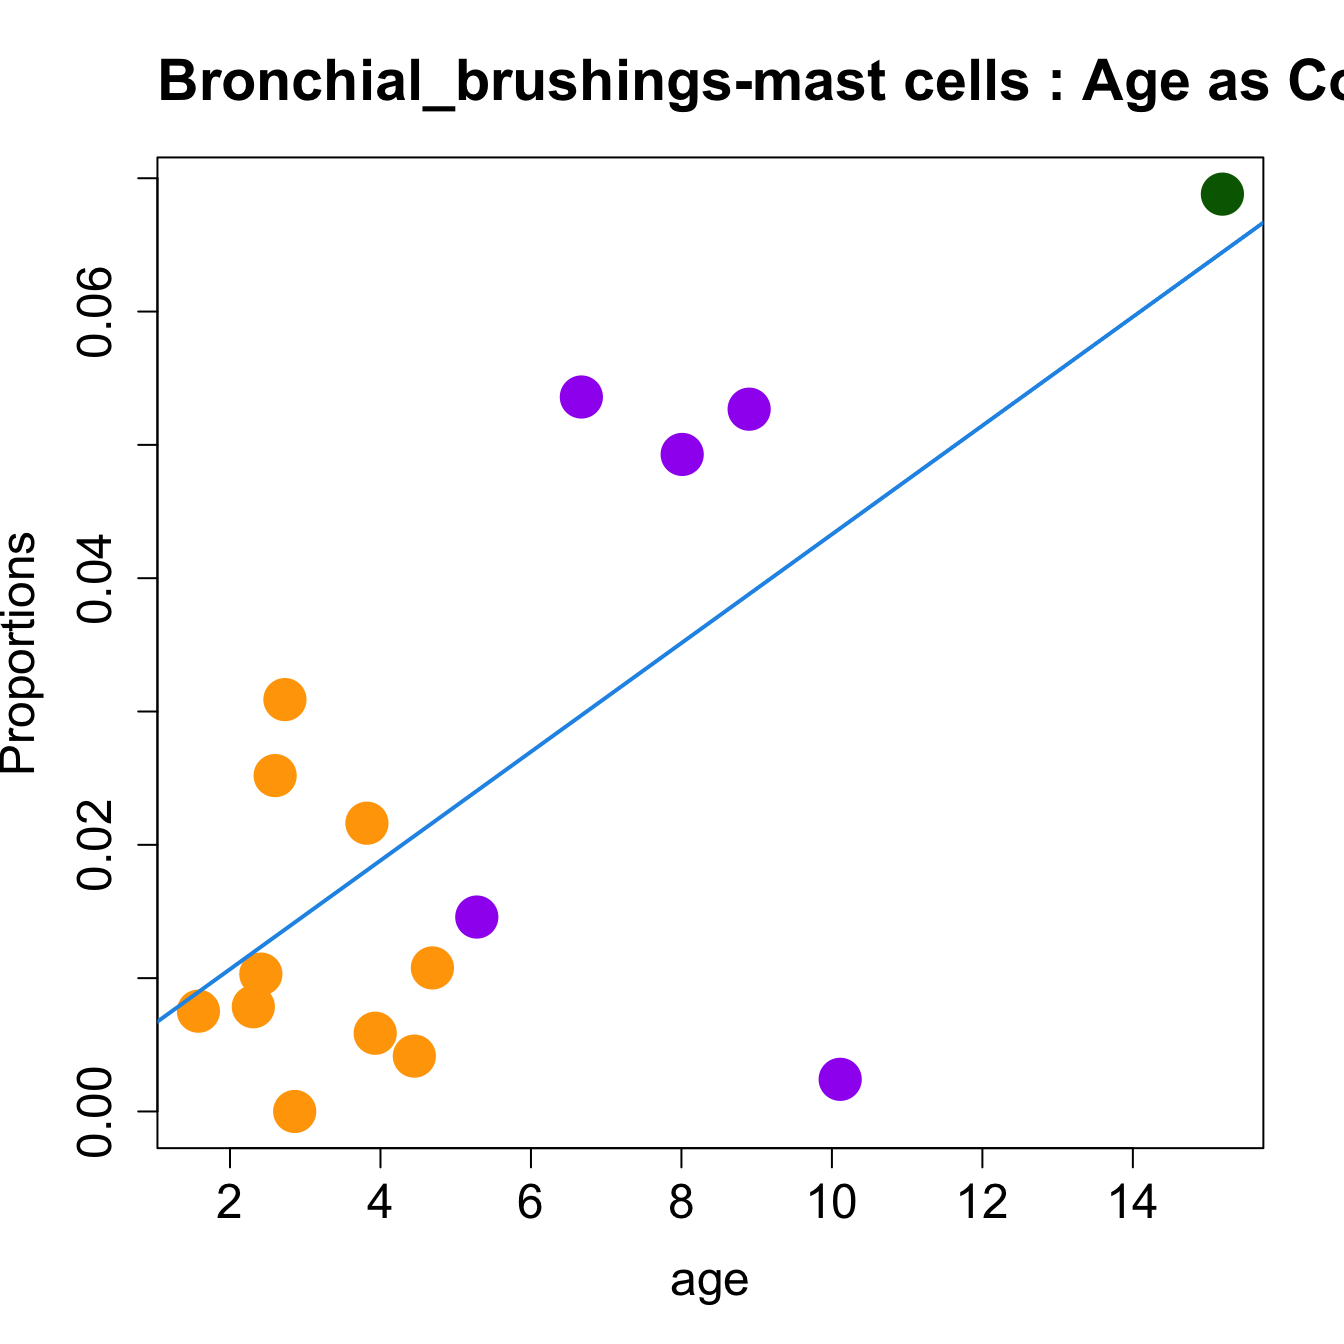
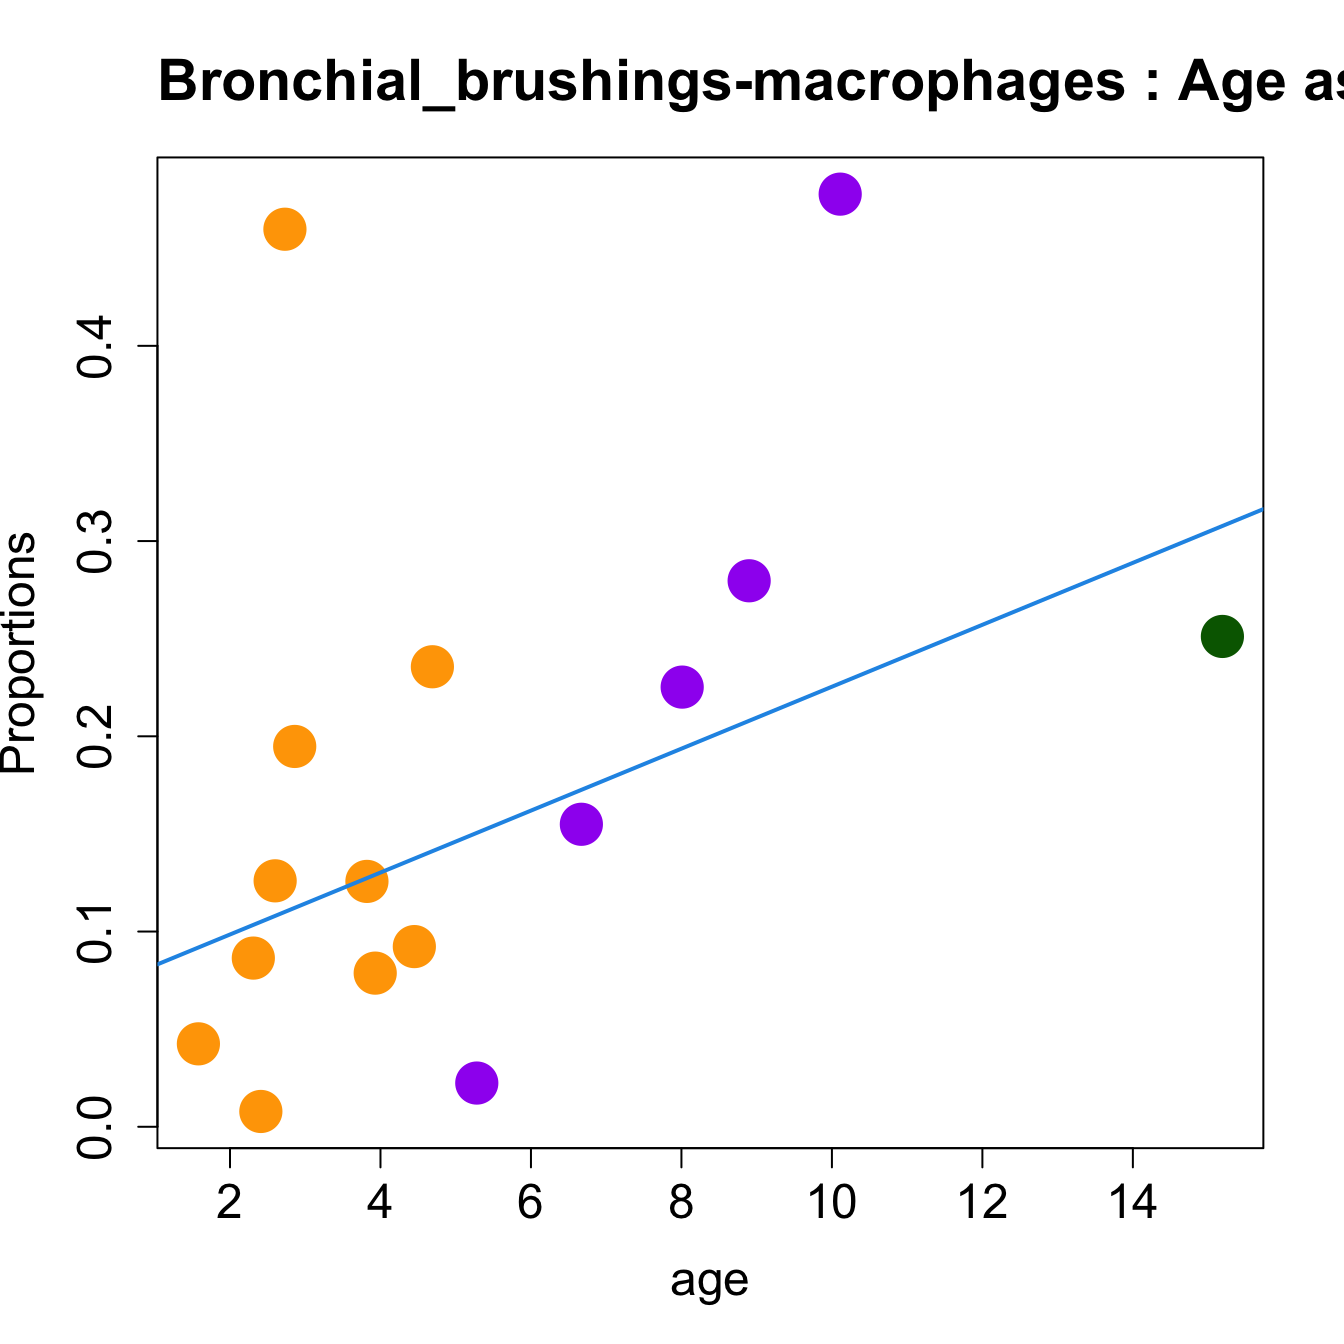
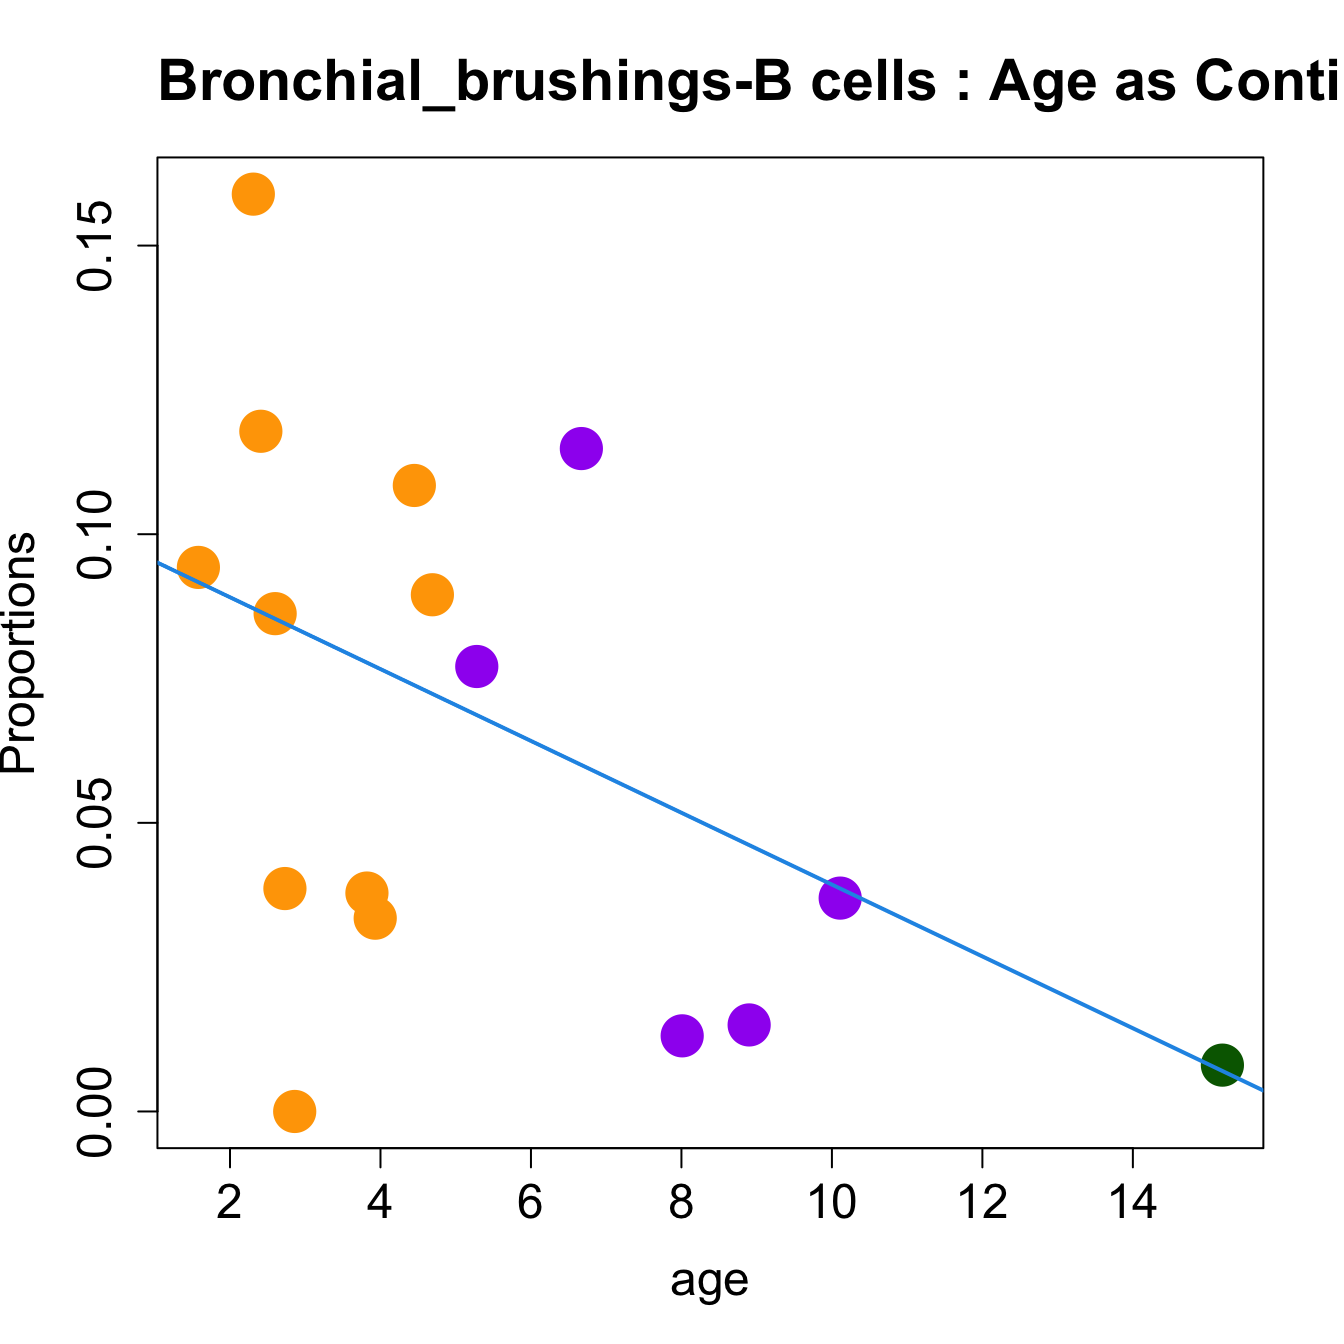
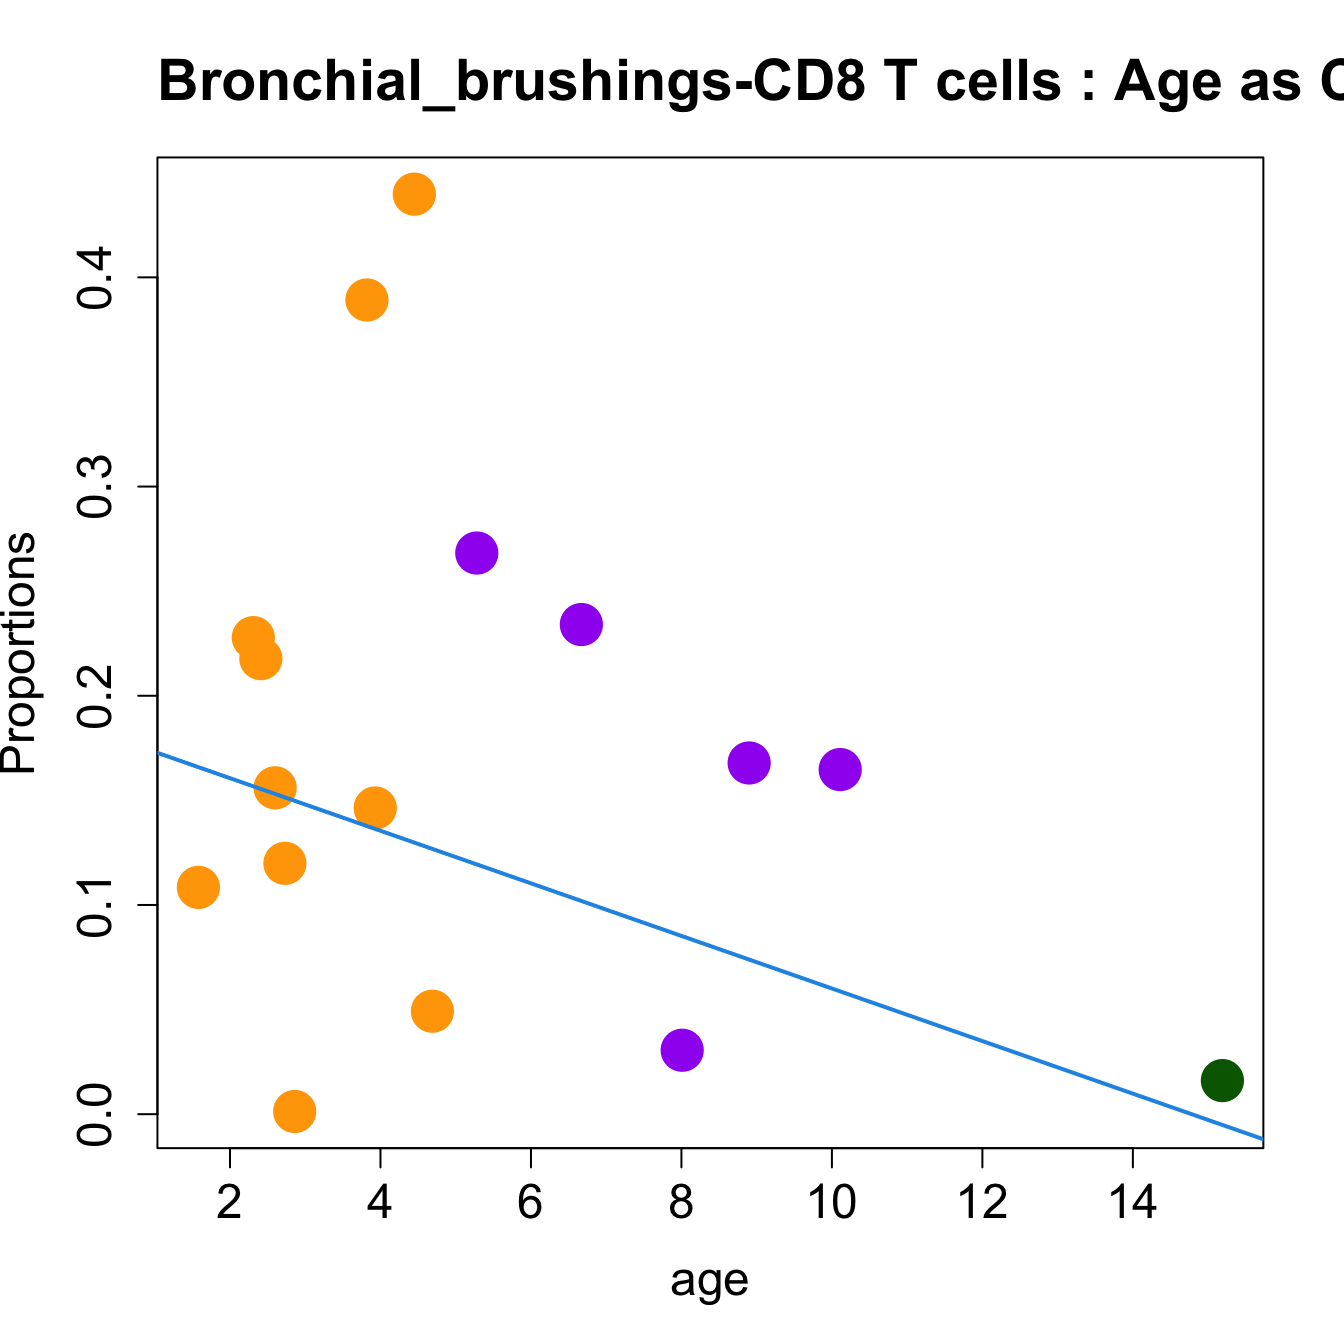
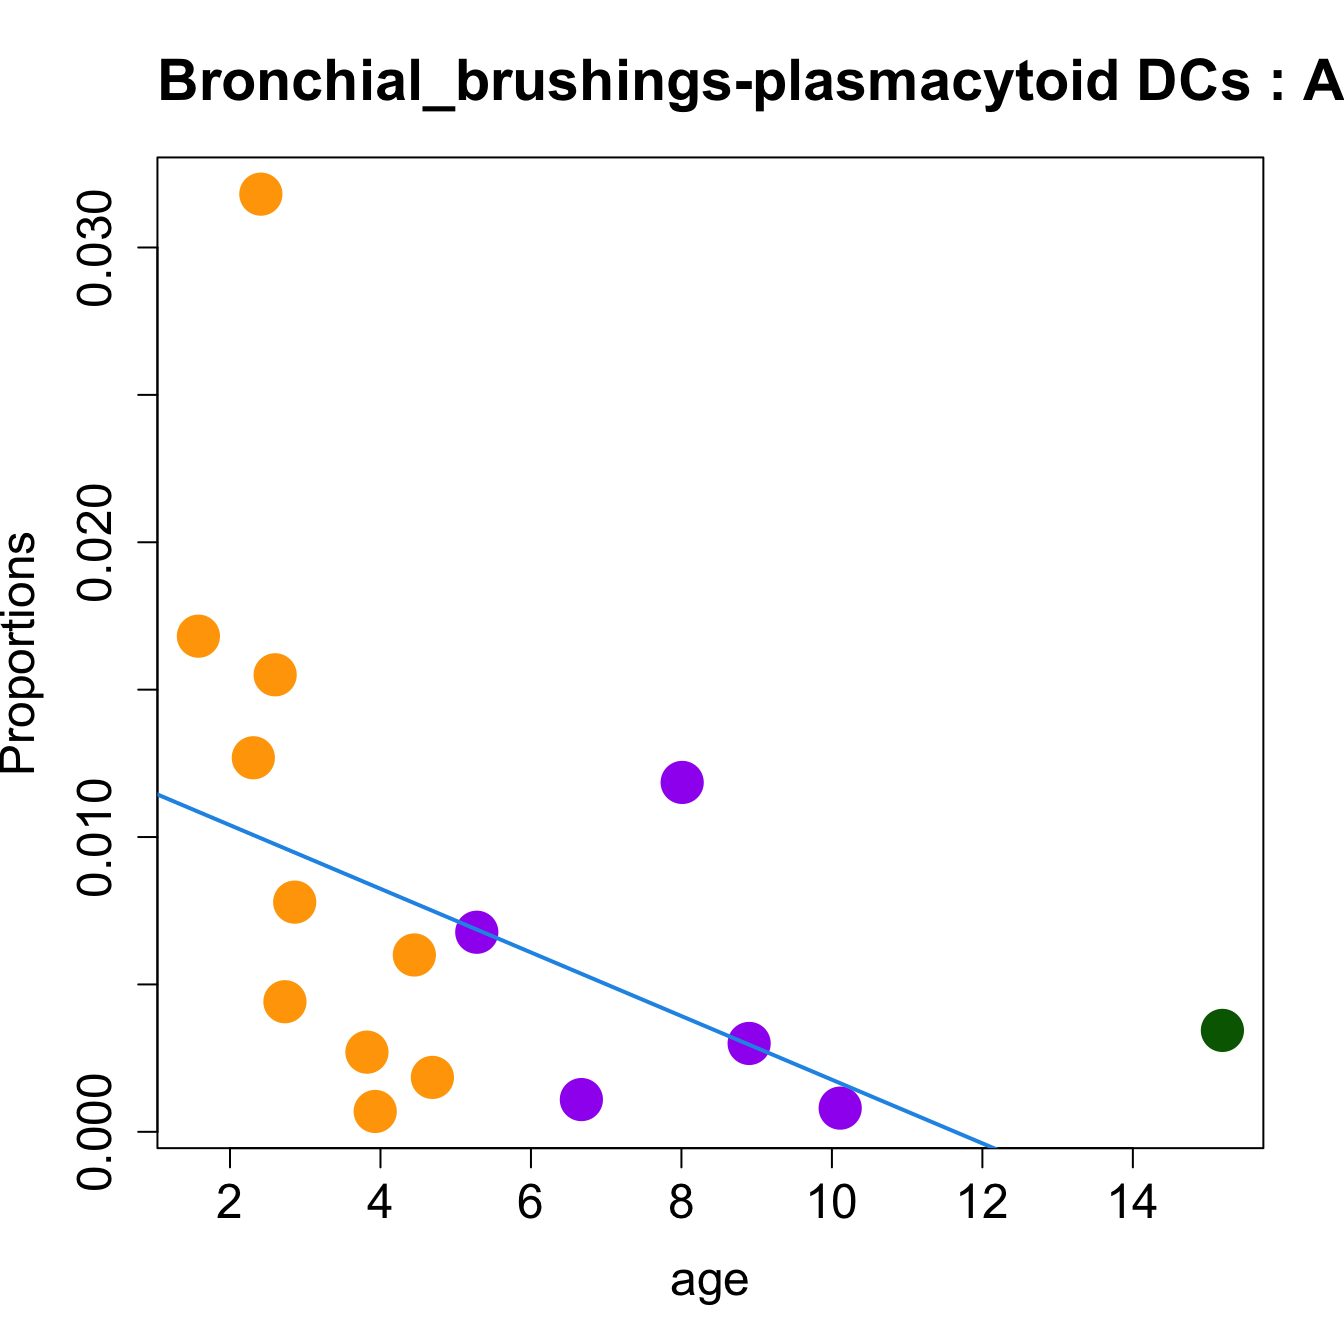
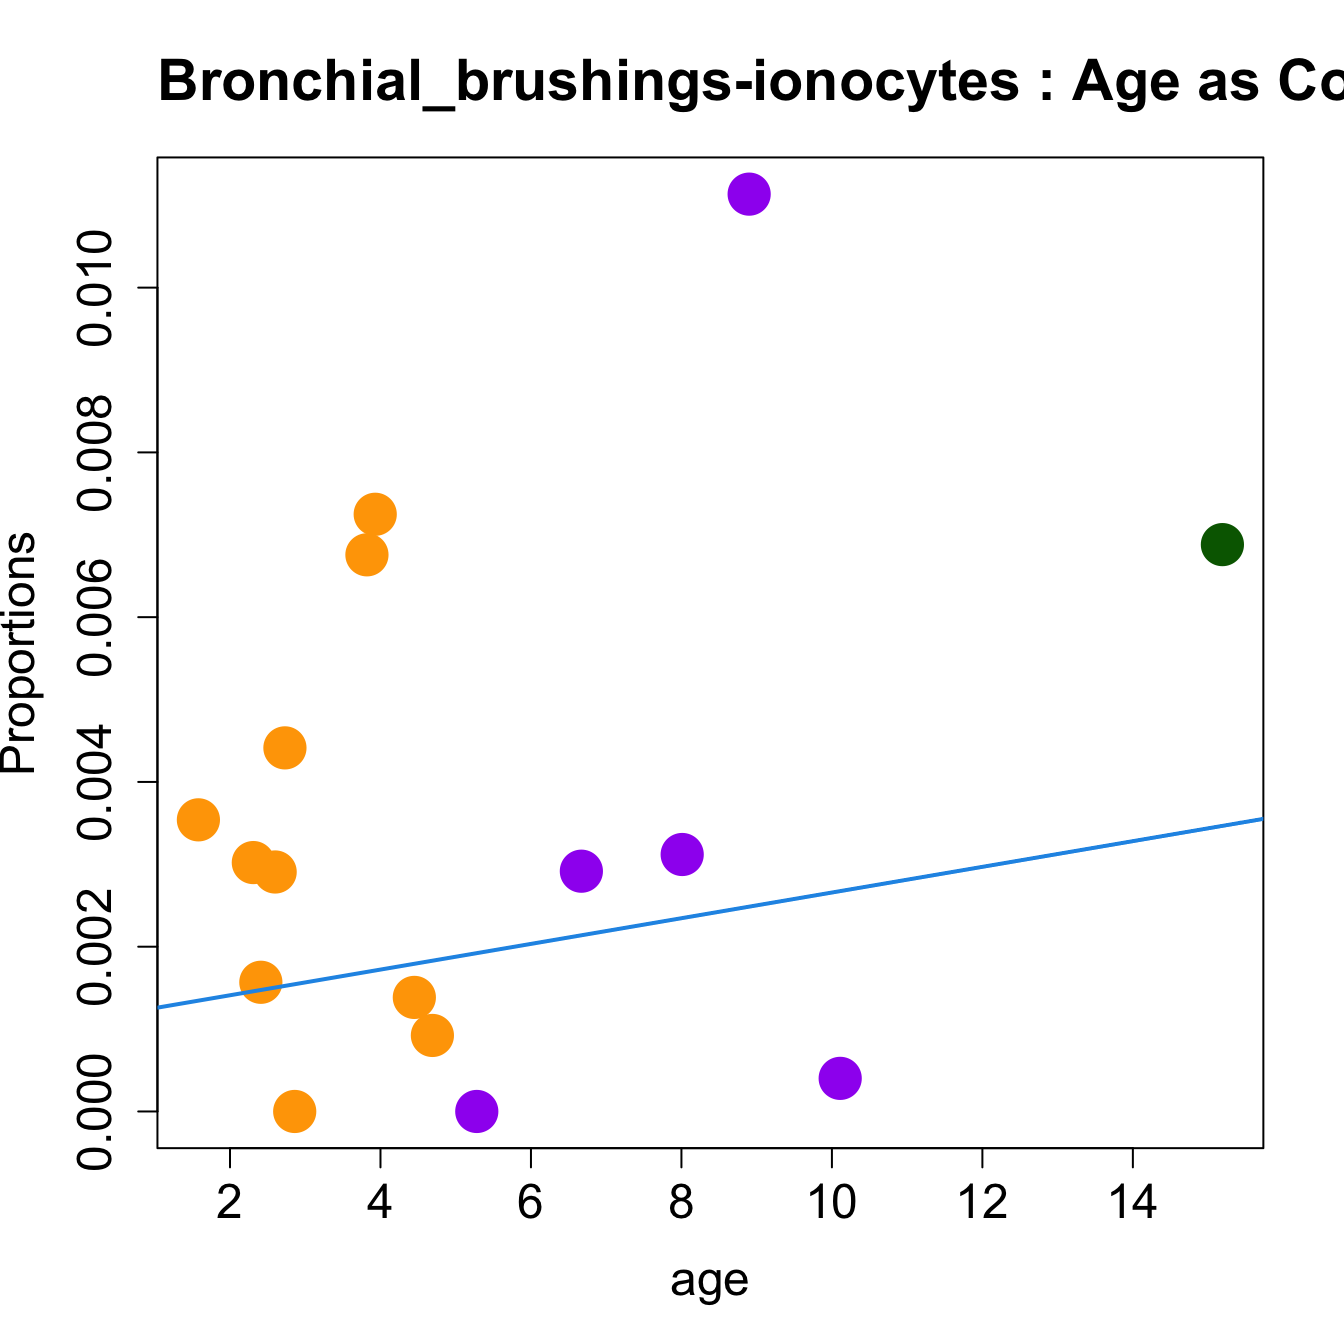
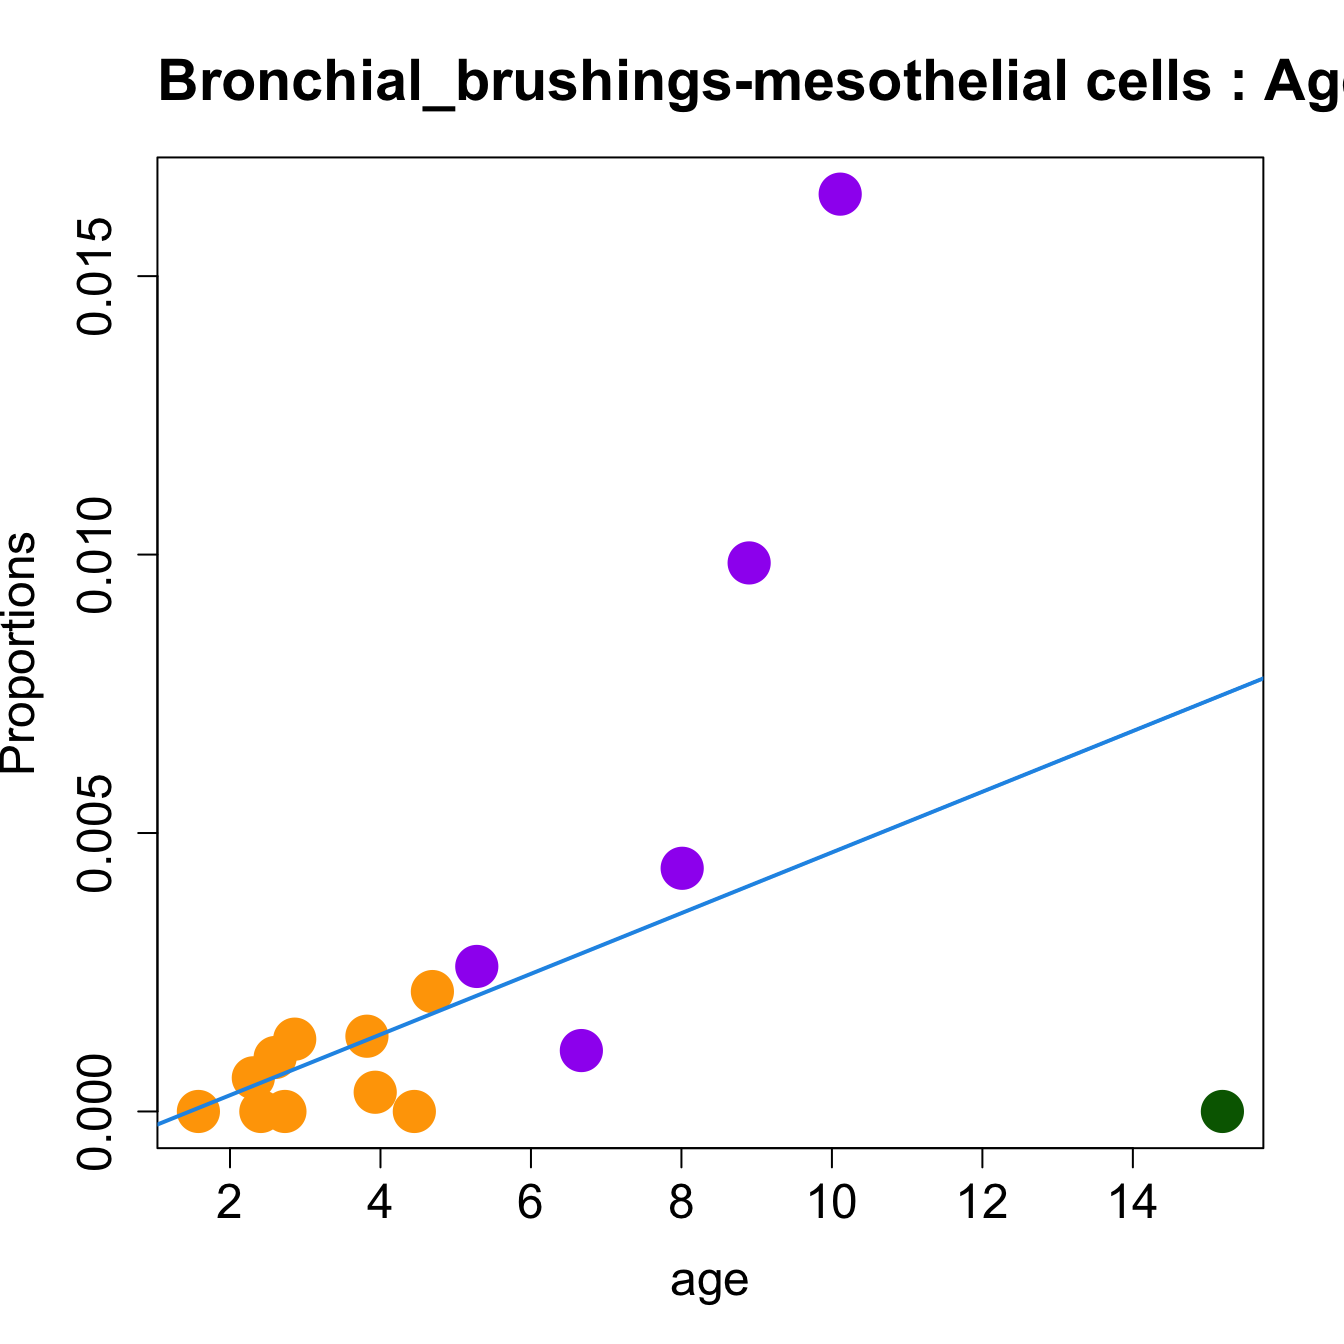
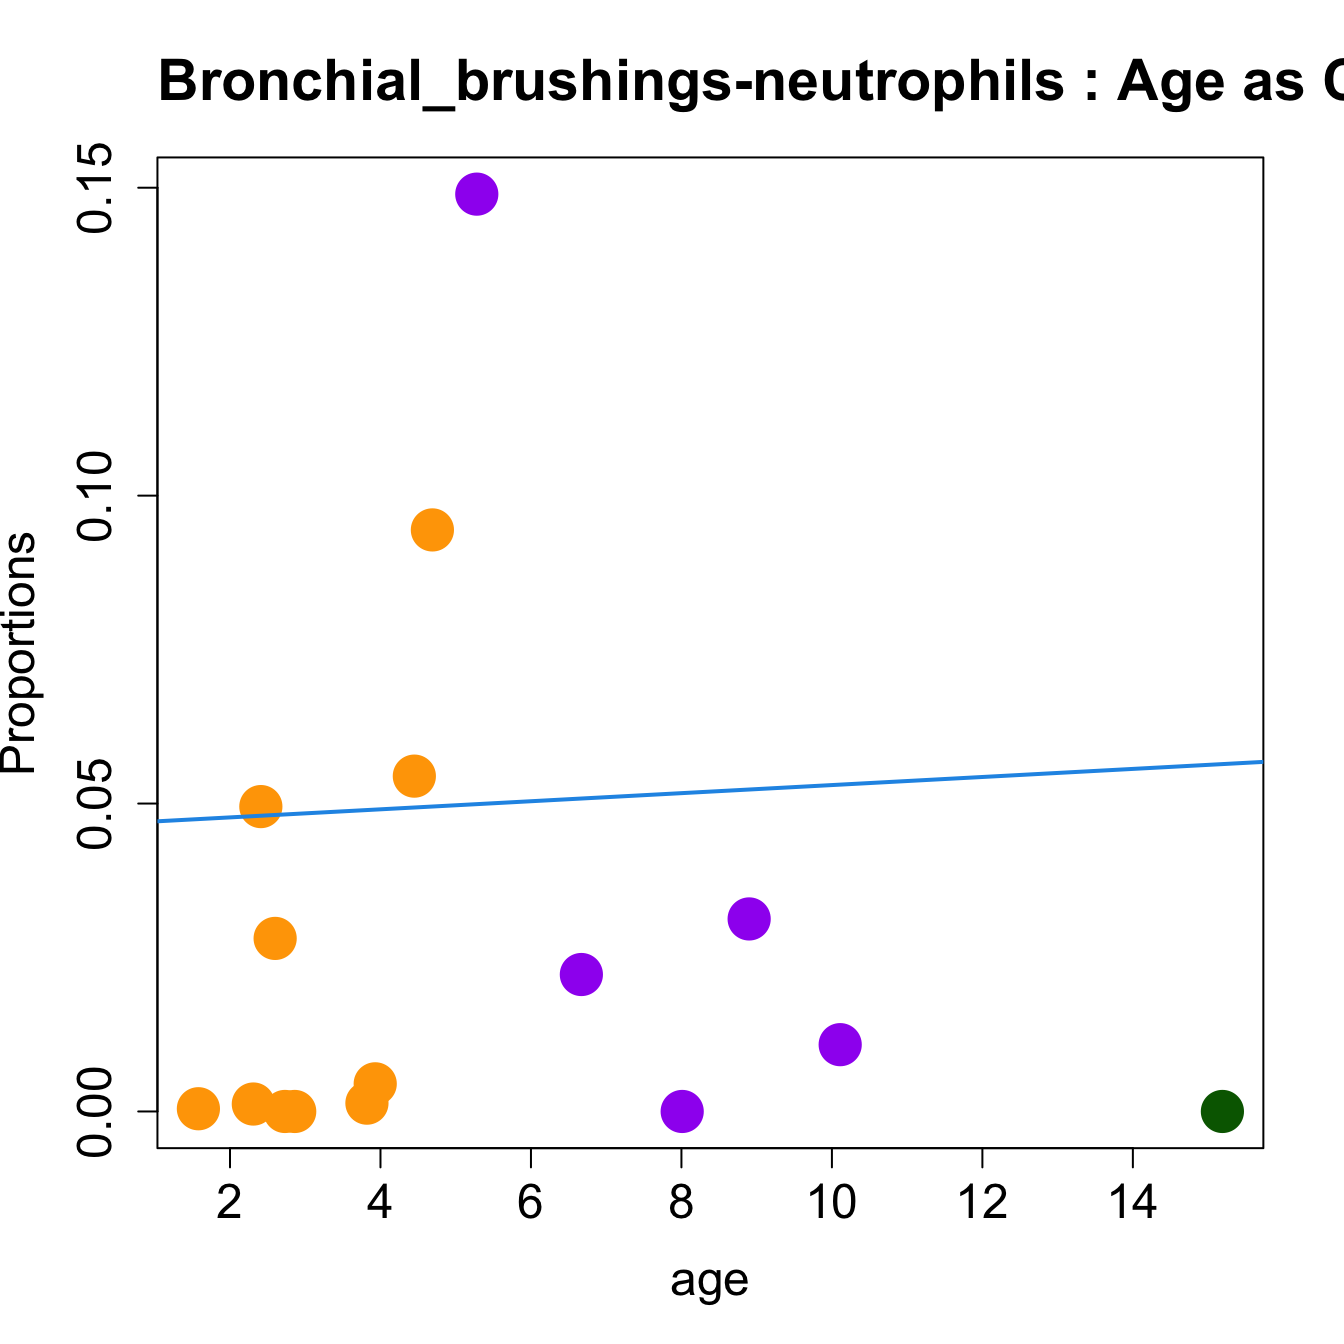
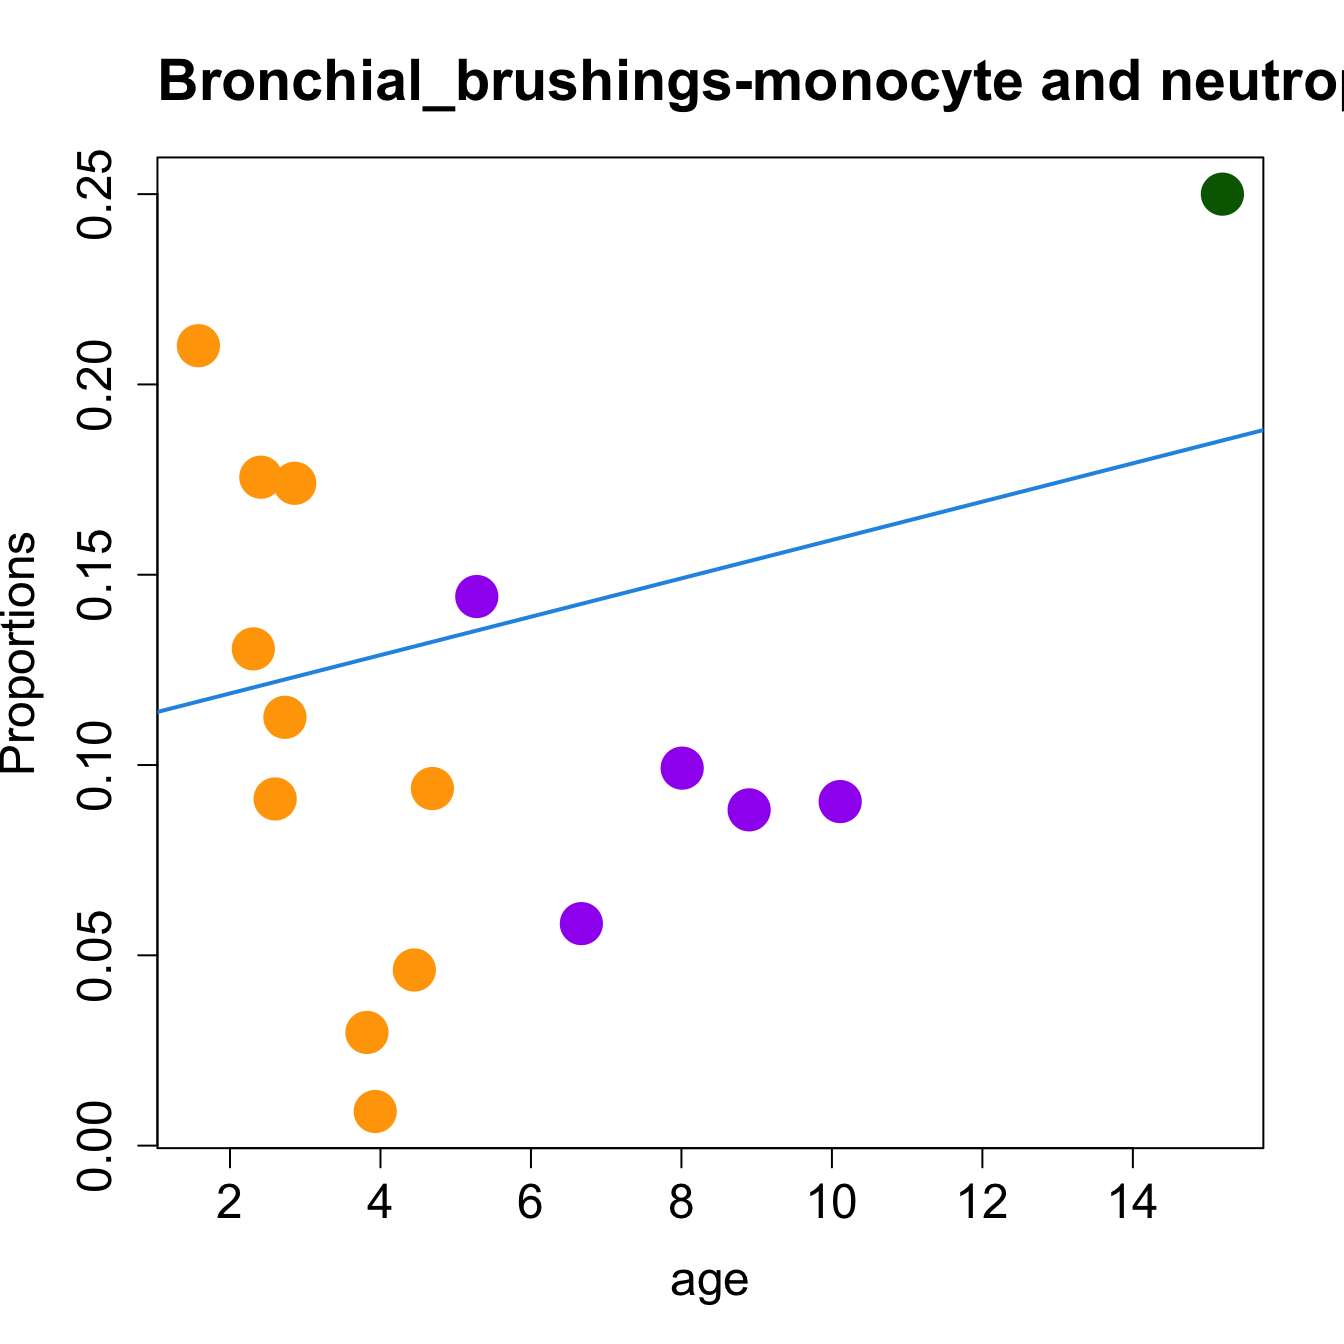
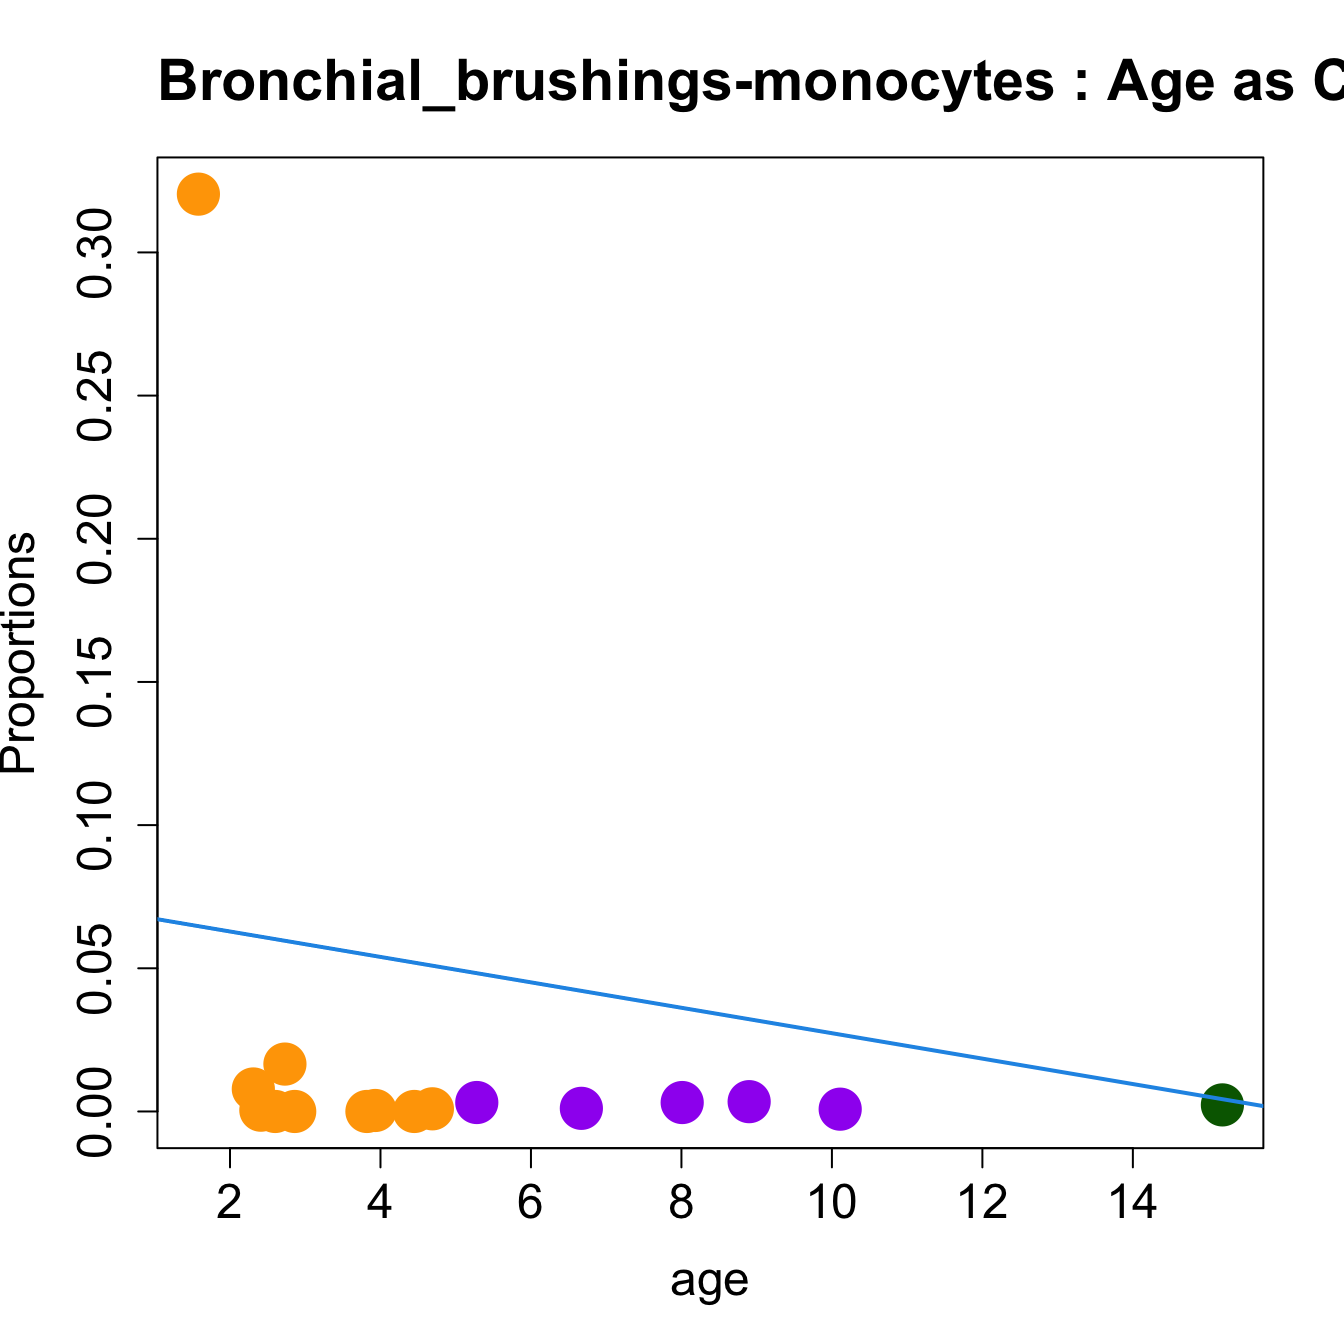 ##Sex
##Sex
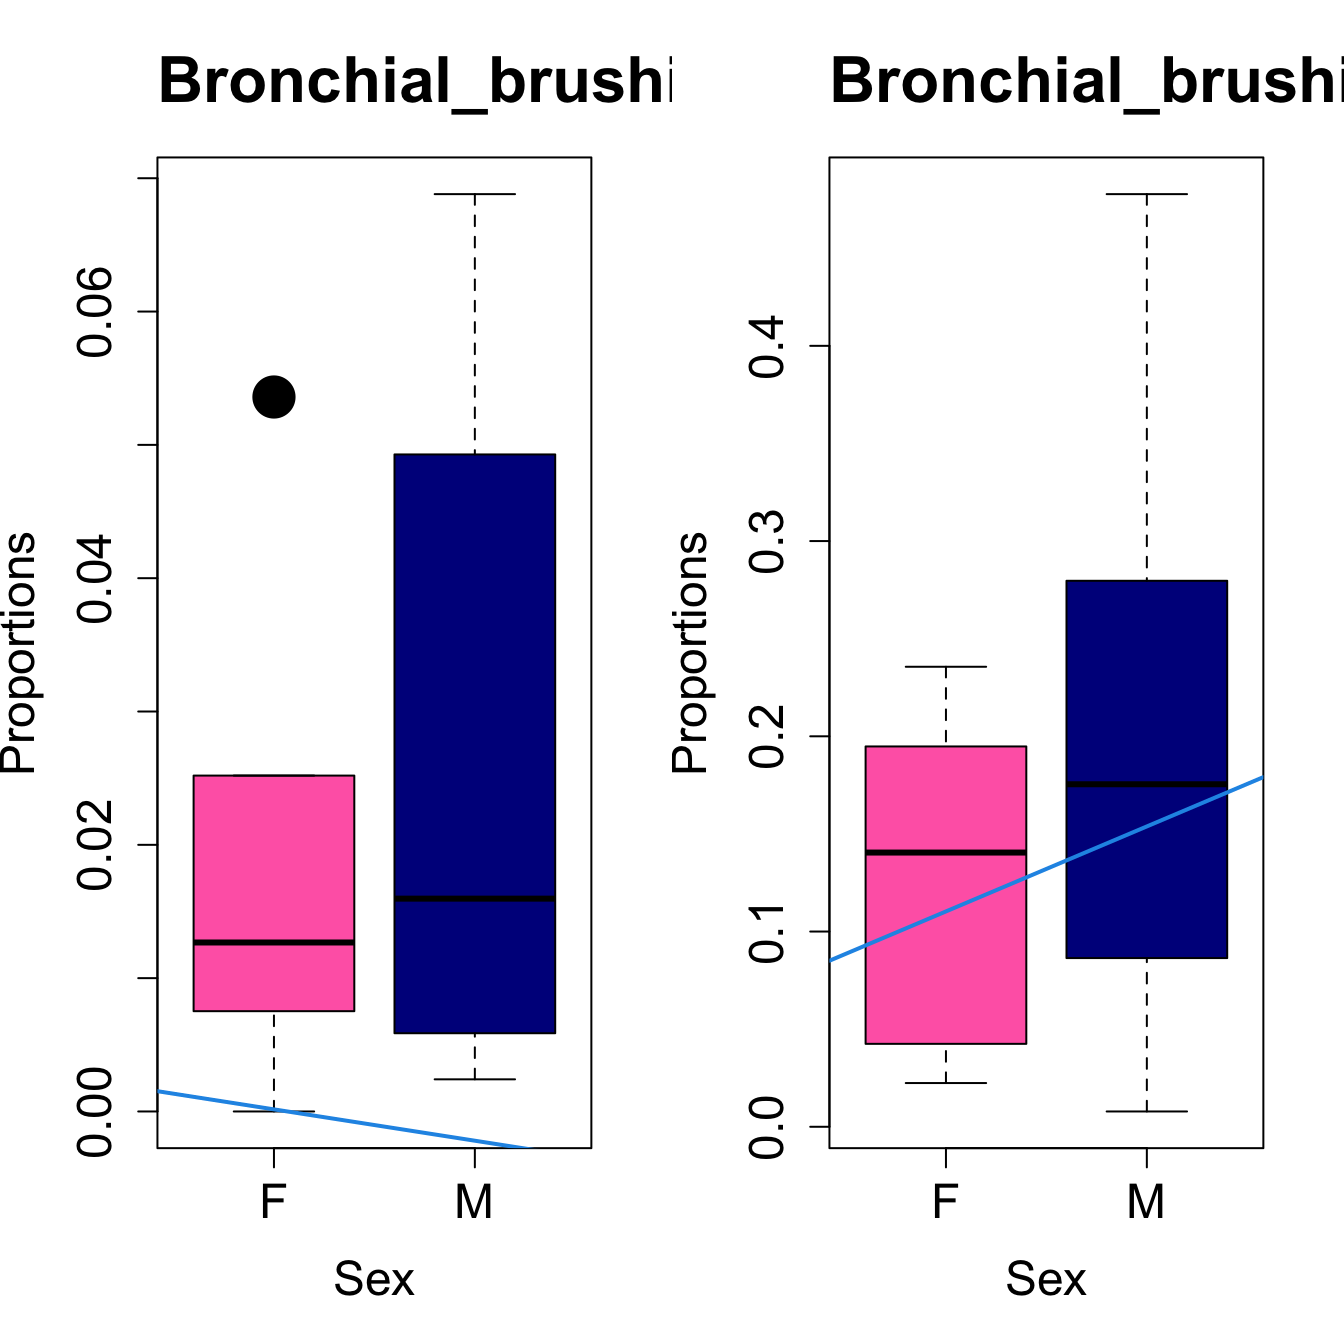
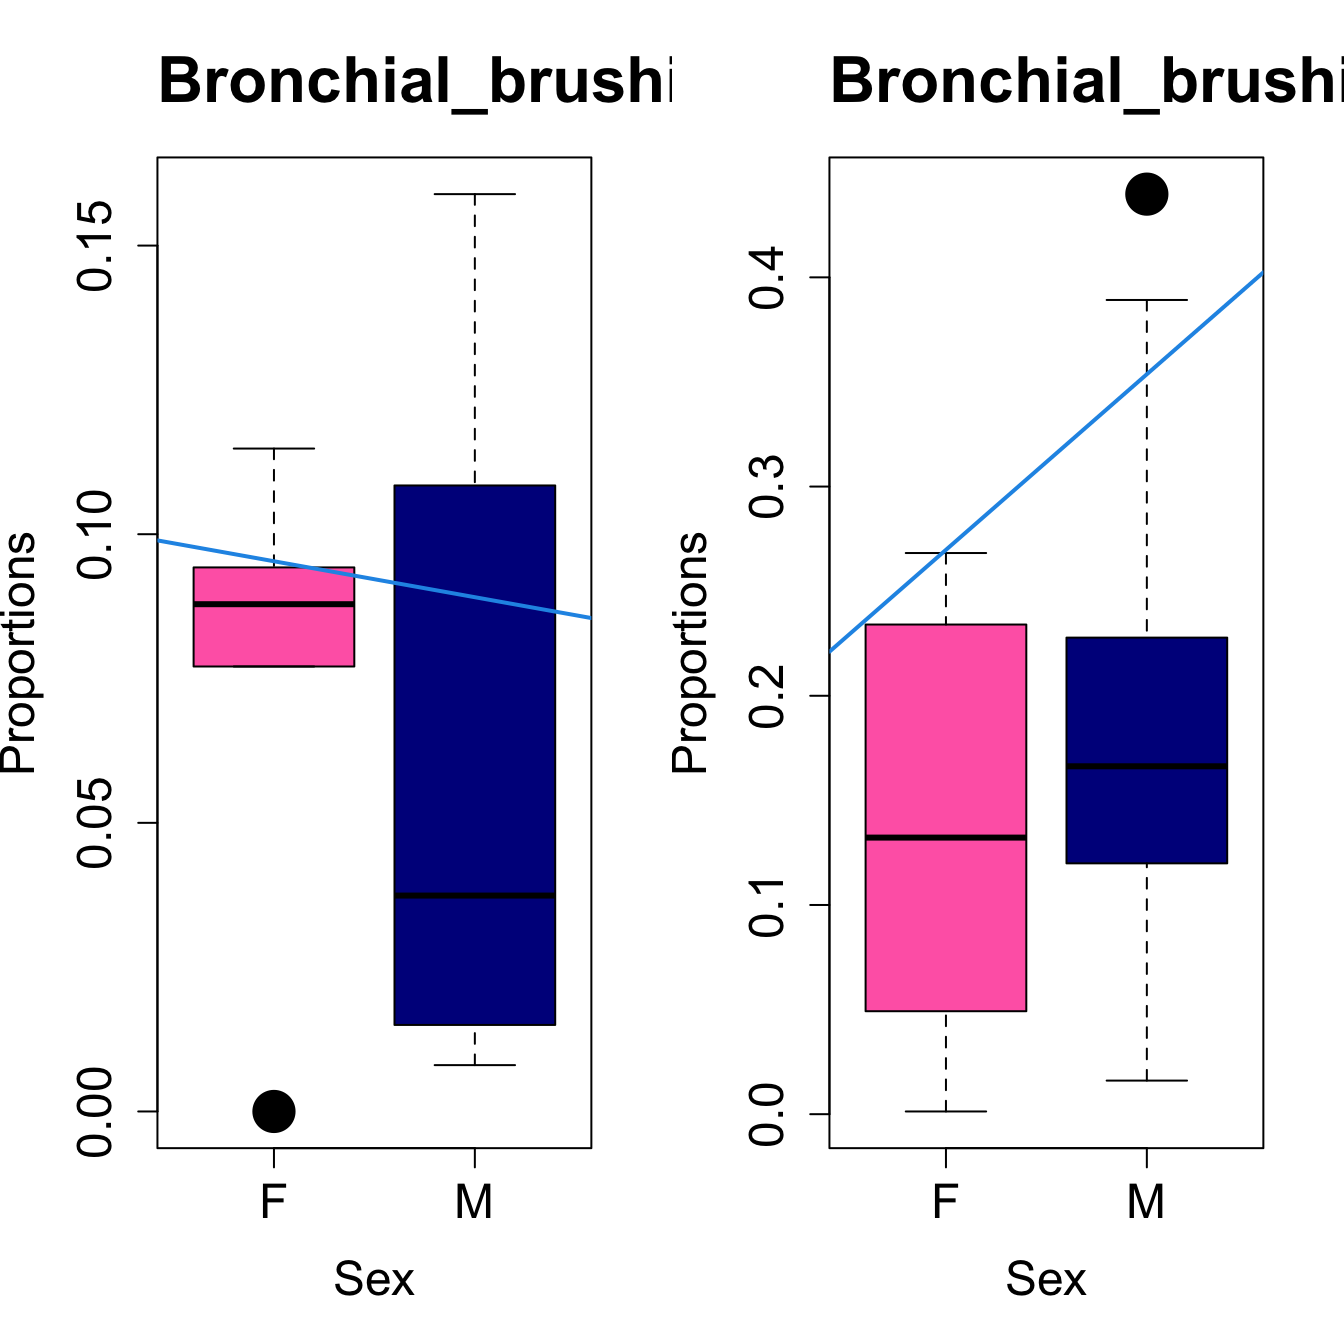
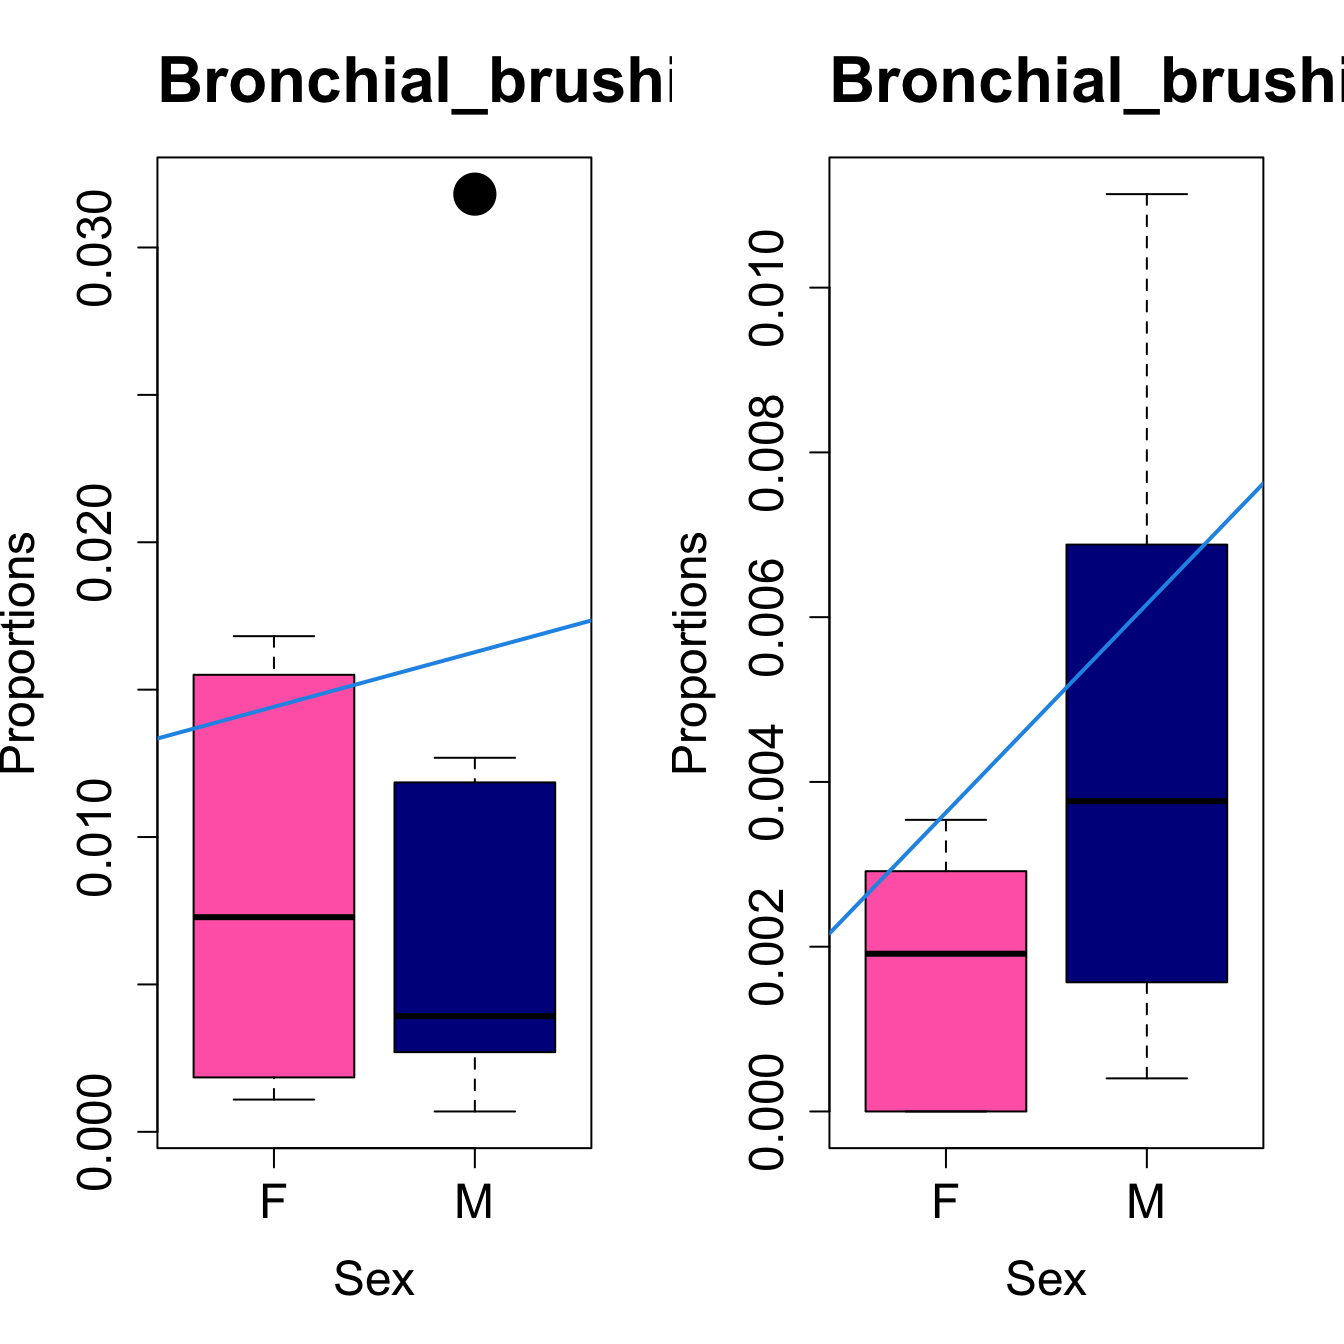
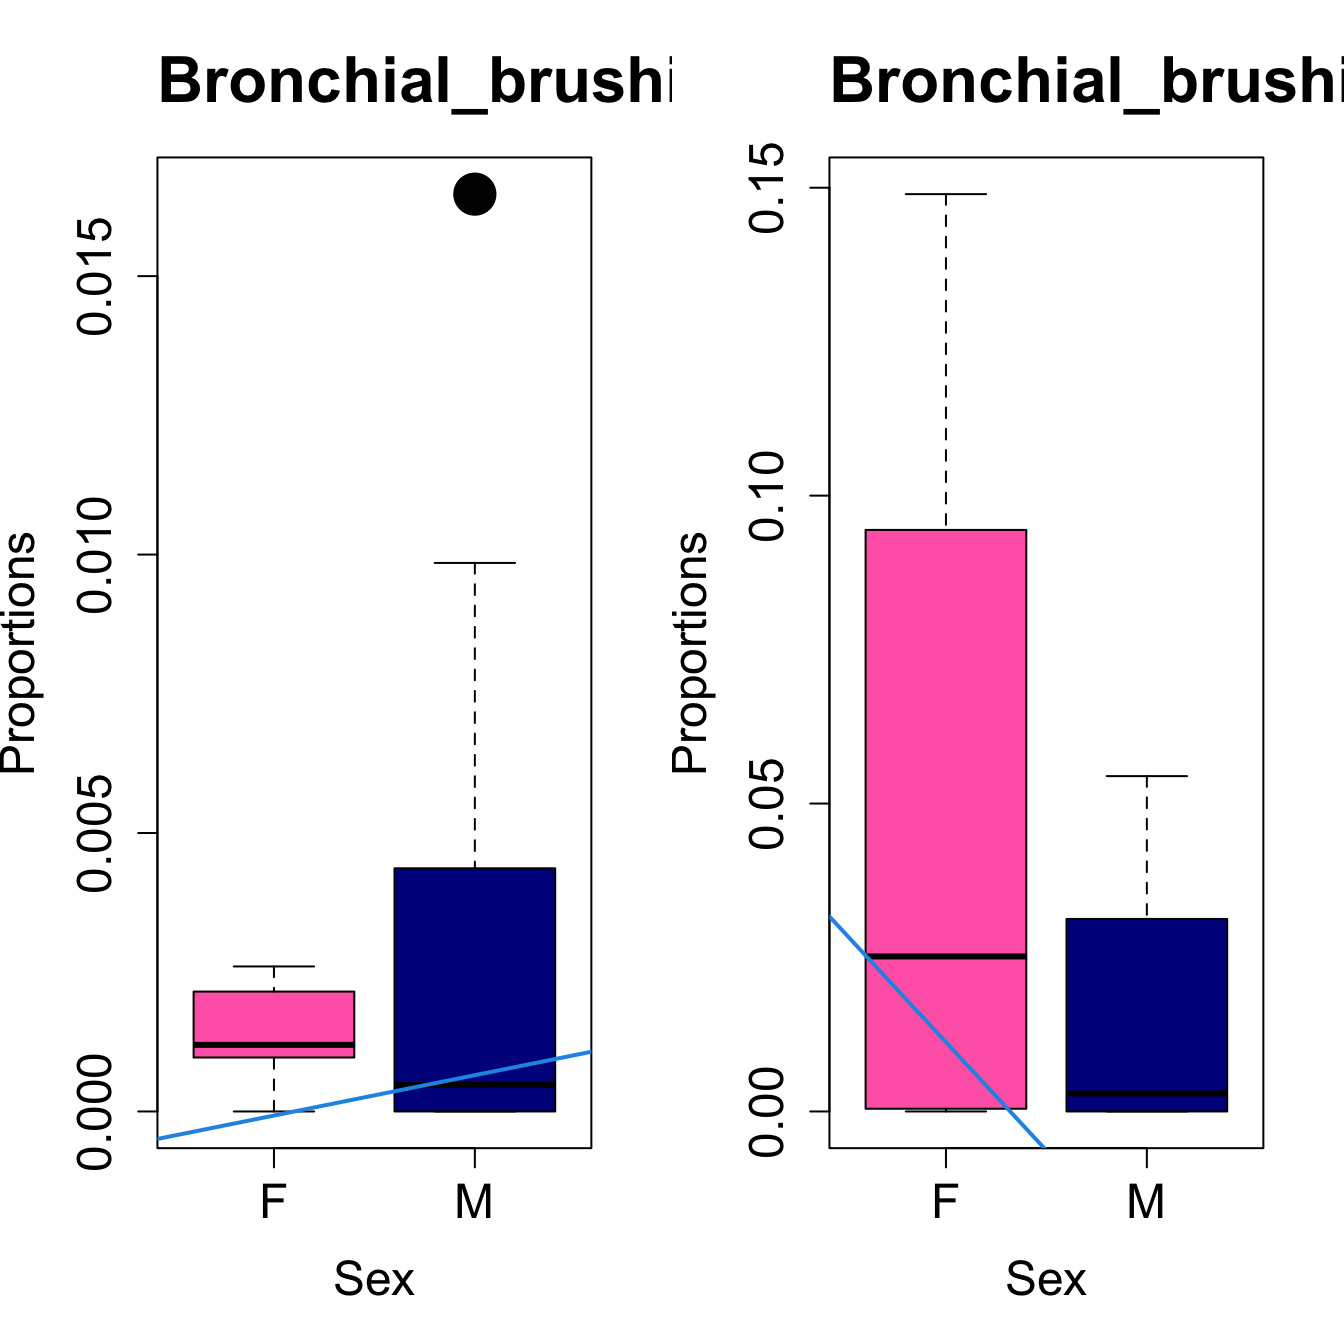
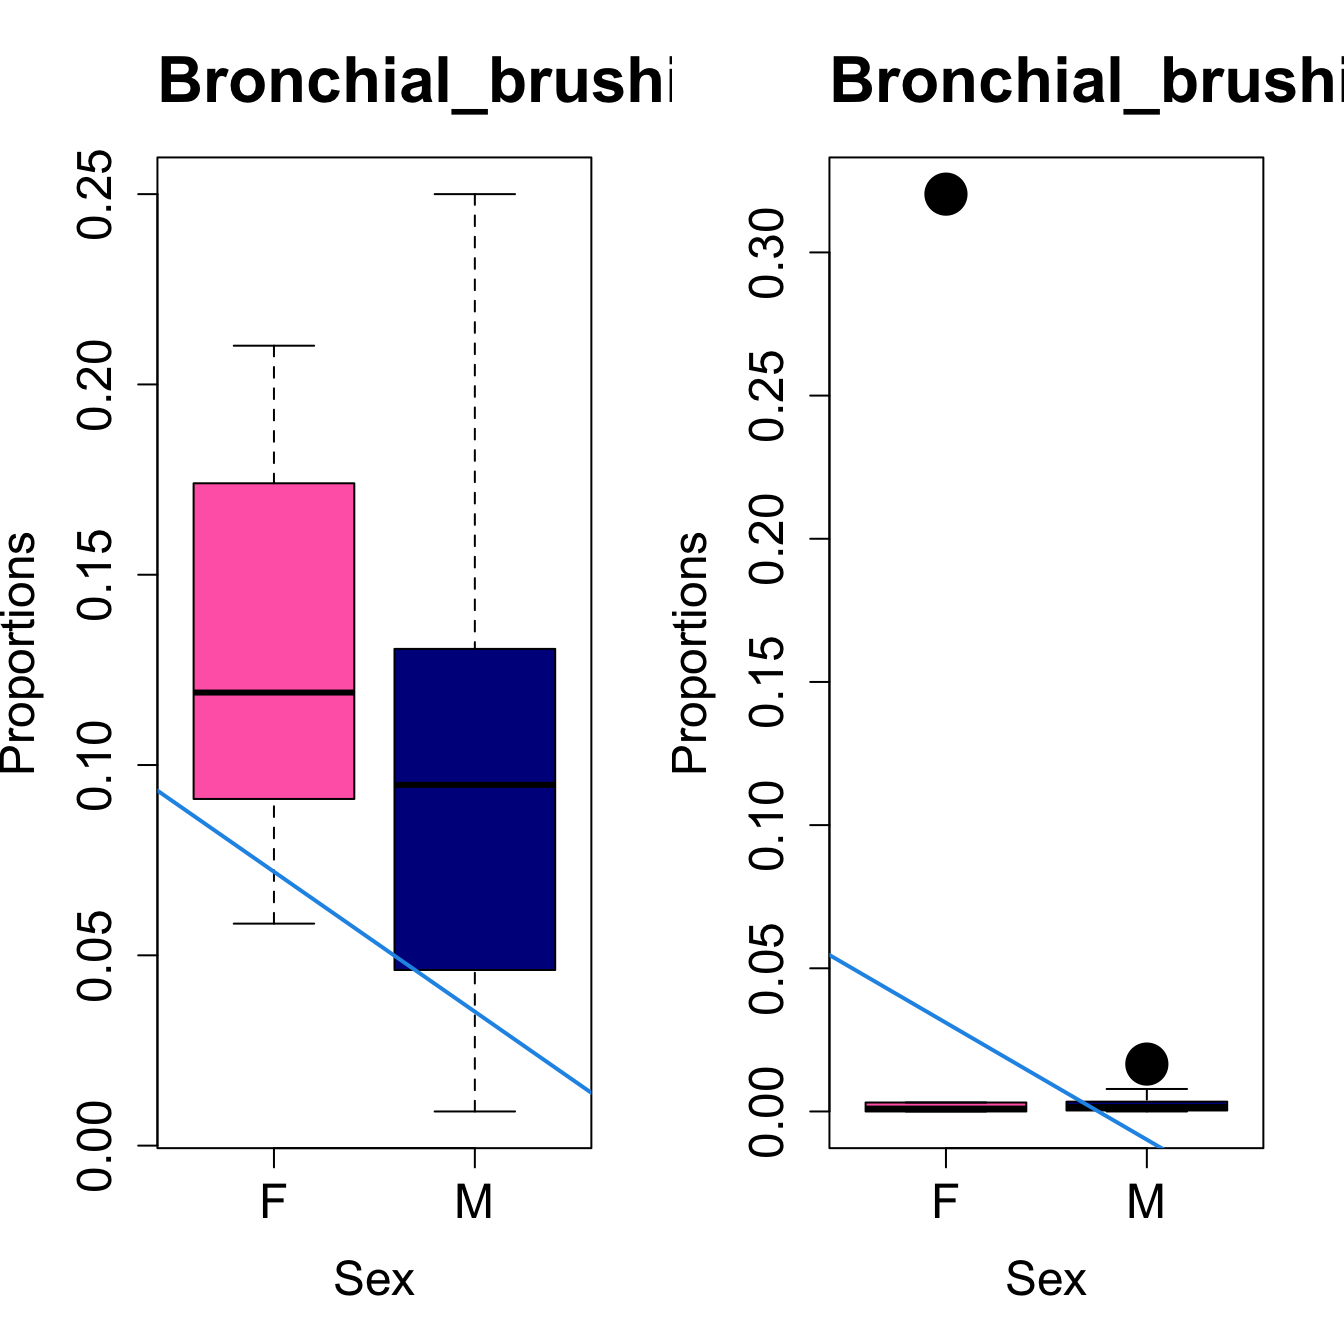 ##
Transformed proportions Toptable results: Bronchial_brushings
##
Transformed proportions Toptable results: Bronchial_brushings
| age | sexM | AveExpr | F | P.Value | adj.P.Val | |
|---|---|---|---|---|---|---|
| mast cells | 0.0116466 | -0.0009733 | 0.1331685 | 2.9266155 | 0.0847851 | 0.6701451 |
| macrophages | 0.0234778 | 0.0419536 | 0.4072729 | 2.3302894 | 0.1321037 | 0.6701451 |
| B cells | -0.0141048 | -0.0058262 | 0.2334501 | 1.8926890 | 0.1856016 | 0.6701451 |
| CD8 T cells | -0.0198651 | 0.1297779 | 0.3950899 | 1.6714969 | 0.2217707 | 0.6701451 |
| plasmacytoid DCs | -0.0056202 | 0.0055107 | 0.0791936 | 1.4637702 | 0.2625753 | 0.6701451 |
| ionocytes | 0.0007057 | 0.0284909 | 0.0517758 | 1.4147059 | 0.2736107 | 0.6701451 |
| mesothelial cells | 0.0043385 | -0.0052527 | 0.0357439 | 1.0080158 | 0.3883600 | 0.6701451 |
| neutrophils | 0.0008549 | -0.0884807 | 0.1205195 | 0.9991736 | 0.3918576 | 0.6701451 |
| monocyte and neutrophil-like | 0.0081777 | -0.0699999 | 0.3273618 | 0.9425358 | 0.4119612 | 0.6701451 |
| monocytes | -0.0074533 | -0.0586614 | 0.0730773 | 0.7869357 | 0.4735021 | 0.6701451 |
Proportions Toptable results: Bronchial_brushings
| age | sexM | AveExpr | F | P.Value | adj.P.Val | |
|---|---|---|---|---|---|---|
| mast cells | 0.0040779 | -0.0023539 | 0.0228456 | 5.3363097 | 0.0192908 | 0.2893622 |
| B cells | -0.0062234 | -0.0062298 | 0.0643829 | 2.2769239 | 0.1401883 | 0.6266495 |
| macrophages | 0.0158633 | 0.0435442 | 0.1787851 | 2.0869250 | 0.1618952 | 0.6266495 |
| plasmacytoid DCs | -0.0010796 | 0.0018541 | 0.0079512 | 1.5407623 | 0.2489559 | 0.6266495 |
| CD8 T cells | -0.0125703 | 0.0839463 | 0.1710747 | 1.4176603 | 0.2758104 | 0.6266495 |
| neutrophils | 0.0006563 | -0.0351866 | 0.0279557 | 1.3343963 | 0.2955988 | 0.6266495 |
| mesothelial cells | 0.0005451 | 0.0007252 | 0.0025693 | 1.2702643 | 0.3116726 | 0.6266495 |
| monocytes | -0.0044430 | -0.0408158 | 0.0225210 | 1.1034170 | 0.3595967 | 0.6266495 |
| ionocytes | 0.0001560 | 0.0025292 | 0.0035135 | 0.9933136 | 0.3953788 | 0.6266495 |
| monocyte and neutrophil-like | 0.0050388 | -0.0367671 | 0.1126906 | 0.8308037 | 0.4565844 | 0.6266495 |
BAL
Age as Continuous
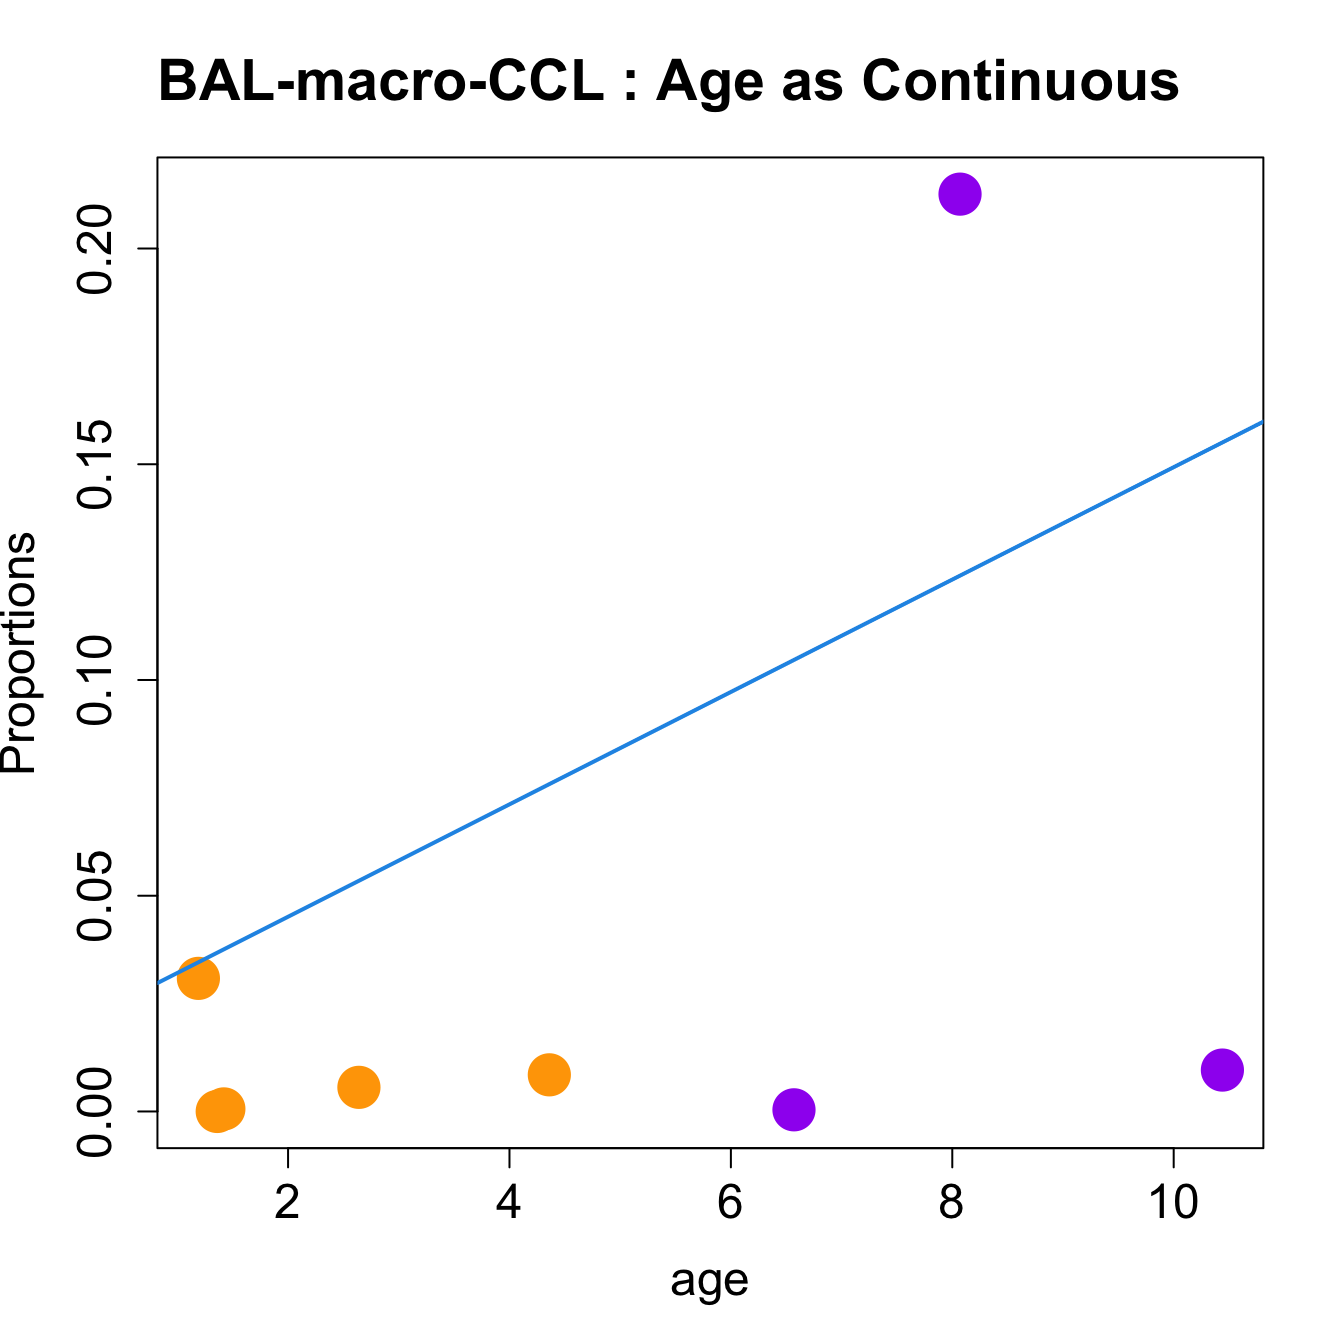
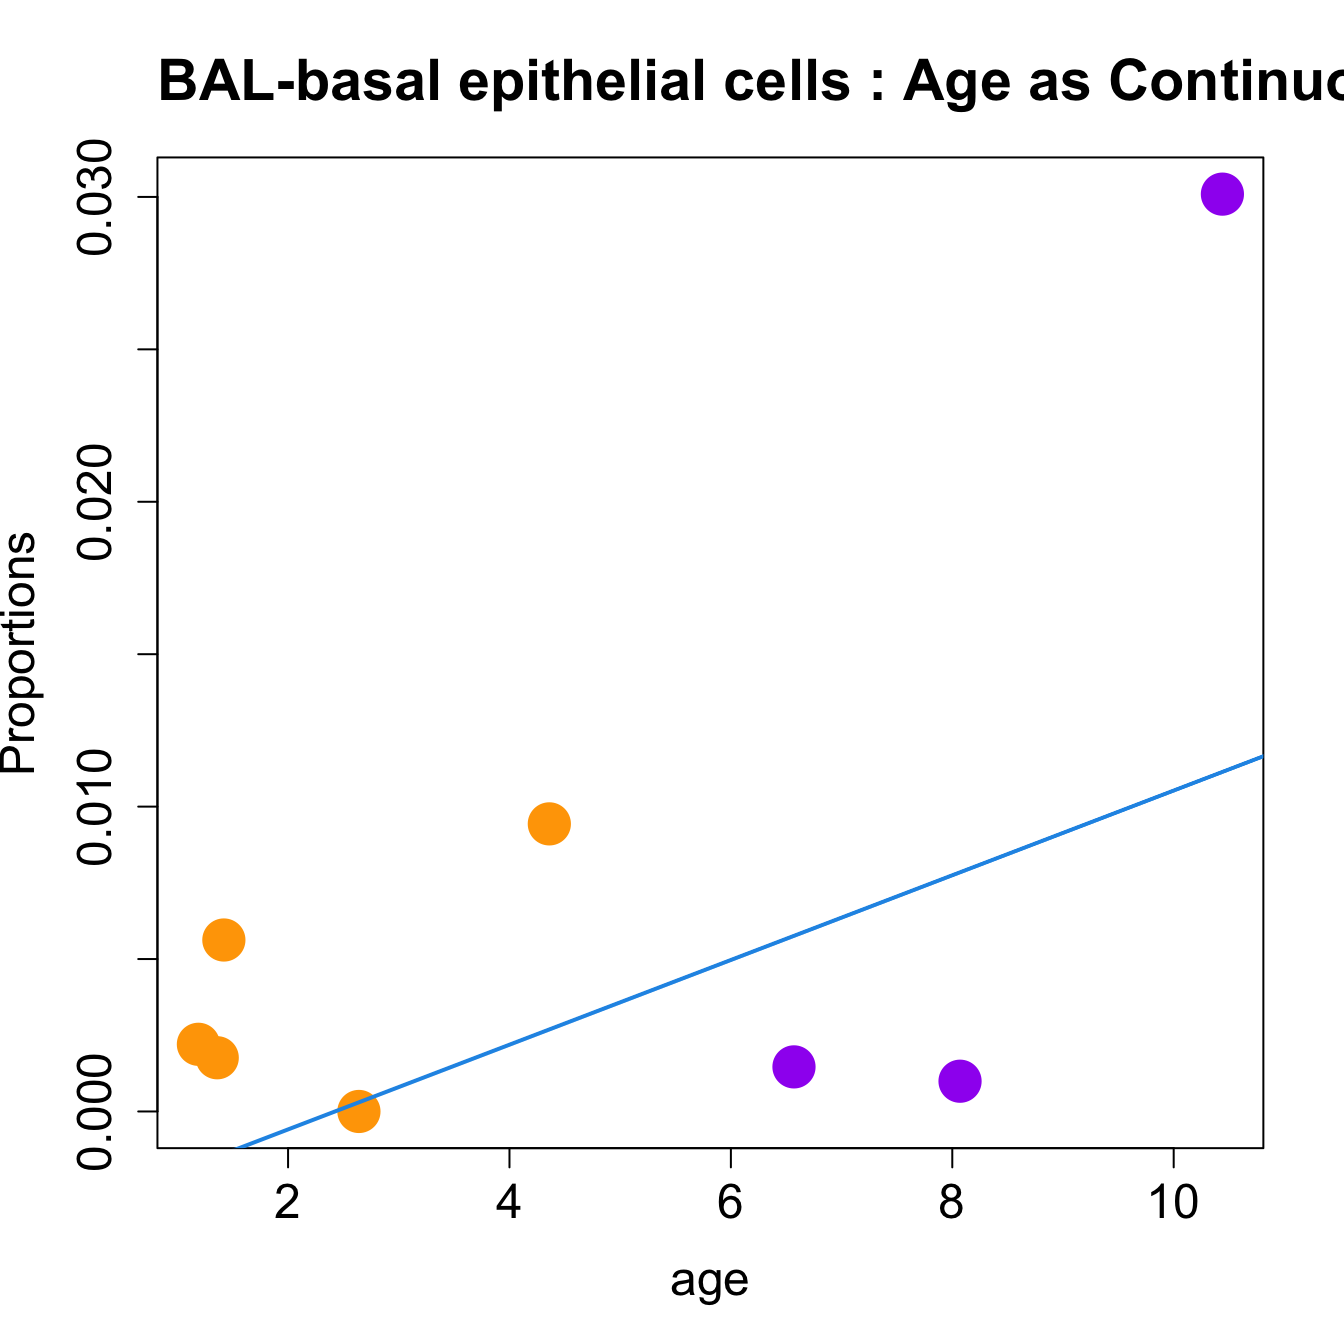
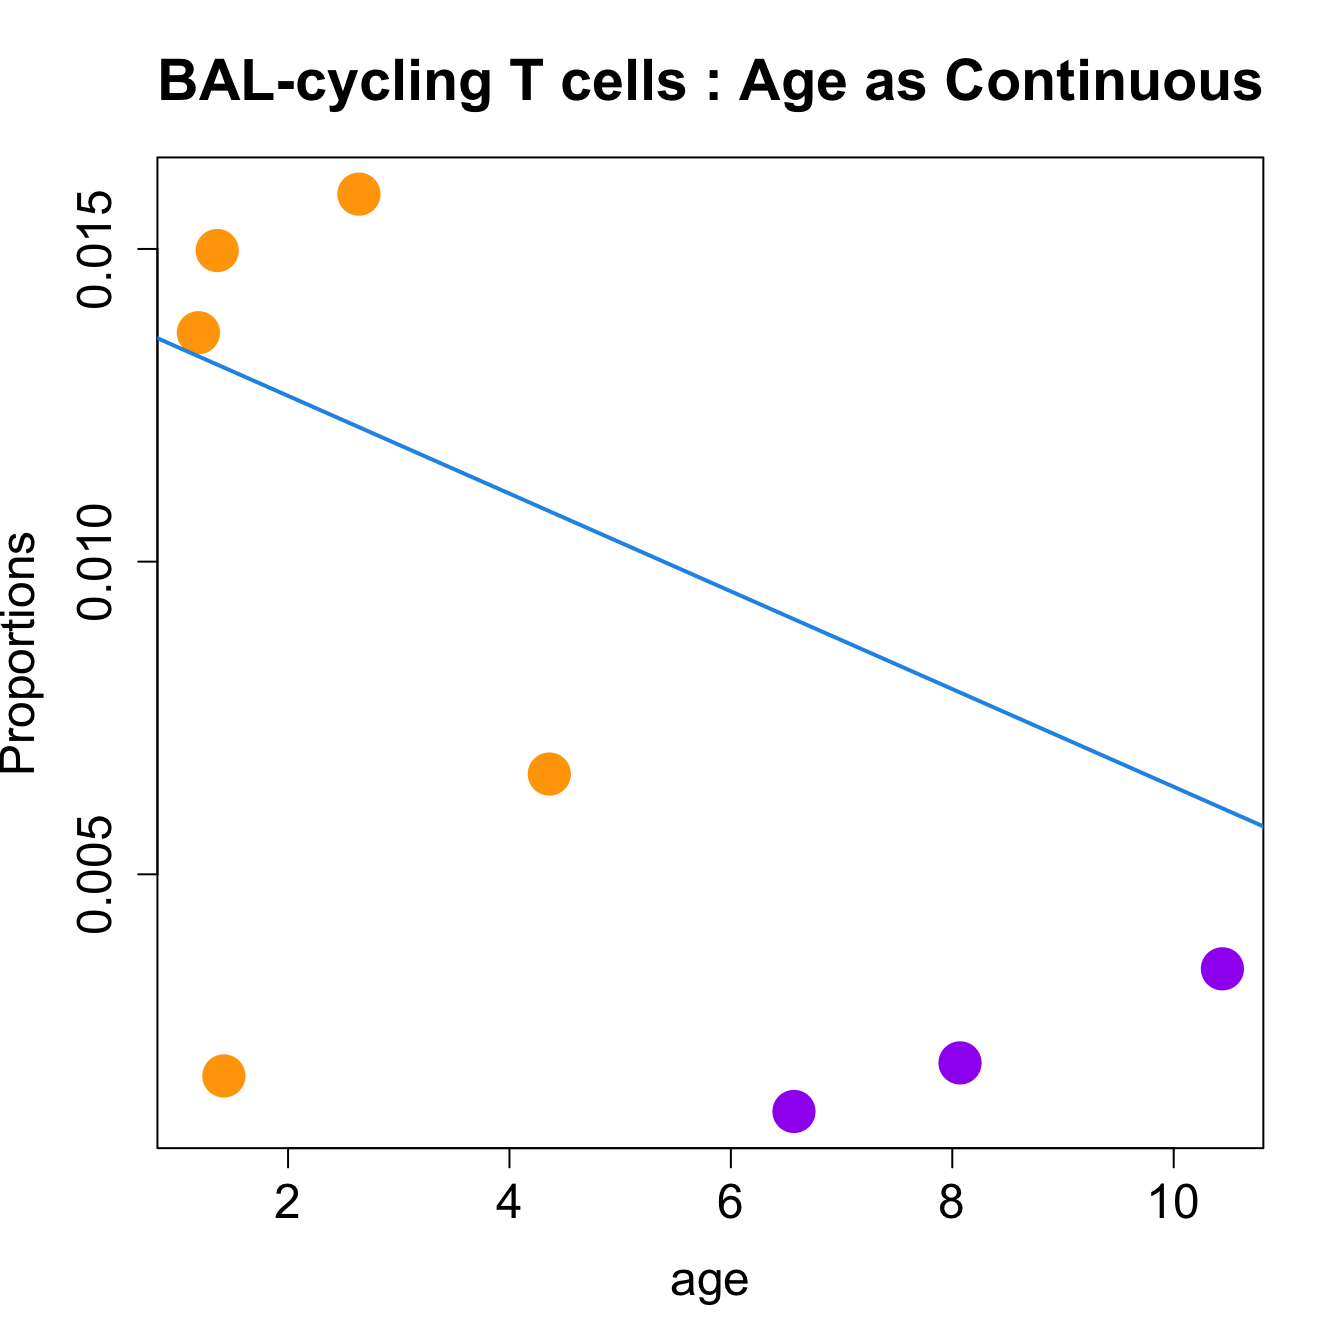
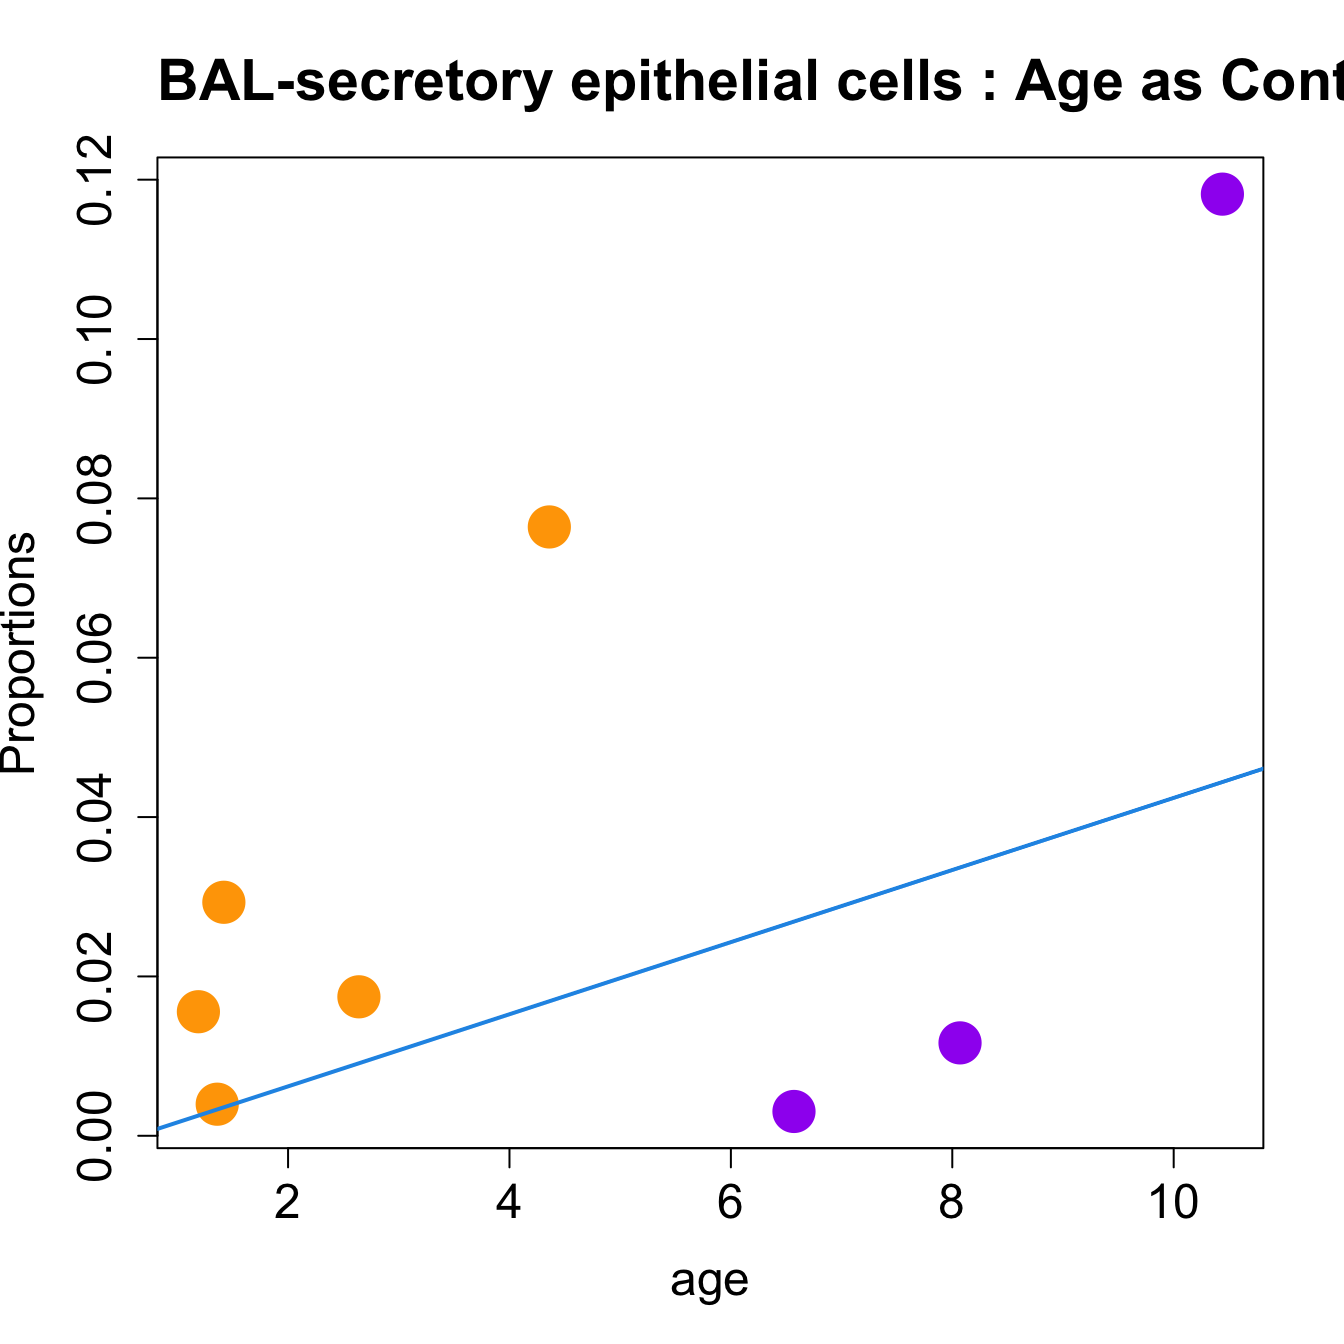
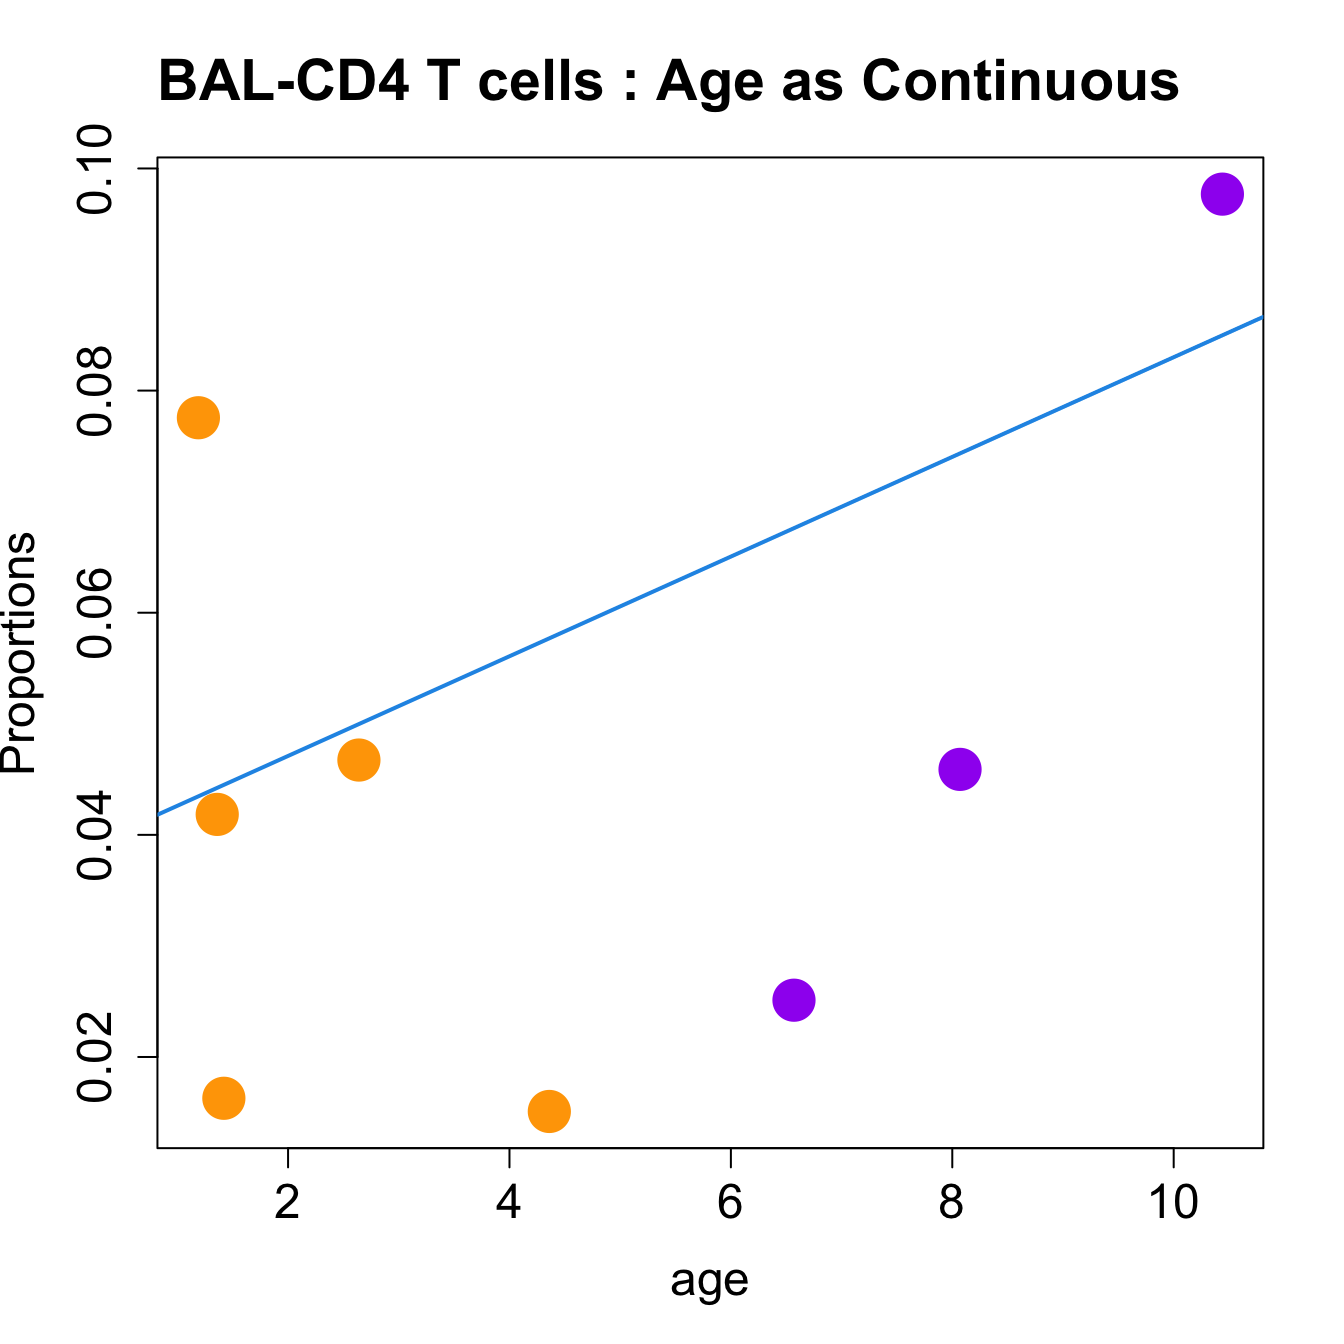
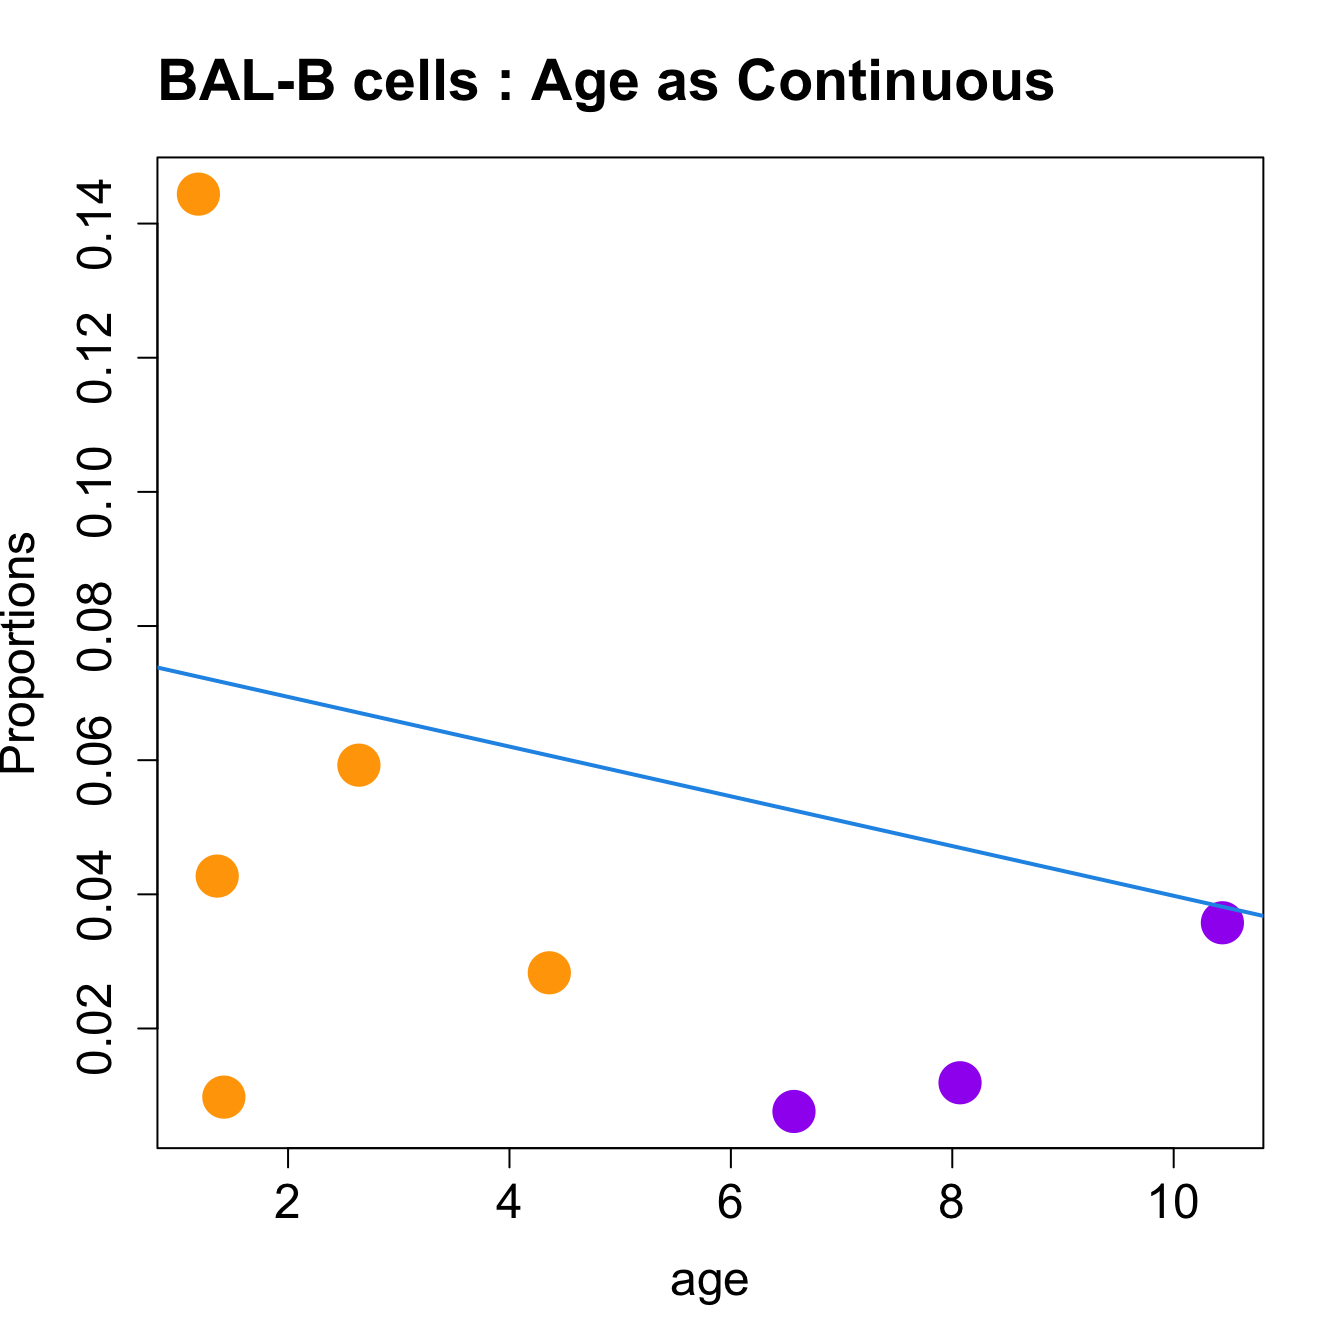
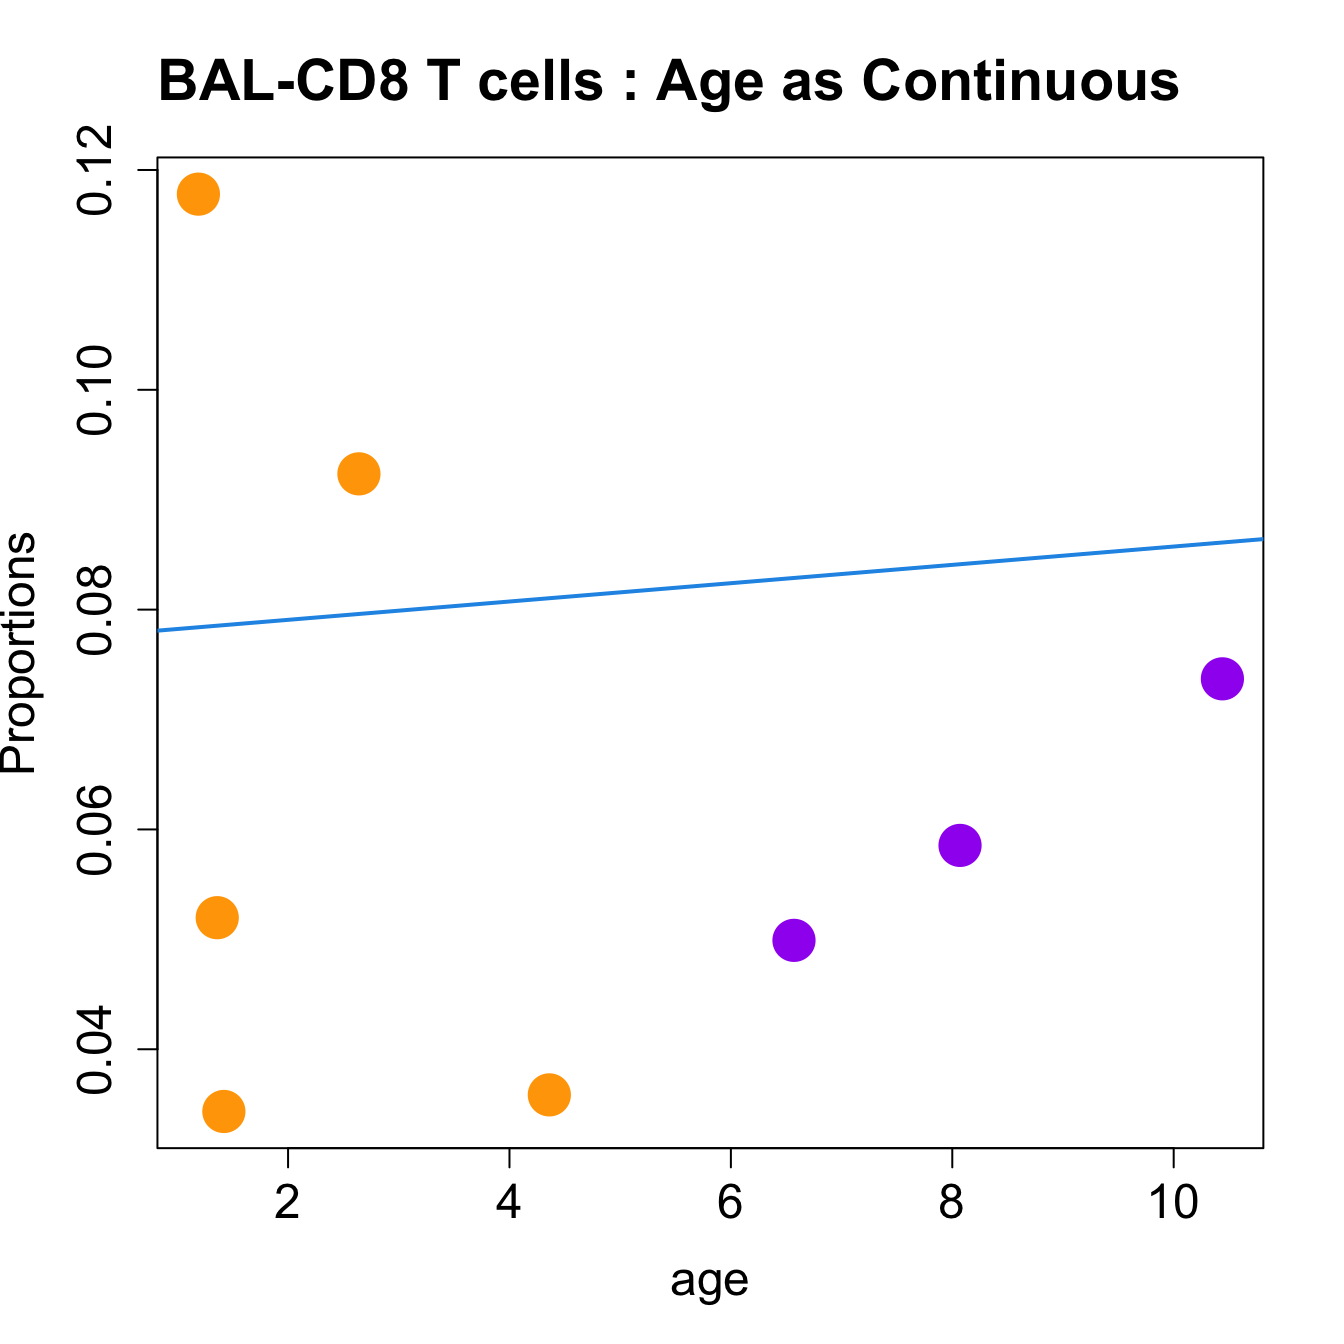
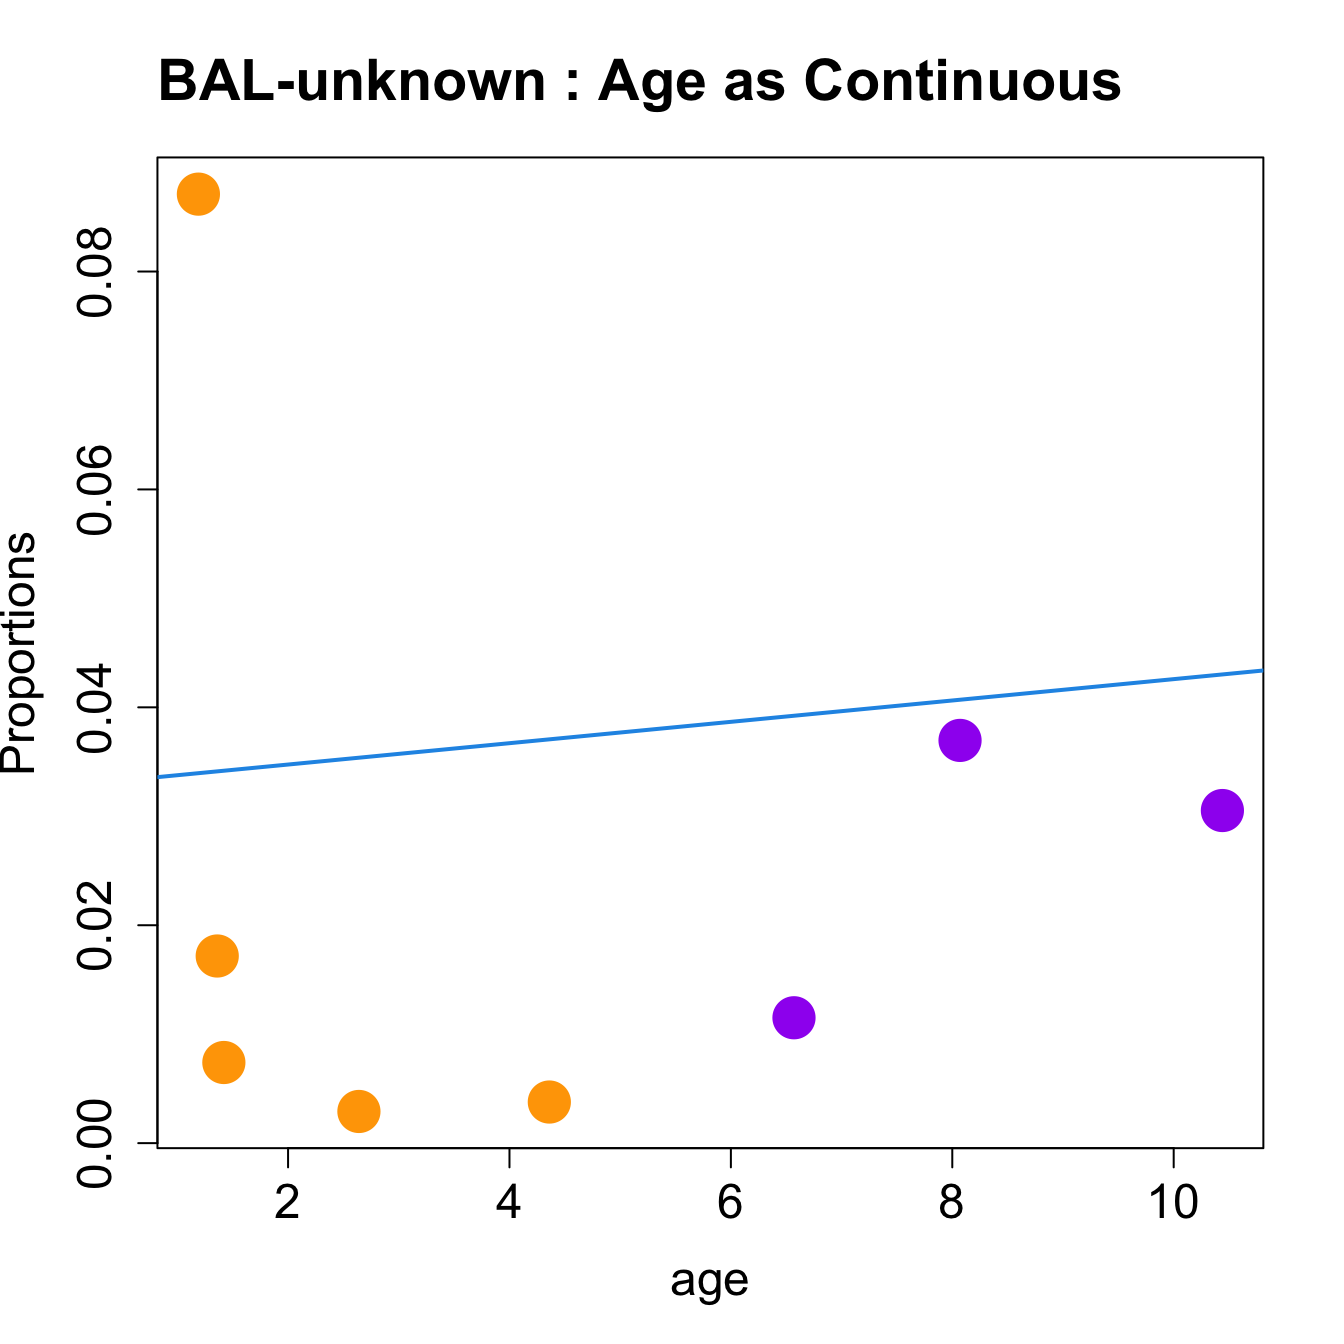
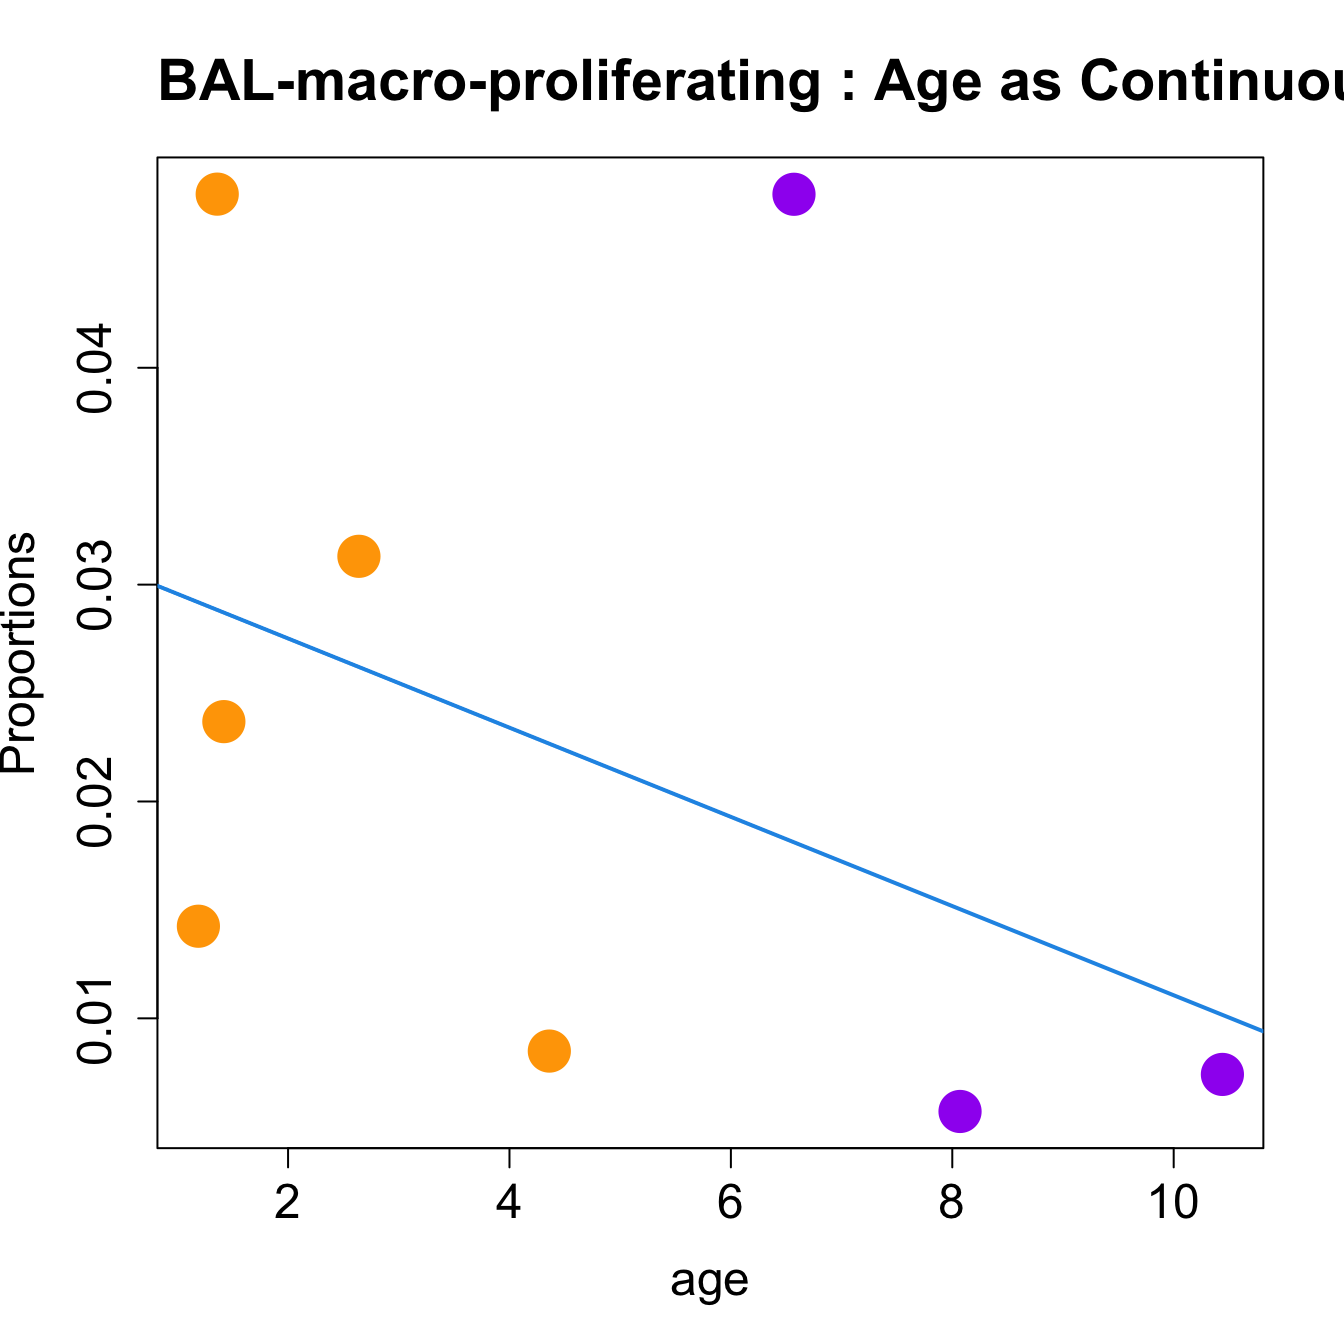
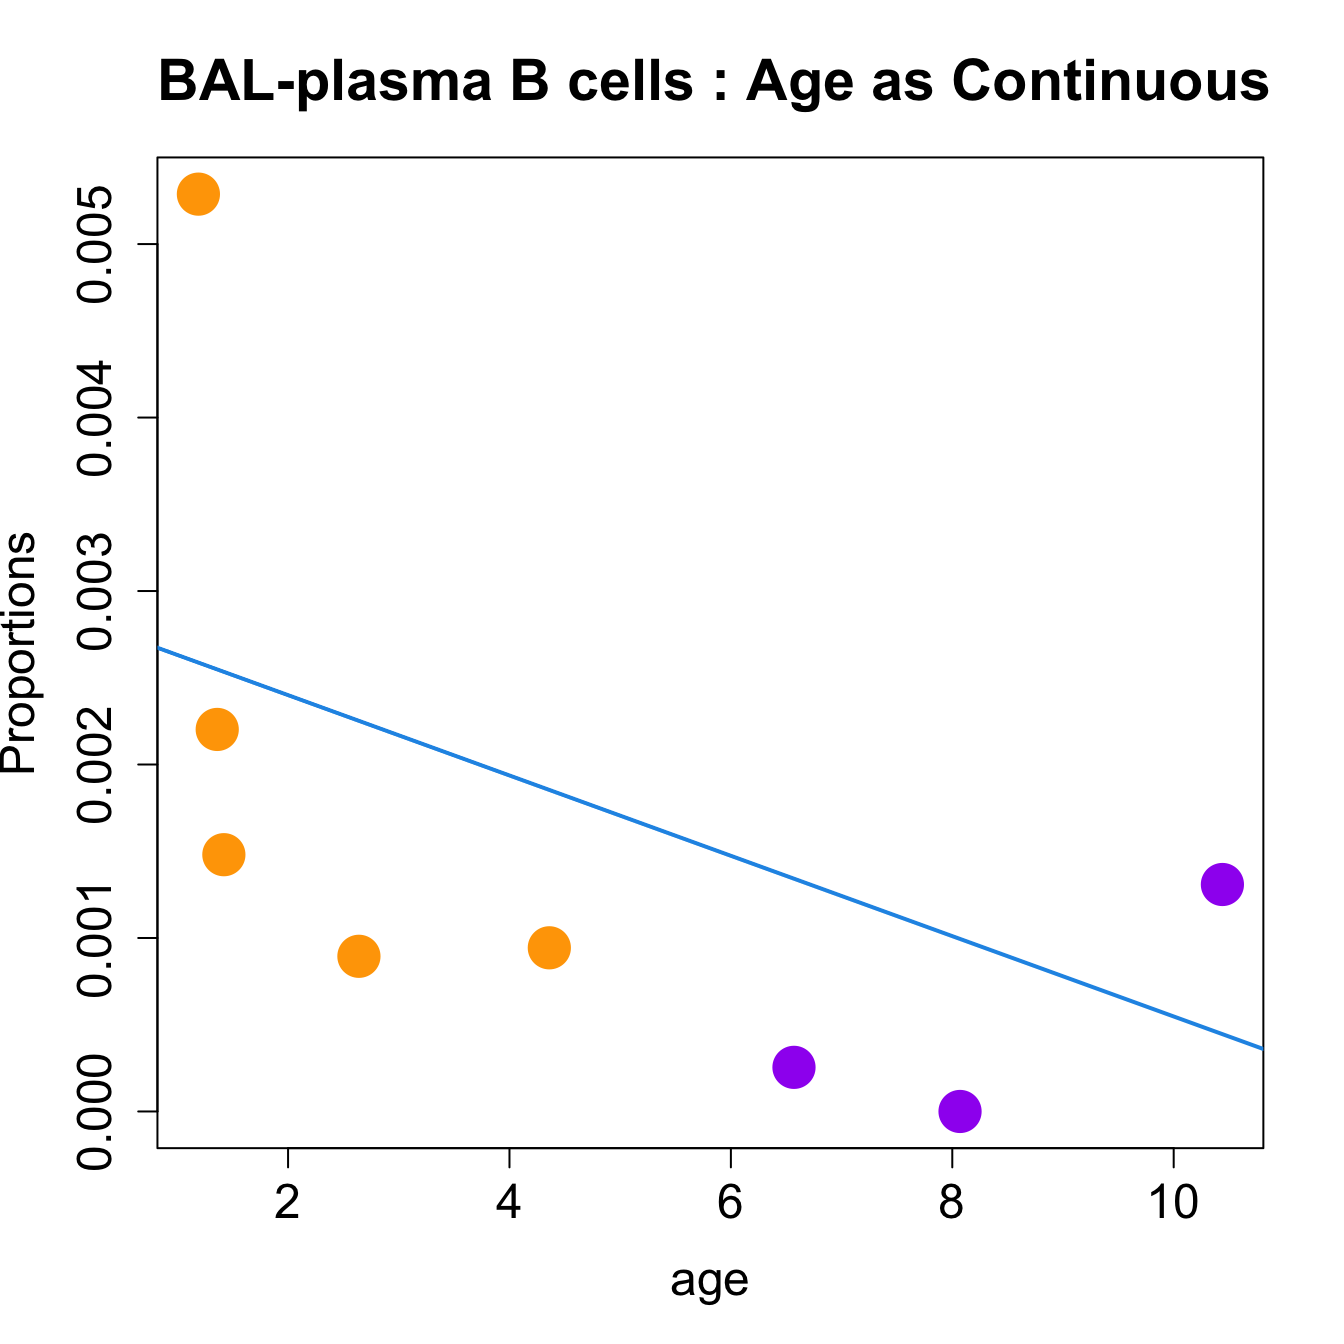 ##Sex
##Sex
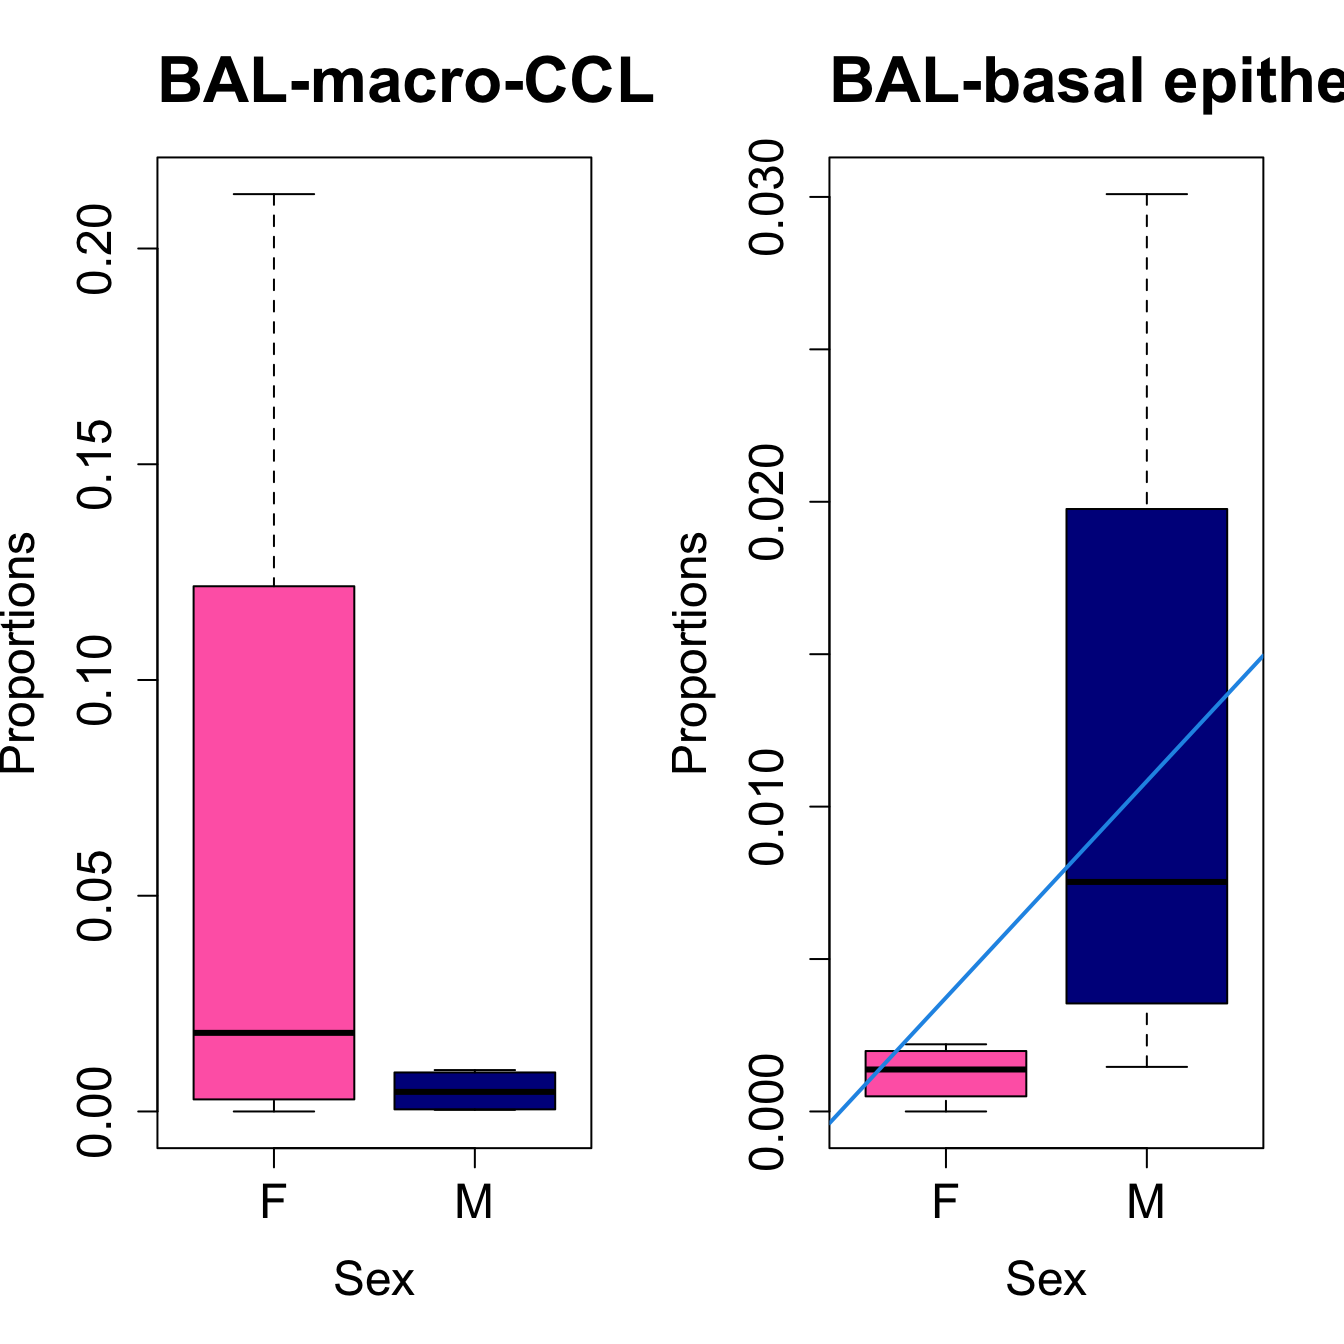
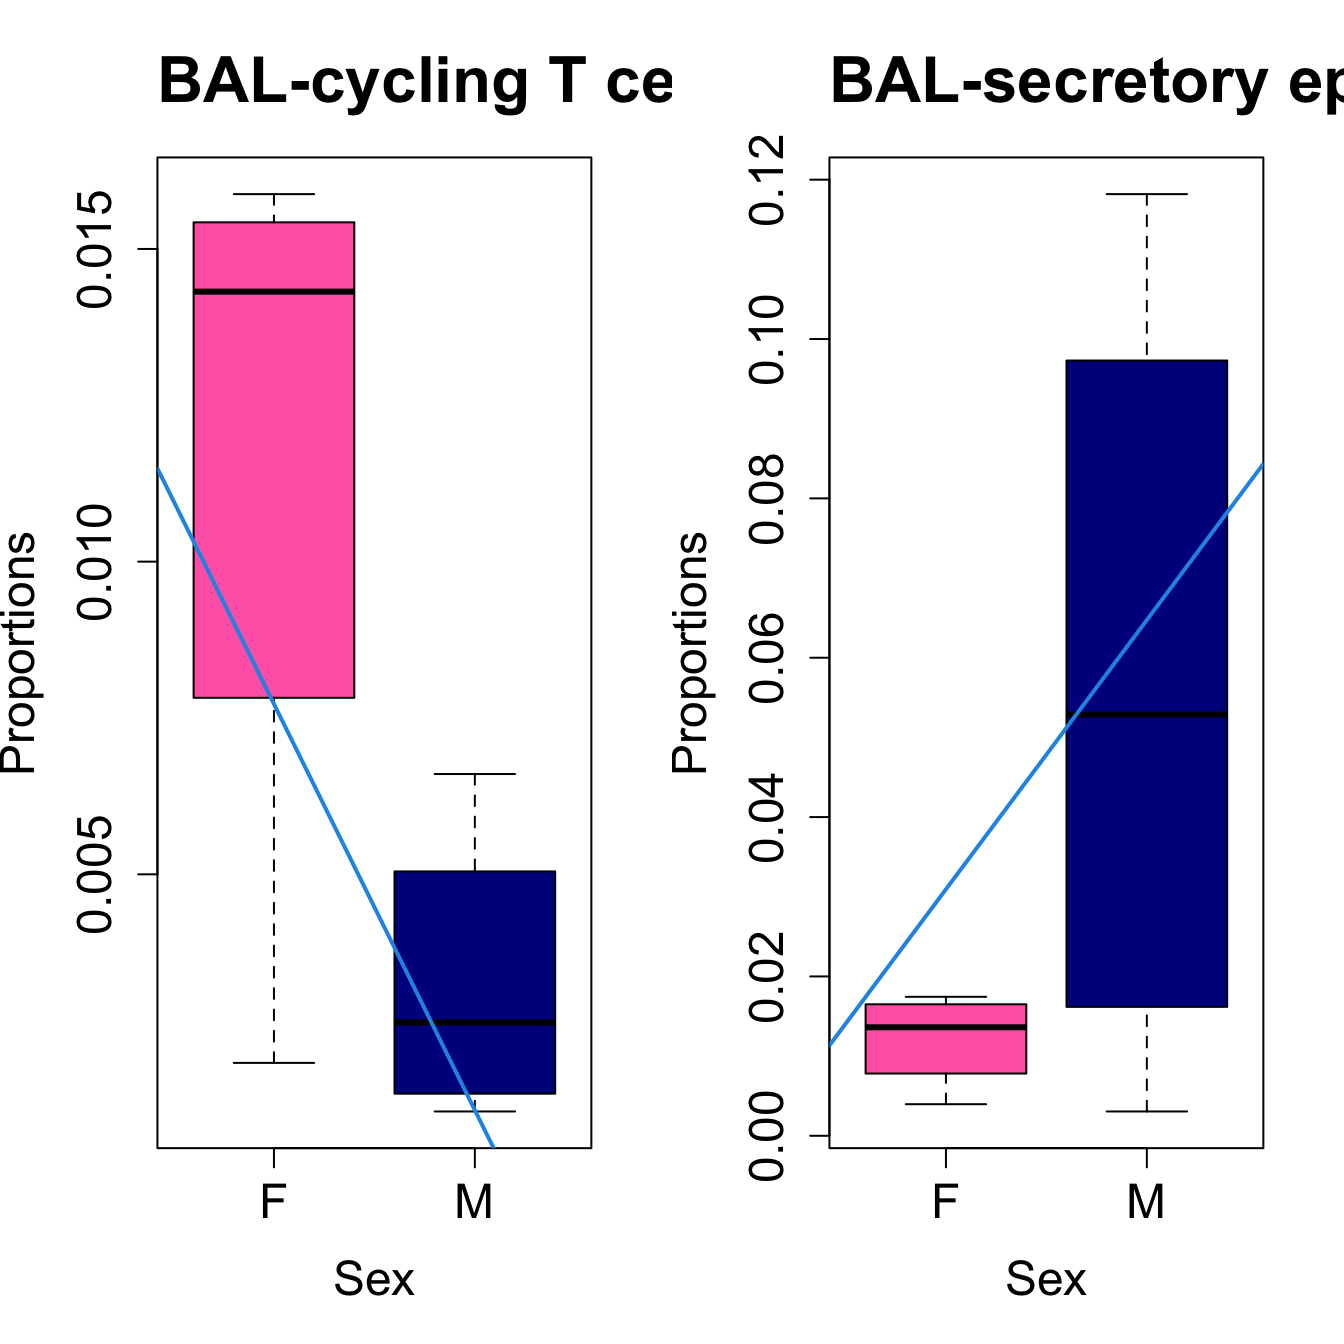
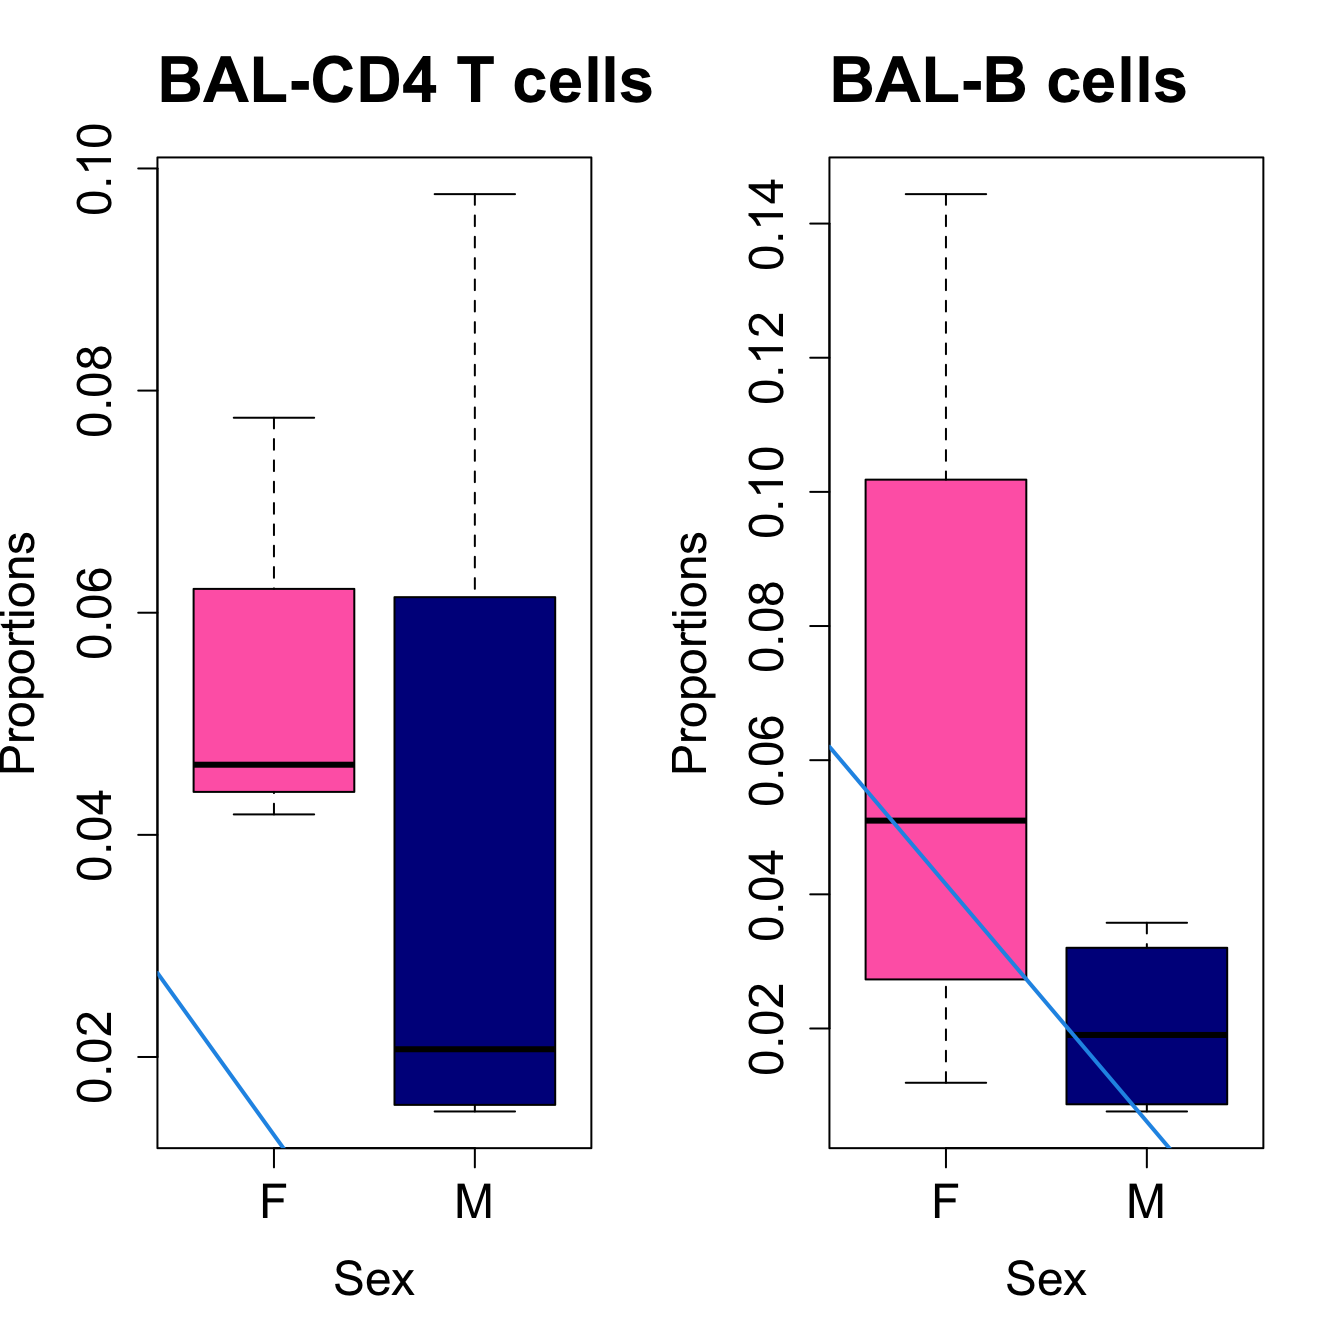
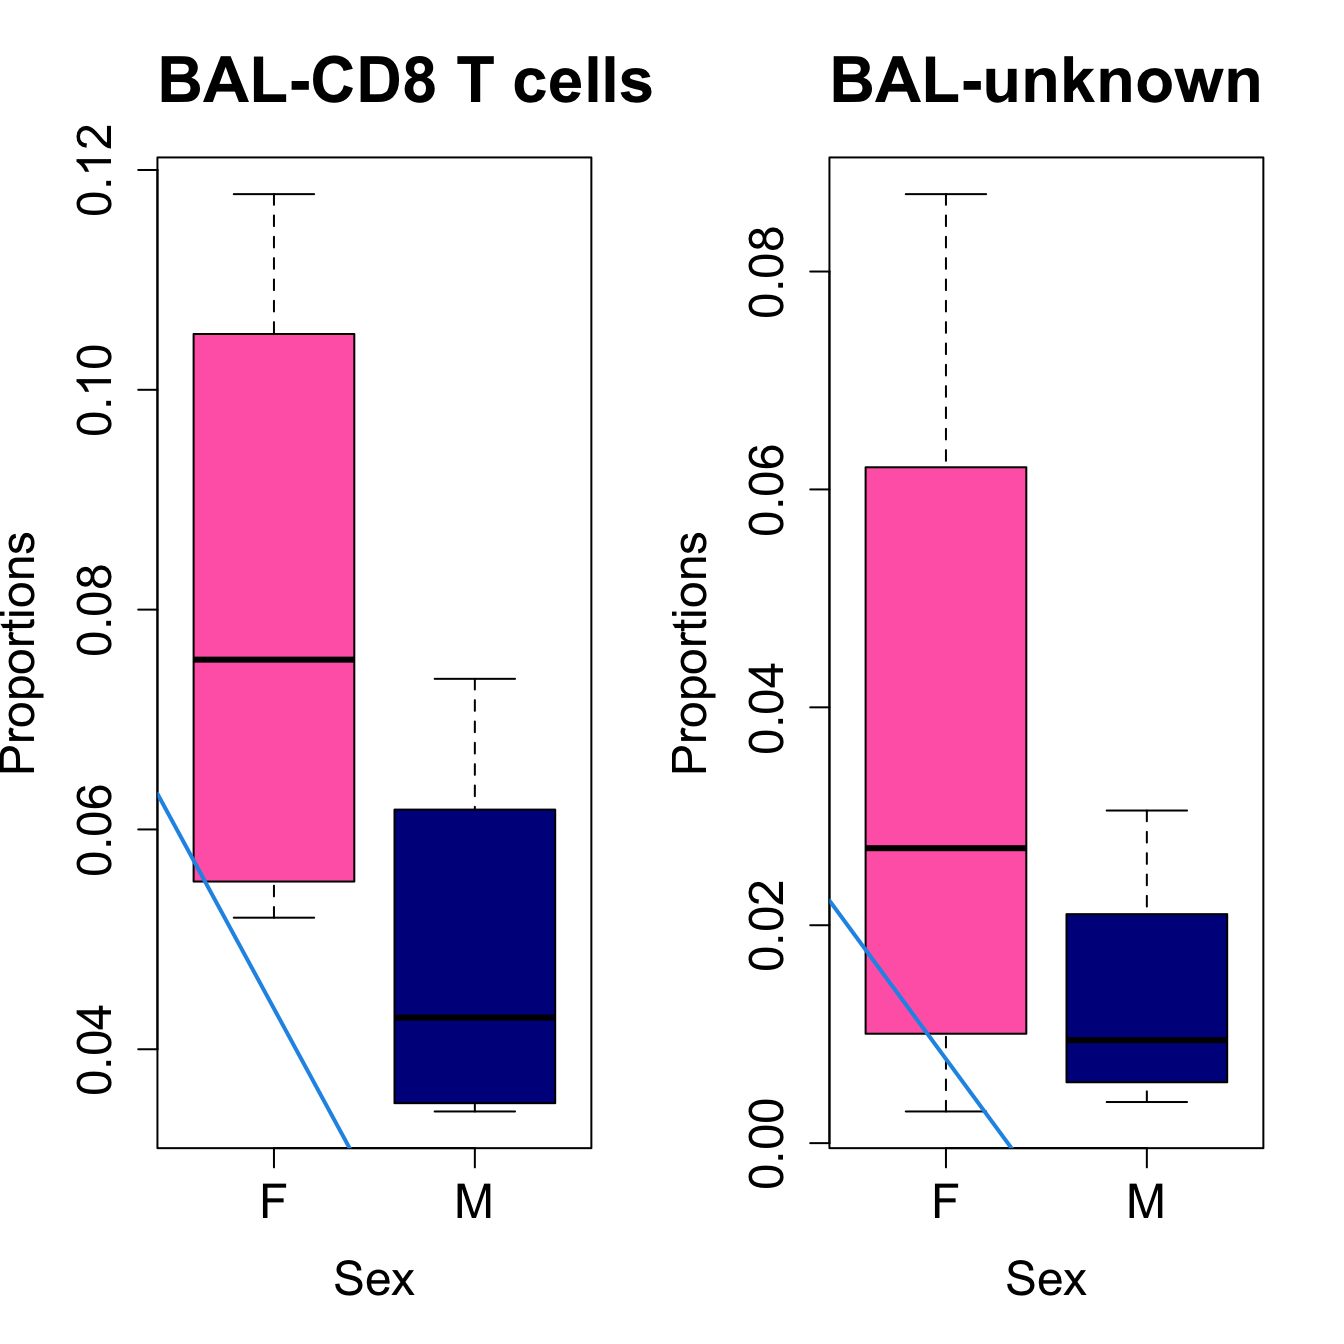
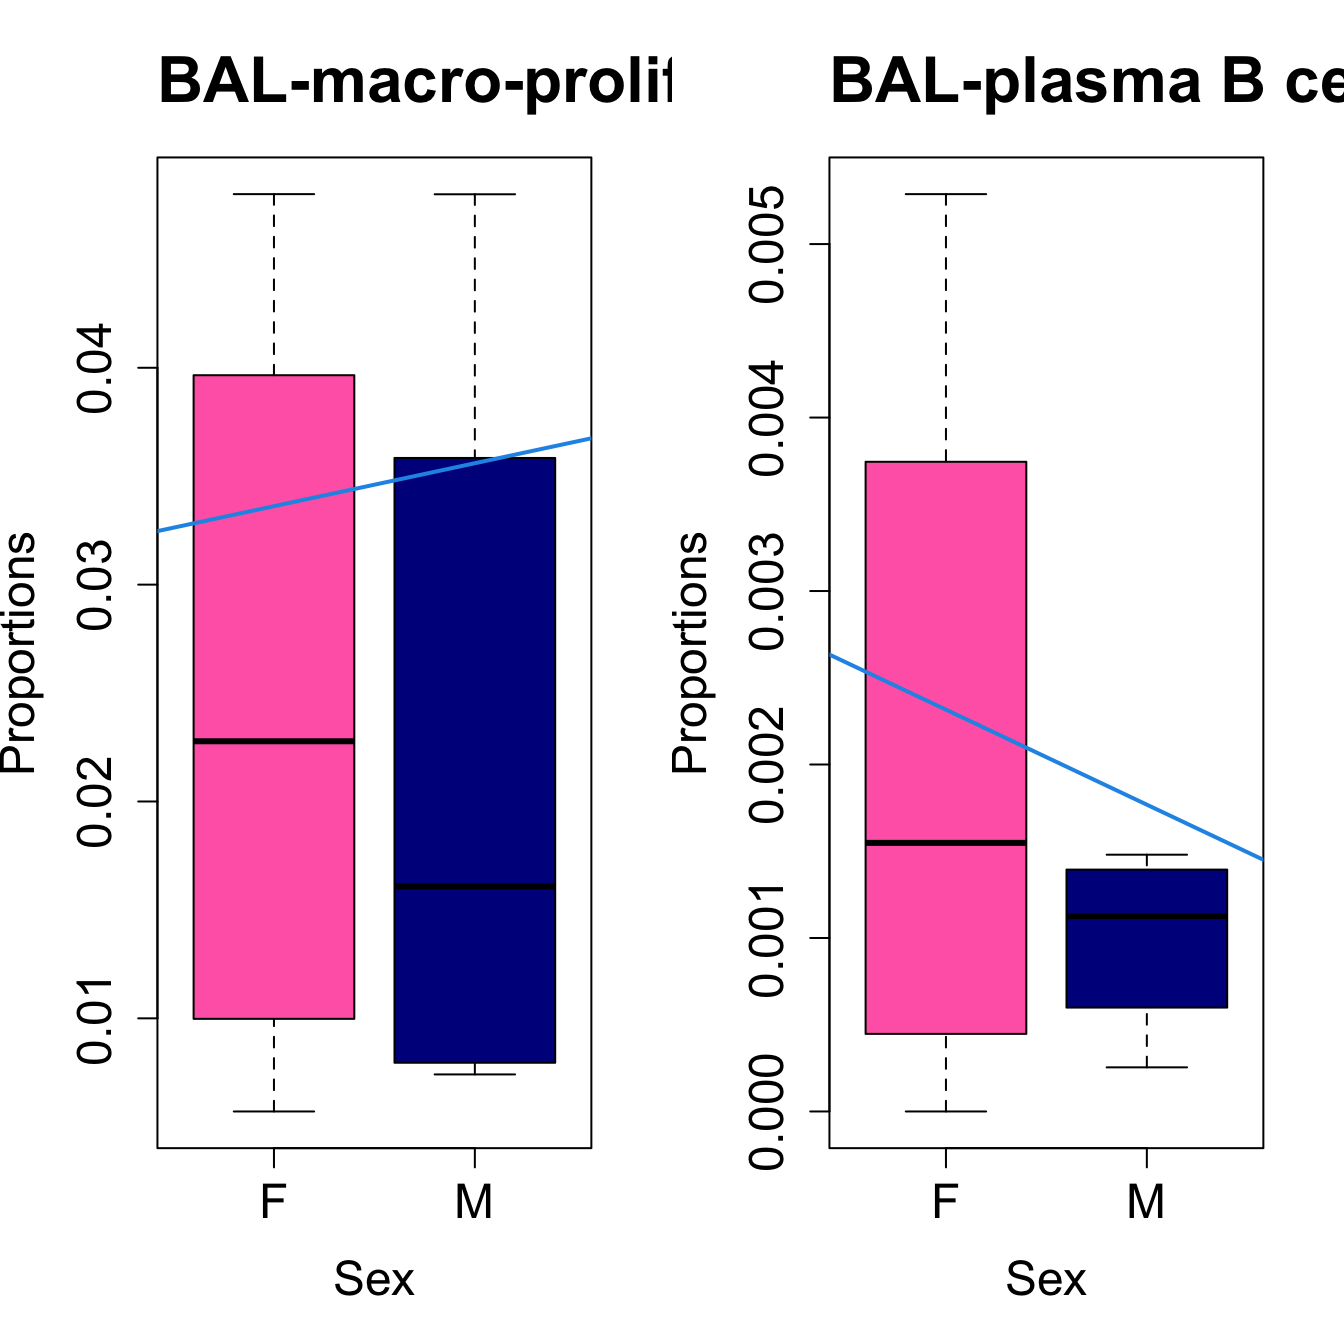 ##
Transformed proportions Toptable results: BAL
##
Transformed proportions Toptable results: BAL
| age | sexM | AveExpr | F | P.Value | adj.P.Val | |
|---|---|---|---|---|---|---|
| macro-CCL | 0.0282015 | -0.1912789 | 0.1206070 | 3.4736278 | 0.0931035 | 0.6709055 |
| basal epithelial cells | 0.0050435 | 0.0541093 | 0.0631748 | 2.1624884 | 0.1894468 | 0.6709055 |
| cycling T cells | -0.0045579 | -0.0374785 | 0.0785126 | 1.8367443 | 0.2320882 | 0.6709055 |
| secretory epithelial cells | 0.0085370 | 0.0870557 | 0.1608856 | 1.7301923 | 0.2487191 | 0.6709055 |
| CD4 T cells | 0.0108564 | -0.0743384 | 0.2062713 | 1.6454887 | 0.2630628 | 0.6709055 |
| B cells | -0.0073902 | -0.0842602 | 0.1873697 | 1.6048406 | 0.2703294 | 0.6709055 |
| CD8 T cells | 0.0027817 | -0.0707270 | 0.2513273 | 1.3914570 | 0.3130892 | 0.6709055 |
| unknown | 0.0062338 | -0.0767854 | 0.1386431 | 0.8027803 | 0.4874082 | 0.8796330 |
| macro-proliferating | -0.0084210 | 0.0100245 | 0.1434875 | 0.7050535 | 0.5277798 | 0.8796330 |
| plasma B cells | -0.0038377 | 0.0020657 | 0.0338709 | 0.4444986 | 0.6589938 | 0.8925562 |
Proportions Toptable results: BAL
| age | sexM | AveExpr | F | P.Value | adj.P.Val | |
|---|---|---|---|---|---|---|
| macro-CCL | 0.0130255 | -0.0885283 | 0.0335122 | 3.0456288 | 0.1251774 | 0.7250622 |
| secretory epithelial cells | 0.0045279 | 0.0337934 | 0.0344494 | 2.4225157 | 0.1723875 | 0.7250622 |
| basal epithelial cells | 0.0013901 | 0.0071018 | 0.0064462 | 2.0024213 | 0.2186517 | 0.7250622 |
| cycling T cells | -0.0007815 | -0.0064928 | 0.0074466 | 1.9427667 | 0.2265324 | 0.7250622 |
| B cells | -0.0037076 | -0.0353703 | 0.0424672 | 1.5167024 | 0.2956827 | 0.7250622 |
| CD8 T cells | 0.0008343 | -0.0337060 | 0.0643089 | 1.5054975 | 0.2978638 | 0.7250622 |
| CD4 T cells | 0.0044880 | -0.0251548 | 0.0457755 | 1.3156218 | 0.3383623 | 0.7250622 |
| unknown | 0.0009799 | -0.0250699 | 0.0246700 | 0.6935011 | 0.5371984 | 0.9603758 |
| macro-lipid | -0.0309909 | 0.1608072 | 0.2757205 | 0.5416019 | 0.6091592 | 0.9603758 |
| macro-proliferating | -0.0020571 | 0.0019812 | 0.0233568 | 0.4822589 | 0.6402505 | 0.9603758 |
Session Info
sessionInfo()R version 4.3.2 (2023-10-31)
Platform: aarch64-apple-darwin20 (64-bit)
Running under: macOS Sonoma 14.5
Matrix products: default
BLAS: /Library/Frameworks/R.framework/Versions/4.3-arm64/Resources/lib/libRblas.0.dylib
LAPACK: /Library/Frameworks/R.framework/Versions/4.3-arm64/Resources/lib/libRlapack.dylib; LAPACK version 3.11.0
locale:
[1] en_US.UTF-8/en_US.UTF-8/en_US.UTF-8/C/en_US.UTF-8/en_US.UTF-8
time zone: Australia/Melbourne
tzcode source: internal
attached base packages:
[1] stats4 stats graphics grDevices utils datasets methods
[8] base
other attached packages:
[1] openxlsx_4.2.5.2 knitr_1.45
[3] kableExtra_1.4.0 edgeR_4.0.16
[5] limma_3.58.1 speckle_1.2.0
[7] ggridges_0.5.6 scran_1.30.2
[9] scuttle_1.12.0 SingleCellExperiment_1.24.0
[11] SummarizedExperiment_1.32.0 Biobase_2.62.0
[13] GenomicRanges_1.54.1 GenomeInfoDb_1.38.6
[15] IRanges_2.36.0 S4Vectors_0.40.2
[17] BiocGenerics_0.48.1 MatrixGenerics_1.14.0
[19] matrixStats_1.2.0 ggforce_0.4.2
[21] viridis_0.6.5 viridisLite_0.4.2
[23] paletteer_1.6.0 gridExtra_2.3
[25] lubridate_1.9.3 forcats_1.0.0
[27] stringr_1.5.1 purrr_1.0.2
[29] readr_2.1.5 tidyr_1.3.1
[31] tibble_3.2.1 ggplot2_3.5.0
[33] tidyverse_2.0.0 dplyr_1.1.4
[35] Seurat_5.0.1.9009 SeuratObject_5.0.1
[37] sp_2.1-3 patchwork_1.2.0
[39] glue_1.7.0 here_1.0.1
loaded via a namespace (and not attached):
[1] RcppAnnoy_0.0.22 splines_4.3.2
[3] later_1.3.2 bitops_1.0-7
[5] polyclip_1.10-6 fastDummies_1.7.3
[7] lifecycle_1.0.4 rprojroot_2.0.4
[9] globals_0.16.2 lattice_0.22-5
[11] MASS_7.3-60.0.1 magrittr_2.0.3
[13] plotly_4.10.4 sass_0.4.8
[15] rmarkdown_2.25 jquerylib_0.1.4
[17] yaml_2.3.8 metapod_1.10.1
[19] httpuv_1.6.14 sctransform_0.4.1
[21] zip_2.3.1 spam_2.10-0
[23] spatstat.sparse_3.0-3 reticulate_1.35.0
[25] cowplot_1.1.3 pbapply_1.7-2
[27] RColorBrewer_1.1-3 abind_1.4-5
[29] zlibbioc_1.48.0 Rtsne_0.17
[31] RCurl_1.98-1.14 tweenr_2.0.3
[33] git2r_0.33.0 GenomeInfoDbData_1.2.11
[35] ggrepel_0.9.5 irlba_2.3.5.1
[37] listenv_0.9.1 spatstat.utils_3.0-4
[39] goftest_1.2-3 RSpectra_0.16-1
[41] dqrng_0.3.2 spatstat.random_3.2-2
[43] fitdistrplus_1.1-11 parallelly_1.37.0
[45] svglite_2.1.3 DelayedMatrixStats_1.24.0
[47] leiden_0.4.3.1 codetools_0.2-19
[49] DelayedArray_0.28.0 xml2_1.3.6
[51] tidyselect_1.2.0 farver_2.1.1
[53] ScaledMatrix_1.10.0 spatstat.explore_3.2-6
[55] jsonlite_1.8.8 BiocNeighbors_1.20.2
[57] ellipsis_0.3.2 progressr_0.14.0
[59] survival_3.5-8 systemfonts_1.0.5
[61] tools_4.3.2 ica_1.0-3
[63] Rcpp_1.0.12 SparseArray_1.2.4
[65] xfun_0.42 withr_3.0.0
[67] fastmap_1.1.1 bluster_1.12.0
[69] fansi_1.0.6 rsvd_1.0.5
[71] digest_0.6.34 timechange_0.3.0
[73] R6_2.5.1 mime_0.12
[75] colorspace_2.1-0 scattermore_1.2
[77] tensor_1.5 spatstat.data_3.0-4
[79] utf8_1.2.4 generics_0.1.3
[81] data.table_1.15.0 httr_1.4.7
[83] htmlwidgets_1.6.4 S4Arrays_1.2.0
[85] whisker_0.4.1 uwot_0.1.16
[87] pkgconfig_2.0.3 gtable_0.3.4
[89] workflowr_1.7.1 lmtest_0.9-40
[91] XVector_0.42.0 htmltools_0.5.7
[93] dotCall64_1.1-1 scales_1.3.0
[95] png_0.1-8 rstudioapi_0.15.0
[97] tzdb_0.4.0 reshape2_1.4.4
[99] nlme_3.1-164 cachem_1.0.8
[101] zoo_1.8-12 KernSmooth_2.23-22
[103] parallel_4.3.2 miniUI_0.1.1.1
[105] pillar_1.9.0 grid_4.3.2
[107] vctrs_0.6.5 RANN_2.6.1
[109] promises_1.2.1 BiocSingular_1.18.0
[111] beachmat_2.18.1 xtable_1.8-4
[113] cluster_2.1.6 evaluate_0.23
[115] locfit_1.5-9.8 cli_3.6.2
[117] compiler_4.3.2 rlang_1.1.3
[119] crayon_1.5.2 future.apply_1.11.1
[121] labeling_0.4.3 rematch2_2.1.2
[123] plyr_1.8.9 fs_1.6.3
[125] stringi_1.8.3 BiocParallel_1.36.0
[127] deldir_2.0-2 munsell_0.5.0
[129] lazyeval_0.2.2 spatstat.geom_3.2-8
[131] Matrix_1.6-5 RcppHNSW_0.6.0
[133] hms_1.1.3 sparseMatrixStats_1.14.0
[135] future_1.33.1 statmod_1.5.0
[137] shiny_1.8.0 highr_0.10
[139] ROCR_1.0-11 igraph_2.0.2
[141] bslib_0.6.1