Age Modelling: Tonsils
Propeller analysis
Gunjan Dixit
February 04, 2025
Last updated: 2025-02-04
Checks: 6 1
Knit directory: paed-airway-allTissues/
This reproducible R Markdown analysis was created with workflowr (version 1.7.1). The Checks tab describes the reproducibility checks that were applied when the results were created. The Past versions tab lists the development history.
The R Markdown file has unstaged changes. To know which version of
the R Markdown file created these results, you’ll want to first commit
it to the Git repo. If you’re still working on the analysis, you can
ignore this warning. When you’re finished, you can run
wflow_publish to commit the R Markdown file and build the
HTML.
Great job! The global environment was empty. Objects defined in the global environment can affect the analysis in your R Markdown file in unknown ways. For reproduciblity it’s best to always run the code in an empty environment.
The command set.seed(20230811) was run prior to running
the code in the R Markdown file. Setting a seed ensures that any results
that rely on randomness, e.g. subsampling or permutations, are
reproducible.
Great job! Recording the operating system, R version, and package versions is critical for reproducibility.
Nice! There were no cached chunks for this analysis, so you can be confident that you successfully produced the results during this run.
Great job! Using relative paths to the files within your workflowr project makes it easier to run your code on other machines.
Great! You are using Git for version control. Tracking code development and connecting the code version to the results is critical for reproducibility.
The results in this page were generated with repository version 54e4ec2. See the Past versions tab to see a history of the changes made to the R Markdown and HTML files.
Note that you need to be careful to ensure that all relevant files for
the analysis have been committed to Git prior to generating the results
(you can use wflow_publish or
wflow_git_commit). workflowr only checks the R Markdown
file, but you know if there are other scripts or data files that it
depends on. Below is the status of the Git repository when the results
were generated:
Ignored files:
    Ignored:    .DS_Store
    Ignored:    .RData
    Ignored:    .Rhistory
    Ignored:    .Rproj.user/
    Ignored:    analysis/.DS_Store
    Ignored:    data/.DS_Store
    Ignored:    data/RDS/
    Ignored:    output/.DS_Store
    Ignored:    output/CSV/.DS_Store
    Ignored:    output/G000231_Neeland_batch1/
    Ignored:    output/G000231_Neeland_batch2_1/
    Ignored:    output/G000231_Neeland_batch2_2/
    Ignored:    output/G000231_Neeland_batch3/
    Ignored:    output/G000231_Neeland_batch4/
    Ignored:    output/G000231_Neeland_batch5/
    Ignored:    output/G000231_Neeland_batch9_1/
    Ignored:    output/RDS/
    Ignored:    output/plots/

Untracked files:
    Untracked:  analysis/03_Batch_Integration.Rmd
    Untracked:  analysis/Age_proportions.Rmd
    Untracked:  analysis/Age_proportions_AllBatches.Rmd
    Untracked:  analysis/All_Batches_QCExploratory_v2.Rmd
    Untracked:  analysis/All_metadata.Rmd
    Untracked:  analysis/Annotation_BAL.Rmd
    Untracked:  analysis/Annotation_Bronchial_brushings.Rmd
    Untracked:  analysis/Annotation_Nasal_brushings.Rmd
    Untracked:  analysis/BatchCorrection_Adenoids.Rmd
    Untracked:  analysis/BatchCorrection_Nasal_brushings.Rmd
    Untracked:  analysis/BatchCorrection_Tonsils.Rmd
    Untracked:  analysis/Batch_Integration_&_Downstream_analysis.Rmd
    Untracked:  analysis/Batch_correction_&_Downstream.Rmd
    Untracked:  analysis/Cell_cycle_regression.Rmd
    Untracked:  analysis/Clustering_Tonsils_v2.Rmd
    Untracked:  analysis/DGE_analysis_George.Rmd
    Untracked:  analysis/Master_metadata.Rmd
    Untracked:  analysis/Pediatric_Vs_Adult_Atlases.Rmd
    Untracked:  analysis/Preprocessing_Batch1_Nasal_brushings.Rmd
    Untracked:  analysis/Preprocessing_Batch2_Tonsils.Rmd
    Untracked:  analysis/Preprocessing_Batch3_Adenoids.Rmd
    Untracked:  analysis/Preprocessing_Batch4_Bronchial_brushings.Rmd
    Untracked:  analysis/Preprocessing_Batch5_Nasal_brushings.Rmd
    Untracked:  analysis/Preprocessing_Batch6_BAL.Rmd
    Untracked:  analysis/Preprocessing_Batch7_Bronchial_brushings.Rmd
    Untracked:  analysis/Preprocessing_Batch8_Adenoids.Rmd
    Untracked:  analysis/Preprocessing_Batch9_Tonsils.Rmd
    Untracked:  analysis/TonsilsVsAdenoids.Rmd
    Untracked:  analysis/cell_cycle_regression.R
    Untracked:  analysis/testing_age_all.Rmd
    Untracked:  data/Cell_labels_Gunjan_v2/
    Untracked:  data/Cell_labels_Mel/
    Untracked:  data/Cell_labels_Mel_v2/
    Untracked:  data/Cell_labels_Mel_v3/
    Untracked:  data/Cell_labels_modified_Gunjan/
    Untracked:  data/Gene_sets/
    Untracked:  data/Hs.c2.cp.reactome.v7.1.entrez.rds
    Untracked:  data/Raw_feature_bc_matrix/
    Untracked:  data/cell_labels_Mel_v4_Dec2024/
    Untracked:  data/celltypes_Mel_GD_v3.xlsx
    Untracked:  data/celltypes_Mel_GD_v4_no_dups.xlsx
    Untracked:  data/celltypes_Mel_modified.xlsx
    Untracked:  data/celltypes_Mel_v2.csv
    Untracked:  data/celltypes_Mel_v2.xlsx
    Untracked:  data/celltypes_Mel_v2_MN.xlsx
    Untracked:  data/celltypes_for_mel_MN.xlsx
    Untracked:  data/col_palette.xlsx
    Untracked:  data/earlyAIR_sample_sheets_combined.xlsx
    Untracked:  data/~$col_palette.xlsx
    Untracked:  output/CSV/All_tissues.propeller.xlsx
    Untracked:  output/CSV/Bronchial_brushings/
    Untracked:  output/CSV/Bronchial_brushings_Marker_gene_clusters.limmaTrendRNA_snn_res.0.4/
    Untracked:  output/CSV/G000231_Neeland_Adenoids.propeller.xlsx
    Untracked:  output/CSV/G000231_Neeland_Bronchial_brushings.propeller.xlsx
    Untracked:  output/CSV/G000231_Neeland_Nasal_brushings.propeller.xlsx
    Untracked:  output/CSV/G000231_Neeland_Tonsils.propeller.xlsx
    Untracked:  output/CSV/Nasal_brushings/
    Untracked:  output/CSV_v2/G000231_Neeland_Adenoids.propeller.xlsx
    Untracked:  output/CSV_v2/G000231_Neeland_Nasal_brushings.propeller.xlsx
    Untracked:  output/CSV_v2/G000231_Neeland_Tonsils.propeller.xlsx
    Untracked:  output/DGE/
    Untracked:  test_col.csv
    Untracked:  test_col.txt
    Untracked:  test_col.xlsx

Unstaged changes:
    Deleted:    02_QC_exploratoryPlots.Rmd
    Deleted:    02_QC_exploratoryPlots.html
    Modified:   analysis/00_AllBatches_overview.Rmd
    Modified:   analysis/01_QC_emptyDrops.Rmd
    Modified:   analysis/02_QC_exploratoryPlots.Rmd
    Modified:   analysis/Adenoids.Rmd
    Modified:   analysis/Adenoids_v2.Rmd
    Modified:   analysis/Age_modeling.Rmd
    Modified:   analysis/Age_modelling_Adenoids.Rmd
    Modified:   analysis/Age_modelling_Nasal_Brushings.Rmd
    Modified:   analysis/Age_modelling_Tonsils.Rmd
    Modified:   analysis/AllBatches_QCExploratory.Rmd
    Modified:   analysis/BAL.Rmd
    Modified:   analysis/BAL_v2.Rmd
    Modified:   analysis/Bronchial_brushings.Rmd
    Modified:   analysis/Bronchial_brushings_v2.Rmd
    Modified:   analysis/Nasal_brushings.Rmd
    Modified:   analysis/Nasal_brushings_v2.Rmd
    Modified:   analysis/Subclustering_Adenoids.Rmd
    Modified:   analysis/Subclustering_BAL.Rmd
    Modified:   analysis/Subclustering_Bronchial_brushings.Rmd
    Modified:   analysis/Subclustering_Nasal_brushings.Rmd
    Modified:   analysis/Subclustering_Tonsils.Rmd
    Modified:   analysis/Tonsils.Rmd
    Modified:   analysis/Tonsils_v2.Rmd
    Modified:   output/CSV/BAL_Marker_gene_clusters.limmaTrendRNA_snn_res.0.4/REACTOME-cluster-limma-c0.csv
    Modified:   output/CSV/BAL_Marker_gene_clusters.limmaTrendRNA_snn_res.0.4/REACTOME-cluster-limma-c1.csv
    Modified:   output/CSV/BAL_Marker_gene_clusters.limmaTrendRNA_snn_res.0.4/REACTOME-cluster-limma-c10.csv
    Modified:   output/CSV/BAL_Marker_gene_clusters.limmaTrendRNA_snn_res.0.4/REACTOME-cluster-limma-c11.csv
    Modified:   output/CSV/BAL_Marker_gene_clusters.limmaTrendRNA_snn_res.0.4/REACTOME-cluster-limma-c12.csv
    Modified:   output/CSV/BAL_Marker_gene_clusters.limmaTrendRNA_snn_res.0.4/REACTOME-cluster-limma-c13.csv
    Modified:   output/CSV/BAL_Marker_gene_clusters.limmaTrendRNA_snn_res.0.4/REACTOME-cluster-limma-c14.csv
    Modified:   output/CSV/BAL_Marker_gene_clusters.limmaTrendRNA_snn_res.0.4/REACTOME-cluster-limma-c15.csv
    Modified:   output/CSV/BAL_Marker_gene_clusters.limmaTrendRNA_snn_res.0.4/REACTOME-cluster-limma-c16.csv
    Modified:   output/CSV/BAL_Marker_gene_clusters.limmaTrendRNA_snn_res.0.4/REACTOME-cluster-limma-c17.csv
    Modified:   output/CSV/BAL_Marker_gene_clusters.limmaTrendRNA_snn_res.0.4/REACTOME-cluster-limma-c2.csv
    Modified:   output/CSV/BAL_Marker_gene_clusters.limmaTrendRNA_snn_res.0.4/REACTOME-cluster-limma-c3.csv
    Modified:   output/CSV/BAL_Marker_gene_clusters.limmaTrendRNA_snn_res.0.4/REACTOME-cluster-limma-c4.csv
    Modified:   output/CSV/BAL_Marker_gene_clusters.limmaTrendRNA_snn_res.0.4/REACTOME-cluster-limma-c5.csv
    Modified:   output/CSV/BAL_Marker_gene_clusters.limmaTrendRNA_snn_res.0.4/REACTOME-cluster-limma-c6.csv
    Modified:   output/CSV/BAL_Marker_gene_clusters.limmaTrendRNA_snn_res.0.4/REACTOME-cluster-limma-c7.csv
    Modified:   output/CSV/BAL_Marker_gene_clusters.limmaTrendRNA_snn_res.0.4/REACTOME-cluster-limma-c8.csv
    Modified:   output/CSV/BAL_Marker_gene_clusters.limmaTrendRNA_snn_res.0.4/REACTOME-cluster-limma-c9.csv
    Modified:   output/CSV/BAL_Marker_gene_clusters.limmaTrendRNA_snn_res.0.4/up-cluster-limma-c0.csv
    Modified:   output/CSV/BAL_Marker_gene_clusters.limmaTrendRNA_snn_res.0.4/up-cluster-limma-c1.csv
    Modified:   output/CSV/BAL_Marker_gene_clusters.limmaTrendRNA_snn_res.0.4/up-cluster-limma-c10.csv
    Modified:   output/CSV/BAL_Marker_gene_clusters.limmaTrendRNA_snn_res.0.4/up-cluster-limma-c11.csv
    Modified:   output/CSV/BAL_Marker_gene_clusters.limmaTrendRNA_snn_res.0.4/up-cluster-limma-c12.csv
    Modified:   output/CSV/BAL_Marker_gene_clusters.limmaTrendRNA_snn_res.0.4/up-cluster-limma-c13.csv
    Modified:   output/CSV/BAL_Marker_gene_clusters.limmaTrendRNA_snn_res.0.4/up-cluster-limma-c14.csv
    Modified:   output/CSV/BAL_Marker_gene_clusters.limmaTrendRNA_snn_res.0.4/up-cluster-limma-c15.csv
    Modified:   output/CSV/BAL_Marker_gene_clusters.limmaTrendRNA_snn_res.0.4/up-cluster-limma-c16.csv
    Modified:   output/CSV/BAL_Marker_gene_clusters.limmaTrendRNA_snn_res.0.4/up-cluster-limma-c17.csv
    Modified:   output/CSV/BAL_Marker_gene_clusters.limmaTrendRNA_snn_res.0.4/up-cluster-limma-c2.csv
    Modified:   output/CSV/BAL_Marker_gene_clusters.limmaTrendRNA_snn_res.0.4/up-cluster-limma-c3.csv
    Modified:   output/CSV/BAL_Marker_gene_clusters.limmaTrendRNA_snn_res.0.4/up-cluster-limma-c4.csv
    Modified:   output/CSV/BAL_Marker_gene_clusters.limmaTrendRNA_snn_res.0.4/up-cluster-limma-c5.csv
    Modified:   output/CSV/BAL_Marker_gene_clusters.limmaTrendRNA_snn_res.0.4/up-cluster-limma-c6.csv
    Modified:   output/CSV/BAL_Marker_gene_clusters.limmaTrendRNA_snn_res.0.4/up-cluster-limma-c7.csv
    Modified:   output/CSV/BAL_Marker_gene_clusters.limmaTrendRNA_snn_res.0.4/up-cluster-limma-c8.csv
    Modified:   output/CSV/BAL_Marker_gene_clusters.limmaTrendRNA_snn_res.0.4/up-cluster-limma-c9.csv
Note that any generated files, e.g. HTML, png, CSS, etc., are not included in this status report because it is ok for generated content to have uncommitted changes.
These are the previous versions of the repository in which changes were
made to the R Markdown (analysis/Age_modelling_Tonsils.Rmd)
and HTML (docs/Age_modelling_Tonsils.html) files. If you’ve
configured a remote Git repository (see ?wflow_git_remote),
click on the hyperlinks in the table below to view the files as they
were in that past version.
| File | Version | Author | Date | Message |
|---|---|---|---|---|
| Rmd | 8f254aa | Gunjan Dixit | 2024-10-09 | Modified age analysis with interaction model |
| html | 0f07f72 | Gunjan Dixit | 2024-10-07 | Added BAL subclustering without DecontX |
Introduction
This RMarkdown performs age modelling analysis for the earlyAIR tissue- Tonsils
suppressPackageStartupMessages({
  library(here)
  library(glue)
  library(patchwork)
  library(Seurat)
  library(dplyr)
  library(tidyverse)
  library(gridExtra)
  library(paletteer)
  library(viridis)
  library(ggforce)
  library(RColorBrewer)
  library(scran)
  library(ggridges)
  library(speckle)
  library(edgeR)
  library(kableExtra)
  library(dplyr)
  library(limma)
  library(knitr)
  library(openxlsx)
})
Load data
tissue <- "Tonsils"
out <- here("output/RDS/AllBatches_Annotation_SEUs_v2/G000231_Neeland_Tonsils.annotated_clusters.SEU.rds")
merged_obj <- readRDS(out)
merged_obj
An object of class Seurat
17566 features across 208077 samples within 1 assay
Active assay: RNA (17566 features, 2000 variable features)
10 layers present: data.1, data.2, data.3, counts.1, scale.data.1, counts.2, scale.data.2, counts.3, scale.data.3, scale.data
2 dimensional reductions calculated: pca, umap.mergedPlot sample wise cell-type proportions
metadata_df <- data.frame(
  sample = merged_obj$sample_id,
  donor = merged_obj$donor_id,
  age_years = as.character(merged_obj$age_years),
  cell_type = merged_obj$cell_labels_v2
)

color_palette = readRDS(here("output/RDS/color_palette_unique.rds"))

metadata_df$age_years <- as.numeric(metadata_df$age_years)
barplot_data <- metadata_df %>%
  group_by(sample, age_years, cell_type) %>%
  summarise(n_cells = n()) %>%
  ungroup() %>%
  group_by(sample, age_years) %>%
  mutate(n_cells_total = sum(n_cells)) %>%
  ungroup() %>%
  mutate(percentage_cells = n_cells / n_cells_total)
`summarise()` has grouped output by 'sample', 'age_years'. You can override
using the `.groups` argument.barplot_data <- barplot_data %>%
arrange(age_years)
a <- ggplot(barplot_data, aes(x = reorder(paste(sample, age_years, sep = ":"), age_years),
y = percentage_cells, fill = cell_type)) +
geom_bar(stat = "identity") +
ggtitle(paste0("Age vs Cell Type Proportions: ", tissue)) +
labs(x = "Sample:Age (Years)", y = "Proportion", fill = "Cell Type") +
scale_fill_manual(values = color_palette) +
theme_minimal() +
theme(
plot.title = element_text(size = 13, hjust = 0.5, face = "bold"),
legend.position = "top",
axis.text.x = element_text(angle = 45, hjust = 1)
)
a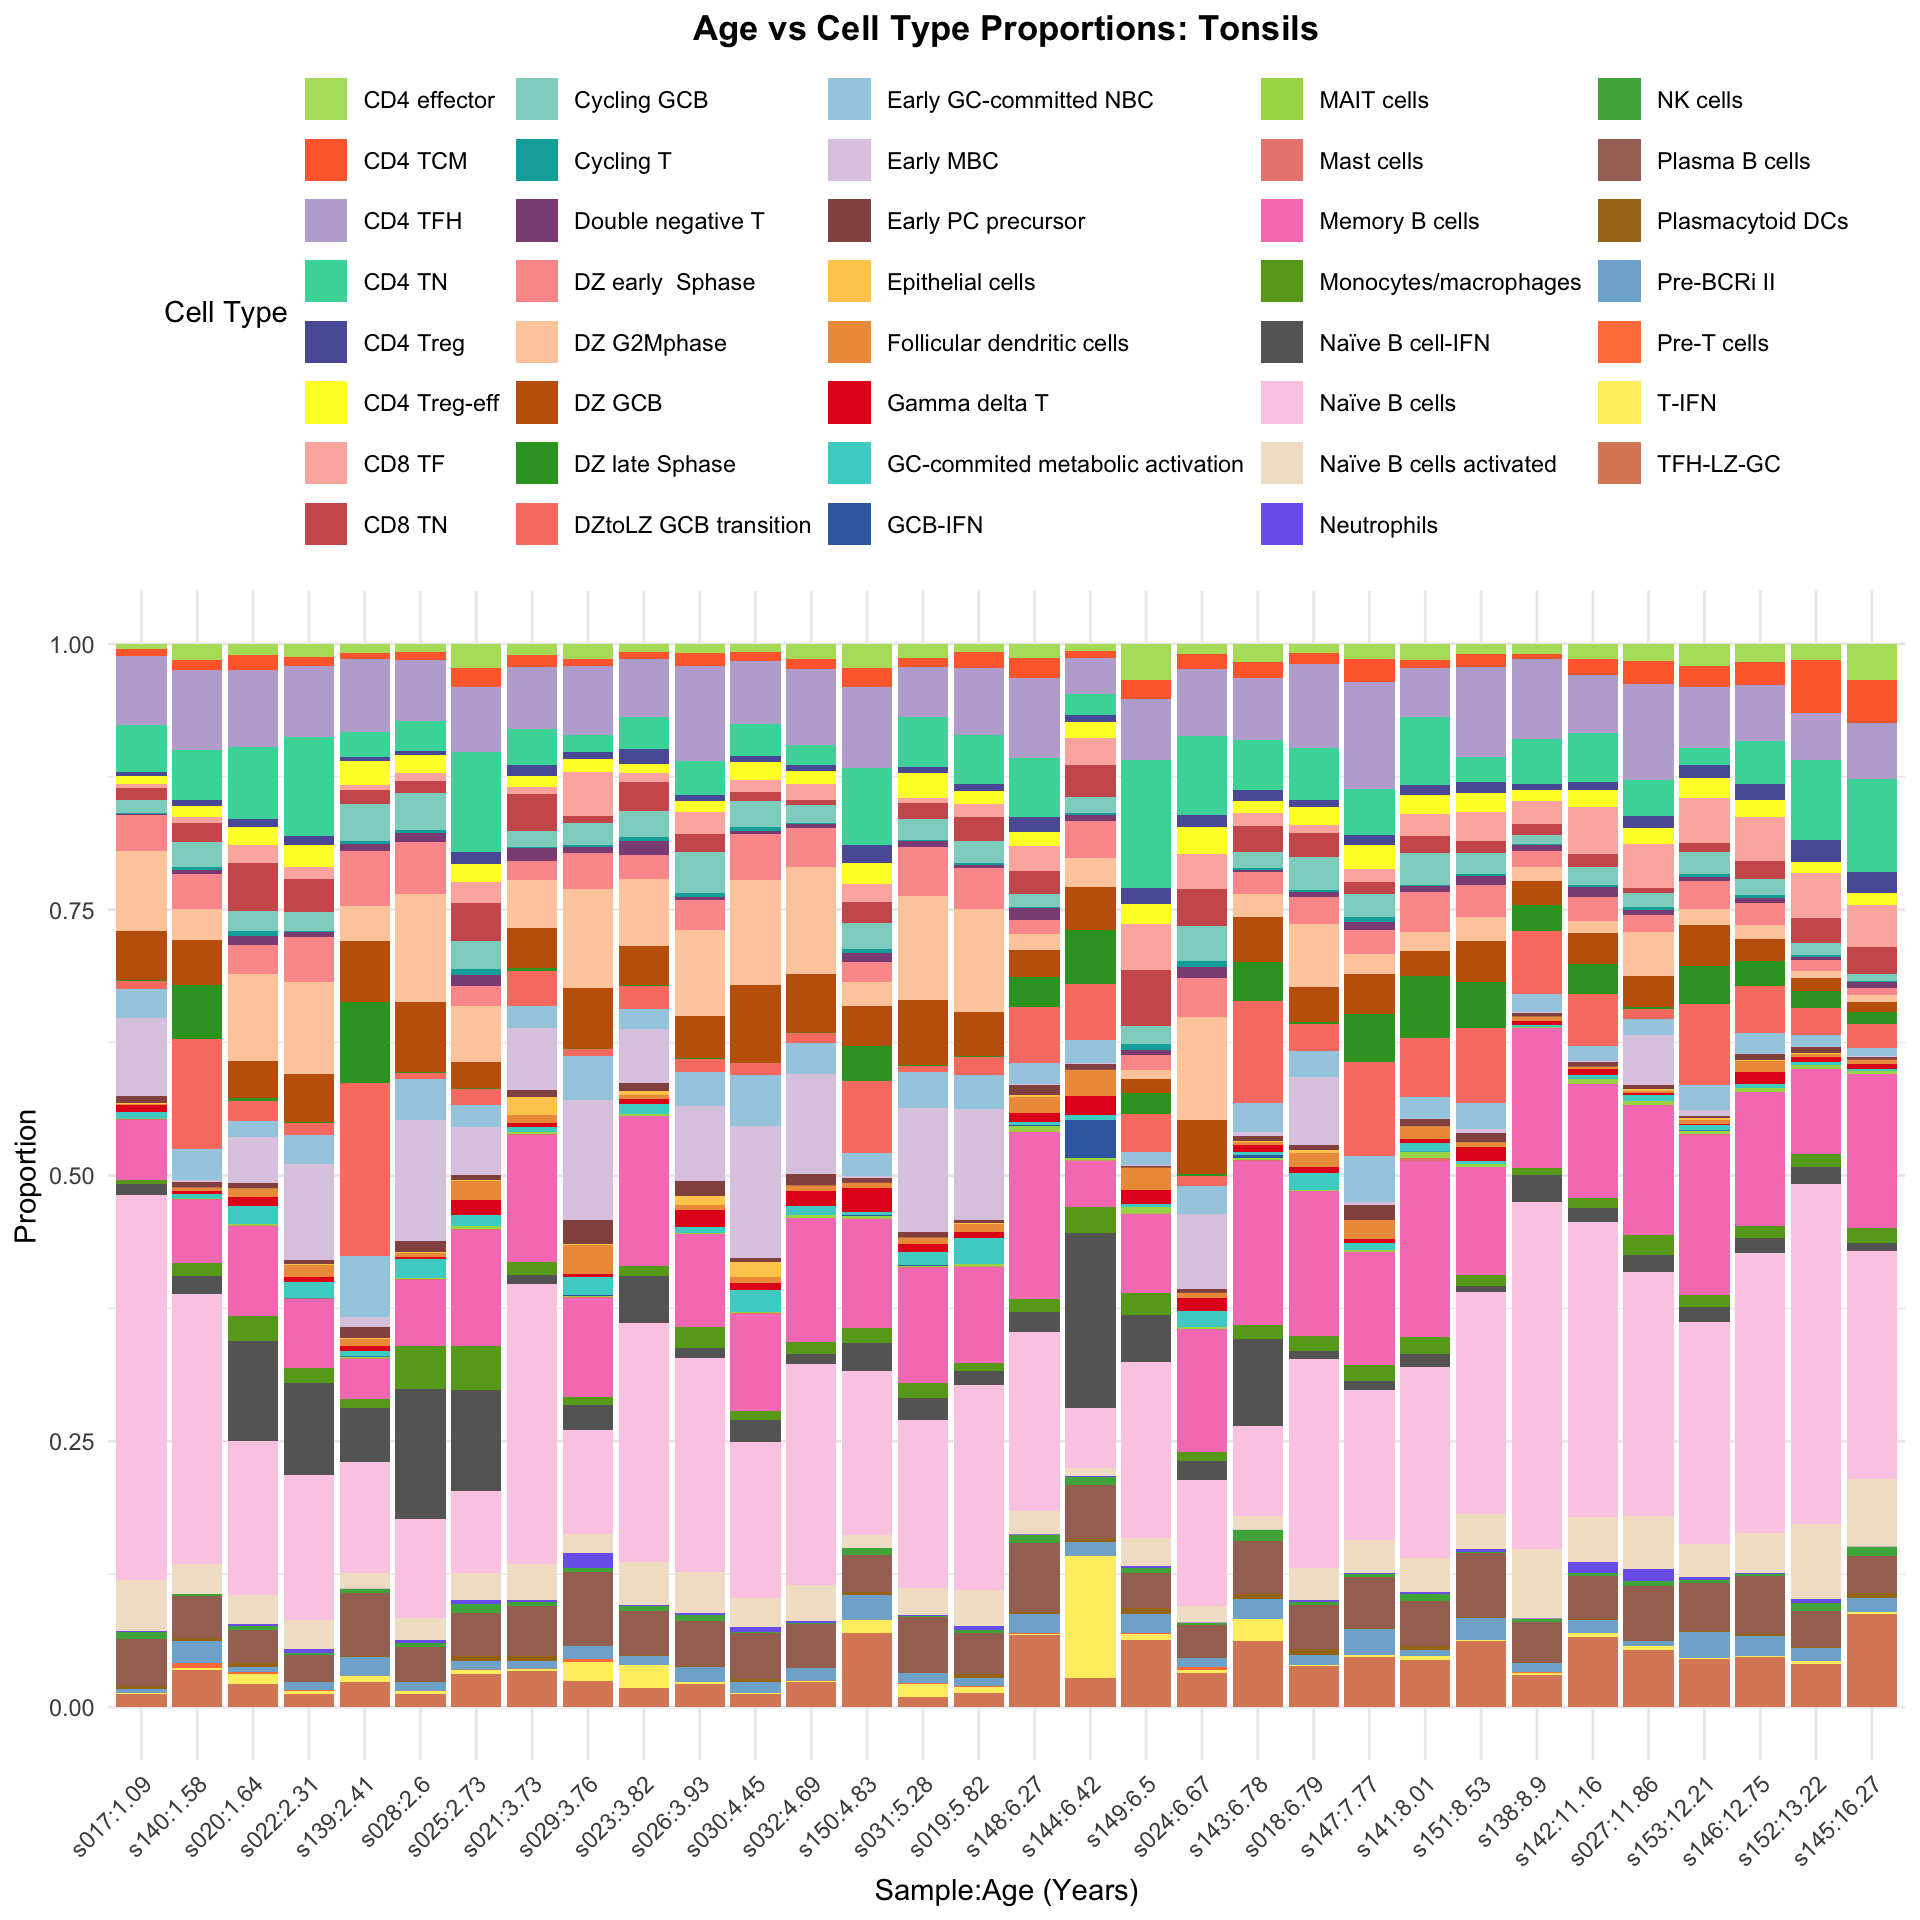
| Version | Author | Date |
|---|---|---|
| 0f07f72 | Gunjan Dixit | 2024-10-07 |
Calculate proportions using Propeller
props <- getTransformedProps(clusters = merged_obj$cell_labels_v2,
                               sample = merged_obj$sample_id, transform = "asin")
Performing arcsin square root transformation of proportionscat('### ', tissue, '\n')### Tonsils # Plot Cell Type Mean Variance
p1 <- plotCellTypeMeanVar(props$Counts)Using classic mode.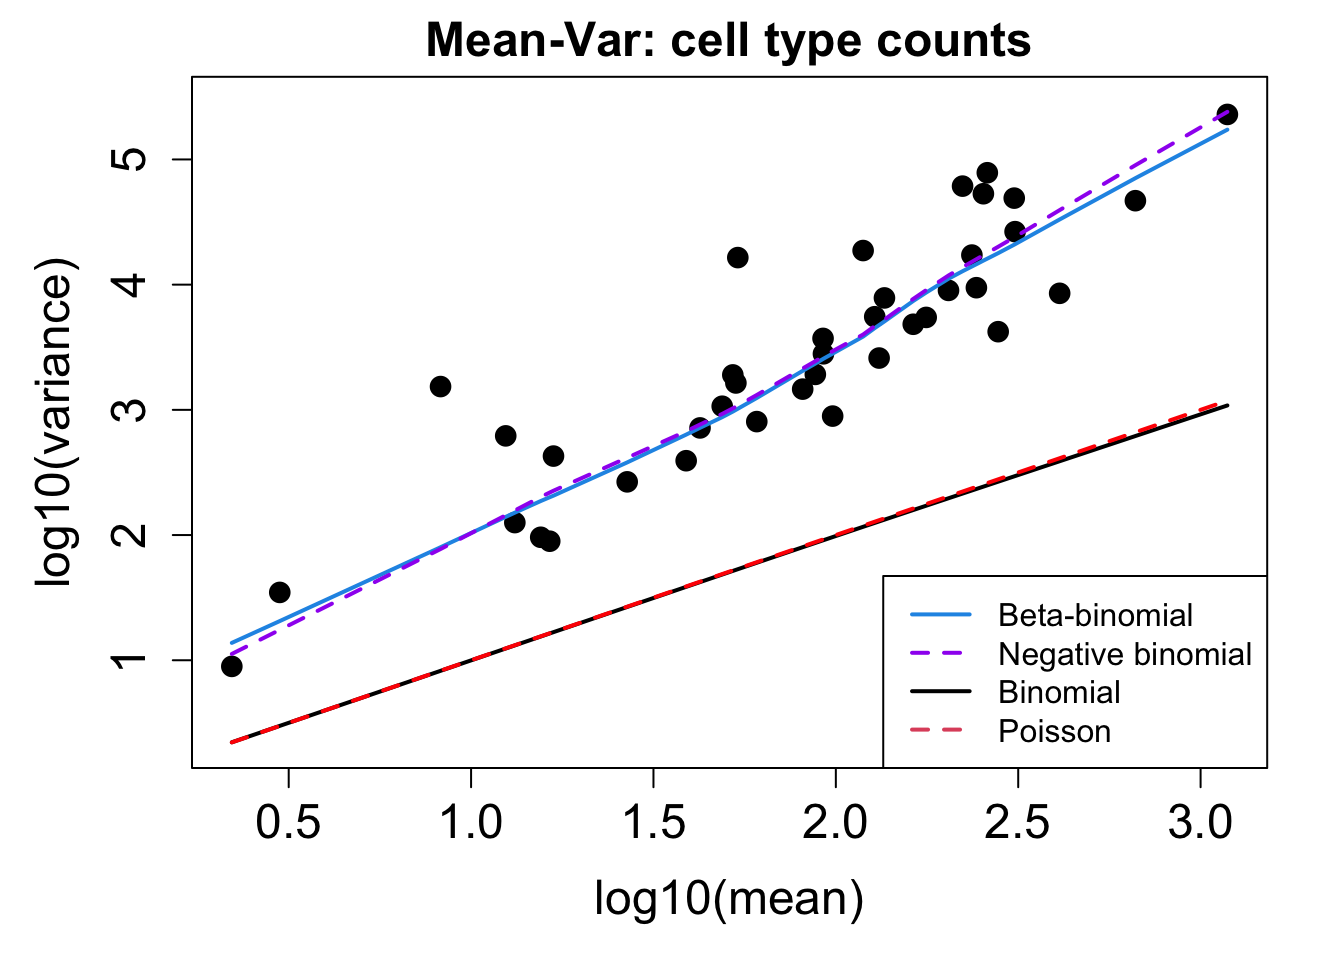
| Version | Author | Date |
|---|---|---|
| 0f07f72 | Gunjan Dixit | 2024-10-07 |
# Plot Cell Type Proportions Mean Variance
p2 <- plotCellTypePropsMeanVar(props$Counts)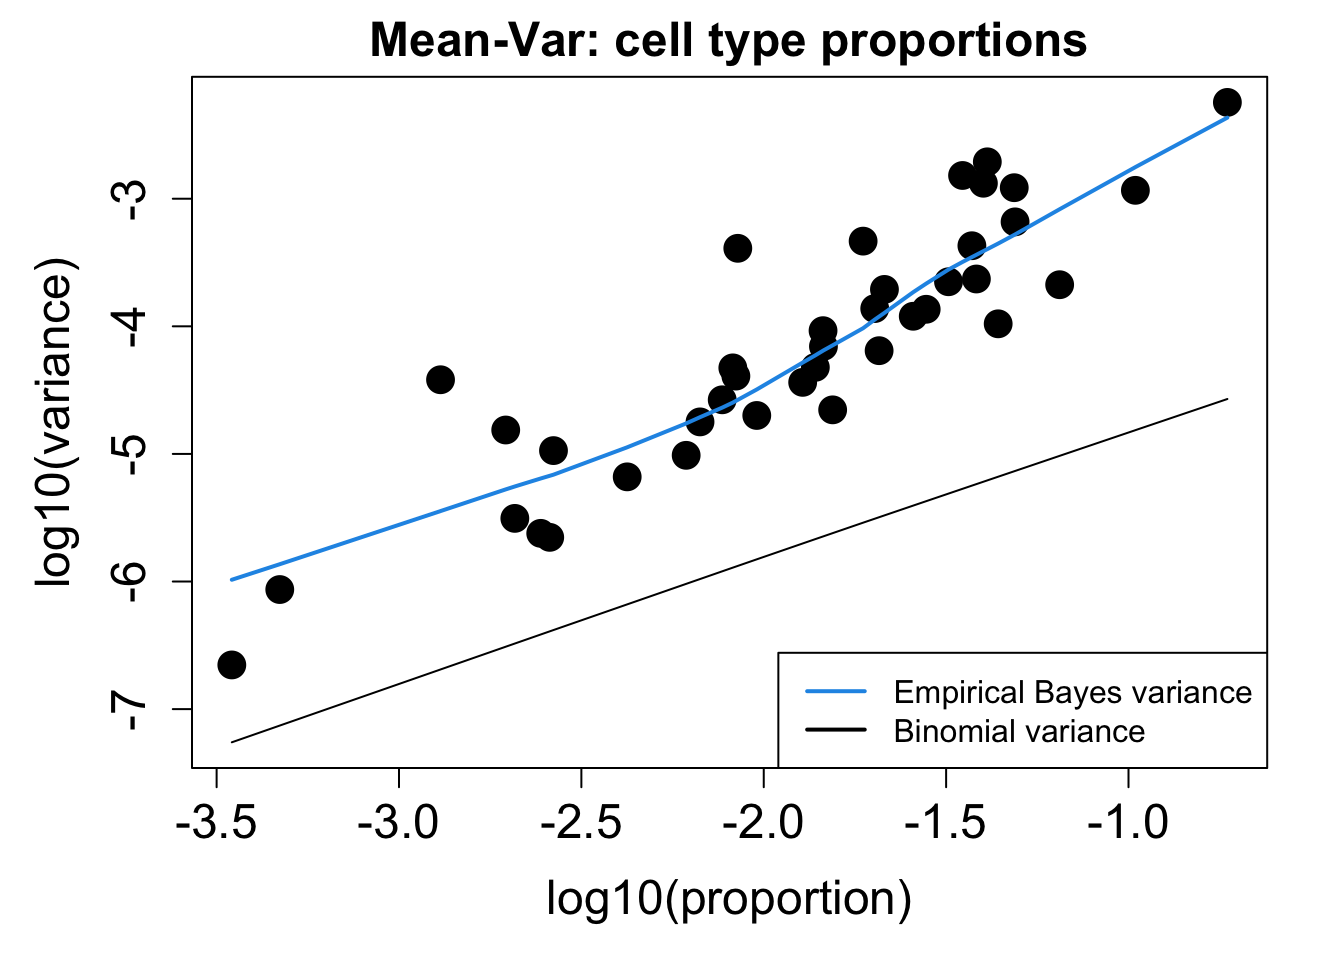
| Version | Author | Date |
|---|---|---|
| 0f07f72 | Gunjan Dixit | 2024-10-07 |
p1 / p2numeric(0)print(knitr::kable(props$Proportions, caption = "Cell-type proportions in samples"))
Table: Cell-type proportions in samples

|                                 |      s017|      s018|      s019|      s020|      s021|      s022|      s023|      s024|      s025|      s026|      s027|      s028|      s029|      s030|      s031|      s032|      s138|      s139|      s140|      s141|      s142|      s143|      s144|      s145|      s146|      s147|      s148|      s149|      s150|      s151|      s152|      s153|
|:--------------------------------|---------:|---------:|---------:|---------:|---------:|---------:|---------:|---------:|---------:|---------:|---------:|---------:|---------:|---------:|---------:|---------:|---------:|---------:|---------:|---------:|---------:|---------:|---------:|---------:|---------:|---------:|---------:|---------:|---------:|---------:|---------:|---------:|
|CD4 effector                     | 0.0051455| 0.0081839| 0.0075166| 0.0106525| 0.0109062| 0.0127363| 0.0078302| 0.0098335| 0.0226036| 0.0083716| 0.0160352| 0.0078316| 0.0140918| 0.0077519| 0.0131679| 0.0143773| 0.0094178| 0.0085904| 0.0152370| 0.0152130| 0.0137840| 0.0167375| 0.0062964| 0.0336041| 0.0173704| 0.0141020| 0.0136667| 0.0341006| 0.0227383| 0.0095045| 0.0153790| 0.0203961|
|CD4 TCM                          | 0.0065927| 0.0106216| 0.0154753| 0.0136485| 0.0104250| 0.0084462| 0.0065939| 0.0136358| 0.0179992| 0.0126924| 0.0218533| 0.0076685| 0.0070459| 0.0080965| 0.0086272| 0.0097144| 0.0051370| 0.0058571| 0.0092175| 0.0078600| 0.0155070| 0.0150106| 0.0066742| 0.0408666| 0.0217798| 0.0213854| 0.0181667| 0.0180449| 0.0177529| 0.0126727| 0.0495748| 0.0206332|
|CD4 TFH                          | 0.0641582| 0.0795751| 0.0624908| 0.0722370| 0.0588613| 0.0666309| 0.0541933| 0.0630654| 0.0615320| 0.0893870| 0.0899674| 0.0566161| 0.0644441| 0.0599483| 0.0466172| 0.0711094| 0.0751712| 0.0681374| 0.0750564| 0.0461460| 0.0540755| 0.0587141| 0.0345045| 0.0521910| 0.0522448| 0.1005734| 0.0756667| 0.0572606| 0.0766051| 0.0841465| 0.0439660| 0.0568007|
|CD4 TN                           | 0.0443801| 0.0485809| 0.0461312| 0.0684088| 0.0336808| 0.0930420| 0.0304966| 0.0744723| 0.0939724| 0.0315960| 0.0336313| 0.0282265| 0.0163258| 0.0294574| 0.0470713| 0.0190402| 0.0421233| 0.0236236| 0.0477803| 0.0631339| 0.0461233| 0.0468916| 0.0193930| 0.0877646| 0.0407536| 0.0441655| 0.0550000| 0.1206309| 0.0722276| 0.0238246| 0.0756287| 0.0162457|
|CD4 Treg                         | 0.0041807| 0.0066168| 0.0067797| 0.0069907| 0.0104250| 0.0080440| 0.0135998| 0.0116691| 0.0104646| 0.0055361| 0.0117781| 0.0040790| 0.0065303| 0.0060293| 0.0062055| 0.0054401| 0.0056507| 0.0042952| 0.0056433| 0.0096349| 0.0080848| 0.0103613| 0.0065483| 0.0203102| 0.0148316| 0.0088331| 0.0141667| 0.0143507| 0.0165370| 0.0097580| 0.0209879| 0.0118582|
|CD4 Treg-eff                     | 0.0073967| 0.0168901| 0.0119381| 0.0169774| 0.0101043| 0.0205121| 0.0088605| 0.0249115| 0.0177899| 0.0102619| 0.0146161| 0.0169685| 0.0118577| 0.0168820| 0.0231573| 0.0118516| 0.0102740| 0.0226474| 0.0103461| 0.0177485| 0.0159046| 0.0115569| 0.0148596| 0.0107090| 0.0163014| 0.0230900| 0.0133333| 0.0194658| 0.0196984| 0.0182486| 0.0101321| 0.0190917|
|CD8 TF                           | 0.0033767| 0.0074874| 0.0126750| 0.0171438| 0.0070569| 0.0119319| 0.0080363| 0.0326472| 0.0190456| 0.0207940| 0.0420037| 0.0078316| 0.0417598| 0.0113695| 0.0051461| 0.0149602| 0.0217466| 0.0044904| 0.0048909| 0.0212982| 0.0441352| 0.0118225| 0.0258154| 0.0397587| 0.0410208| 0.0120874| 0.0233333| 0.0431941| 0.0172665| 0.0271195| 0.0423376| 0.0419779|
|CD8 TN                           | 0.0120598| 0.0224621| 0.0219602| 0.0451065| 0.0348035| 0.0305671| 0.0271997| 0.0352694| 0.0362076| 0.0167432| 0.0046828| 0.0110948| 0.0060148| 0.0080965| 0.0145300| 0.0048572| 0.0099315| 0.0132761| 0.0178706| 0.0152130| 0.0125911| 0.0245749| 0.0295933| 0.0256032| 0.0165687| 0.0106927| 0.0218333| 0.0527138| 0.0199416| 0.0111519| 0.0231590| 0.0084193|
|Cycling GCB                      | 0.0114166| 0.0308201| 0.0212233| 0.0188083| 0.0149158| 0.0182330| 0.0251391| 0.0331716| 0.0259523| 0.0391574| 0.0129133| 0.0345897| 0.0209658| 0.0246339| 0.0199788| 0.0172916| 0.0092466| 0.0343616| 0.0237020| 0.0304260| 0.0165673| 0.0151435| 0.0151114| 0.0059084| 0.0156334| 0.0218503| 0.0120000| 0.0164820| 0.0244407| 0.0204030| 0.0113986| 0.0209890|
|Cycling T                        | 0.0012864| 0.0024378| 0.0022108| 0.0046605| 0.0006415| 0.0012066| 0.0032969| 0.0051134| 0.0060695| 0.0035107| 0.0024124| 0.0034263| 0.0022341| 0.0034453| 0.0009081| 0.0007772| 0.0008562| 0.0031238| 0.0030098| 0.0012677| 0.0021206| 0.0022582| 0.0018889| 0.0009847| 0.0021379| 0.0049589| 0.0011667| 0.0058255| 0.0034047| 0.0012673| 0.0023521| 0.0026088|
|Double negative T                | 0.0012864| 0.0041790| 0.0028003| 0.0083222| 0.0120289| 0.0045583| 0.0129817| 0.0107513| 0.0102553| 0.0024305| 0.0055343| 0.0079948| 0.0053274| 0.0031008| 0.0057515| 0.0033029| 0.0047945| 0.0060523| 0.0039503| 0.0055781| 0.0087475| 0.0015940| 0.0061705| 0.0064008| 0.0050775| 0.0074384| 0.0113333| 0.0046888| 0.0087549| 0.0088709| 0.0023521| 0.0036760|
|DZ early  Sphase                 | 0.0332851| 0.0252481| 0.0380251| 0.0272969| 0.0184443| 0.0419627| 0.0230785| 0.0367117| 0.0186270| 0.0290305| 0.0154676| 0.0484581| 0.0343702| 0.0428941| 0.0455577| 0.0374976| 0.0150685| 0.0517376| 0.0325433| 0.0377789| 0.0227966| 0.0208555| 0.0341267| 0.0057853| 0.0204436| 0.0224702| 0.0130000| 0.0144928| 0.0183609| 0.0299075| 0.0101321| 0.0267995|
|DZ G2Mphase                      | 0.0752533| 0.0597249| 0.0966839| 0.0823901| 0.0449078| 0.0864727| 0.0624356| 0.0963682| 0.0527417| 0.0800702| 0.0417199| 0.1016479| 0.0929713| 0.0990525| 0.0979264| 0.1002526| 0.0138699| 0.0335806| 0.0289691| 0.0174949| 0.0113983| 0.0211211| 0.0275784| 0.0070162| 0.0134955| 0.0190609| 0.0153333| 0.0082410| 0.0232247| 0.0229375| 0.0066944| 0.0149413|
|DZ GCB                           | 0.0463097| 0.0332579| 0.0415623| 0.0342876| 0.0378508| 0.0454485| 0.0368844| 0.0506097| 0.0251151| 0.0396975| 0.0292323| 0.0662425| 0.0567108| 0.0737295| 0.0612986| 0.0555663| 0.0226027| 0.0566185| 0.0423251| 0.0233266| 0.0295560| 0.0429065| 0.0402972| 0.0096012| 0.0209781| 0.0373470| 0.0256667| 0.0129298| 0.0373298| 0.0385249| 0.0128460| 0.0383019|
|DZ late Sphase                   | 0.0006432| 0.0010448| 0.0008843| 0.0026631| 0.0030473| 0.0005363| 0.0014424| 0.0019667| 0.0006279| 0.0009452| 0.0015609| 0.0009790| 0.0003437| 0.0001723| 0.0012108| 0.0003886| 0.0239726| 0.0769231| 0.0507901| 0.0585700| 0.0280981| 0.0366631| 0.0513789| 0.0113245| 0.0233832| 0.0452503| 0.0276667| 0.0194658| 0.0330739| 0.0428336| 0.0151981| 0.0361674|
|DZtoLZ GCB transition            | 0.0082007| 0.0261188| 0.0172439| 0.0189747| 0.0328789| 0.0111275| 0.0210179| 0.0094401| 0.0148598| 0.0120173| 0.0093657| 0.0055474| 0.0070459| 0.0111972| 0.0059028| 0.0087430| 0.0595890| 0.1622413| 0.1038375| 0.0550203| 0.0486415| 0.0957758| 0.0525123| 0.0224028| 0.0439604| 0.0887959| 0.0530000| 0.0356635| 0.0671206| 0.0705867| 0.0253302| 0.0761295|
|Early GC-committed NBC           | 0.0270140| 0.0236810| 0.0318349| 0.0149800| 0.0203689| 0.0280198| 0.0195755| 0.0266160| 0.0200921| 0.0325412| 0.0154676| 0.0389949| 0.0405568| 0.0478898| 0.0339034| 0.0295318| 0.0167808| 0.0572042| 0.0287810| 0.0210446| 0.0144467| 0.0270988| 0.0210301| 0.0076317| 0.0195083| 0.0429258| 0.0200000| 0.0126456| 0.0218872| 0.0248384| 0.0117604| 0.0235978|
|Early MBC                        | 0.0736453| 0.0647745| 0.1042004| 0.0437750| 0.0587009| 0.0895562| 0.0502782| 0.0708011| 0.0458351| 0.0704834| 0.0465446| 0.1132322| 0.1135934| 0.1238587| 0.1159376| 0.0940354| 0.0006849| 0.0093713| 0.0022573| 0.0002535| 0.0006627| 0.0039851| 0.0010074| 0.0007386| 0.0002672| 0.0024795| 0.0006667| 0.0007104| 0.0015807| 0.0032949| 0.0001809| 0.0049804|
|Early PC precursor               | 0.0064319| 0.0045273| 0.0028003| 0.0049933| 0.0057739| 0.0045583| 0.0074181| 0.0031467| 0.0041859| 0.0141777| 0.0036895| 0.0107685| 0.0219969| 0.0039621| 0.0059028| 0.0108801| 0.0035959| 0.0111285| 0.0052671| 0.0070994| 0.0049039| 0.0047821| 0.0057927| 0.0028311| 0.0058792| 0.0139470| 0.0090000| 0.0019892| 0.0047422| 0.0095045| 0.0056088| 0.0027274|
|Epithelial cells                 | 0.0003216| 0.0027860| 0.0011791| 0.0004993| 0.0171612| 0.0001341| 0.0043272| 0.0001311| 0.0010465| 0.0079665| 0.0017029| 0.0006526| 0.0010311| 0.0141258| 0.0003027| 0.0003886| 0.0003425| 0.0001952| 0.0003762| 0.0005071| 0.0002651| 0.0009299| 0.0001259| 0.0002462| 0.0010689| 0.0000000| 0.0018333| 0.0002842| 0.0001216| 0.0005069| 0.0009046| 0.0013044|
|Follicular dendritic cells       | 0.0017688| 0.0125370| 0.0073692| 0.0069907| 0.0075381| 0.0120660| 0.0032969| 0.0048512| 0.0179992| 0.0048609| 0.0019867| 0.0042421| 0.0271524| 0.0055125| 0.0054488| 0.0048572| 0.0042808| 0.0064428| 0.0026336| 0.0106491| 0.0010603| 0.0027896| 0.0244302| 0.0036928| 0.0097541| 0.0179761| 0.0150000| 0.0208866| 0.0049854| 0.0036751| 0.0027139| 0.0037946|
|Gamma delta T                    | 0.0065927| 0.0059203| 0.0056006| 0.0093209| 0.0040096| 0.0041561| 0.0049454| 0.0120624| 0.0142319| 0.0157980| 0.0024124| 0.0011421| 0.0030933| 0.0065461| 0.0069623| 0.0134059| 0.0032534| 0.0054666| 0.0031979| 0.0043103| 0.0063618| 0.0066419| 0.0180078| 0.0046775| 0.0113576| 0.0044940| 0.0085000| 0.0127877| 0.0227383| 0.0124192| 0.0043423| 0.0014230|
|GC-commited metabolic activation | 0.0061103| 0.0158454| 0.0250553| 0.0166445| 0.0049719| 0.0156857| 0.0092726| 0.0152091| 0.0106739| 0.0056711| 0.0052505| 0.0177843| 0.0173569| 0.0206718| 0.0128651| 0.0087430| 0.0018836| 0.0048809| 0.0043266| 0.0081136| 0.0030484| 0.0025239| 0.0050371| 0.0012309| 0.0037413| 0.0057338| 0.0028333| 0.0026996| 0.0029183| 0.0035483| 0.0030758| 0.0049804|
|GCB-IFN                          | 0.0000000| 0.0000000| 0.0000000| 0.0000000| 0.0000000| 0.0001341| 0.0000000| 0.0000000| 0.0000000| 0.0000000| 0.0000000| 0.0000000| 0.0003437| 0.0000000| 0.0003027| 0.0000000| 0.0000000| 0.0005857| 0.0000000| 0.0002535| 0.0001325| 0.0029224| 0.0350082| 0.0000000| 0.0000000| 0.0000000| 0.0008333| 0.0000000| 0.0004864| 0.0000000| 0.0000000| 0.0005929|
|MAIT cells                       | 0.0003216| 0.0012189| 0.0023581| 0.0013316| 0.0016038| 0.0004022| 0.0022666| 0.0018356| 0.0025115| 0.0012152| 0.0034057| 0.0017947| 0.0015467| 0.0012059| 0.0013622| 0.0029143| 0.0010274| 0.0015619| 0.0003762| 0.0058316| 0.0050364| 0.0019926| 0.0031482| 0.0030773| 0.0037413| 0.0018596| 0.0056667| 0.0062518| 0.0025535| 0.0024078| 0.0036186| 0.0028460|
|Mast cells                       | 0.0003216| 0.0000000| 0.0004422| 0.0003329| 0.0004812| 0.0002681| 0.0000000| 0.0000000| 0.0008372| 0.0001350| 0.0000000| 0.0003263| 0.0003437| 0.0003445| 0.0007568| 0.0000000| 0.0001712| 0.0005857| 0.0003762| 0.0025355| 0.0001325| 0.0002657| 0.0005037| 0.0000000| 0.0000000| 0.0001550| 0.0001667| 0.0002842| 0.0002432| 0.0000000| 0.0001809| 0.0009487|
|Memory B cells                   | 0.0566007| 0.1366881| 0.0899042| 0.0850533| 0.1198075| 0.0647540| 0.1405316| 0.1160351| 0.1092507| 0.0870915| 0.1228892| 0.0618372| 0.0933150| 0.0911283| 0.1085213| 0.1169613| 0.1313356| 0.0368996| 0.0594432| 0.1653144| 0.1070908| 0.1544899| 0.0431936| 0.1453717| 0.1265366| 0.1063071| 0.1576667| 0.0740267| 0.1026265| 0.1013813| 0.0796092| 0.1504803|
|Monocytes/macrophages            | 0.0040199| 0.0141041| 0.0079587| 0.0228029| 0.0118685| 0.0136748| 0.0090666| 0.0083912| 0.0414399| 0.0199838| 0.0183057| 0.0407897| 0.0073896| 0.0089578| 0.0140760| 0.0110744| 0.0070205| 0.0091761| 0.0126035| 0.0159736| 0.0095427| 0.0134166| 0.0241783| 0.0136632| 0.0106895| 0.0151867| 0.0118333| 0.0211708| 0.0141051| 0.0110252| 0.0123032| 0.0106724|
|Naïve B cell-IFN                 | 0.0099694| 0.0076615| 0.0131172| 0.0943742| 0.0091419| 0.0868749| 0.0451267| 0.0175692| 0.0950188| 0.0091817| 0.0167447| 0.1226954| 0.0231999| 0.0210164| 0.0208869| 0.0091315| 0.0250000| 0.0499805| 0.0165538| 0.0126775| 0.0131213| 0.0820935| 0.1644629| 0.0073855| 0.0144308| 0.0089881| 0.0191667| 0.0439045| 0.0265078| 0.0054492| 0.0162837| 0.0148227|
|Naïve B cells                    | 0.3619553| 0.1958906| 0.1921887| 0.1448069| 0.2633520| 0.1366135| 0.2239852| 0.1190507| 0.0772290| 0.2019984| 0.2287498| 0.0930005| 0.0982987| 0.1459087| 0.1574088| 0.2082767| 0.3261986| 0.1050371| 0.2535741| 0.1795132| 0.2770046| 0.0843518| 0.0560383| 0.2149188| 0.2632282| 0.1403998| 0.1676667| 0.1656721| 0.1538181| 0.2087188| 0.3200651| 0.2084667|
|Naïve B cells activated          | 0.0480785| 0.0301236| 0.0338983| 0.0274634| 0.0330393| 0.0265451| 0.0407995| 0.0154714| 0.0253244| 0.0384823| 0.0502341| 0.0207212| 0.0178725| 0.0273902| 0.0254276| 0.0338061| 0.0657534| 0.0150332| 0.0284048| 0.0319473| 0.0421471| 0.0127524| 0.0081854| 0.0638848| 0.0375468| 0.0314582| 0.0226667| 0.0261438| 0.0128891| 0.0328222| 0.0698390| 0.0310684|
|Neutrophils                      | 0.0016080| 0.0017413| 0.0042741| 0.0019973| 0.0025662| 0.0042901| 0.0012363| 0.0003933| 0.0037673| 0.0016203| 0.0107847| 0.0026105| 0.0135762| 0.0053402| 0.0007568| 0.0013600| 0.0005137| 0.0001952| 0.0000000| 0.0015213| 0.0103380| 0.0001328| 0.0006296| 0.0002462| 0.0012026| 0.0004649| 0.0006667| 0.0018471| 0.0000000| 0.0025345| 0.0037995| 0.0028460|
|NK cells                         | 0.0062711| 0.0029601| 0.0020634| 0.0033289| 0.0035285| 0.0014747| 0.0041212| 0.0017045| 0.0085810| 0.0055361| 0.0046828| 0.0037527| 0.0041244| 0.0010336| 0.0013622| 0.0017486| 0.0025685| 0.0035143| 0.0020692| 0.0065923| 0.0030484| 0.0108927| 0.0071779| 0.0082472| 0.0018707| 0.0030993| 0.0075000| 0.0045467| 0.0060798| 0.0011405| 0.0081418| 0.0023716|
|Plasma B cells                   | 0.0442193| 0.0419641| 0.0390567| 0.0316245| 0.0473136| 0.0258748| 0.0422419| 0.0306805| 0.0397656| 0.0425331| 0.0517951| 0.0324686| 0.0692559| 0.0428941| 0.0522173| 0.0411890| 0.0383562| 0.0591566| 0.0395034| 0.0428499| 0.0405567| 0.0498140| 0.0516308| 0.0344658| 0.0546499| 0.0475748| 0.0648333| 0.0329639| 0.0351411| 0.0601952| 0.0334720| 0.0452982|
|Plasmacytoid DCs                 | 0.0025728| 0.0052238| 0.0041268| 0.0038282| 0.0043304| 0.0001341| 0.0006182| 0.0001311| 0.0046044| 0.0006751| 0.0001419| 0.0004895| 0.0000000| 0.0025840| 0.0001514| 0.0000000| 0.0005137| 0.0011714| 0.0030098| 0.0032961| 0.0011928| 0.0043836| 0.0021408| 0.0049237| 0.0013362| 0.0012397| 0.0015000| 0.0058255| 0.0024319| 0.0013940| 0.0014474| 0.0010672|
|Pre-BCRi II                      | 0.0036983| 0.0095769| 0.0072218| 0.0046605| 0.0076985| 0.0072396| 0.0086544| 0.0085224| 0.0087903| 0.0145828| 0.0051086| 0.0086474| 0.0130607| 0.0101637| 0.0099894| 0.0116573| 0.0085616| 0.0173760| 0.0208804| 0.0063387| 0.0117959| 0.0185972| 0.0133484| 0.0126785| 0.0189738| 0.0241748| 0.0183333| 0.0184712| 0.0240759| 0.0200228| 0.0115795| 0.0246650|
|Pre-T cells                      | 0.0001608| 0.0000000| 0.0010317| 0.0016644| 0.0003208| 0.0005363| 0.0000000| 0.0026223| 0.0004186| 0.0000000| 0.0000000| 0.0001632| 0.0022341| 0.0000000| 0.0003027| 0.0003886| 0.0003425| 0.0001952| 0.0041384| 0.0000000| 0.0000000| 0.0000000| 0.0001259| 0.0000000| 0.0000000| 0.0000000| 0.0001667| 0.0001421| 0.0001216| 0.0000000| 0.0000000| 0.0000000|
|T-IFN                            | 0.0014472| 0.0010448| 0.0051584| 0.0091545| 0.0016038| 0.0034857| 0.0212240| 0.0032778| 0.0035580| 0.0010802| 0.0032638| 0.0019579| 0.0177006| 0.0017227| 0.0127138| 0.0005829| 0.0017123| 0.0056619| 0.0020692| 0.0030426| 0.0035785| 0.0212540| 0.1147211| 0.0024618| 0.0010689| 0.0021695| 0.0015000| 0.0065359| 0.0116732| 0.0012673| 0.0028949| 0.0010672|
|TFH-LZ-GC                        | 0.0118990| 0.0384816| 0.0135593| 0.0218043| 0.0338412| 0.0120660| 0.0179271| 0.0318605| 0.0309753| 0.0221442| 0.0540656| 0.0127264| 0.0249184| 0.0118863| 0.0093840| 0.0238974| 0.0306507| 0.0236236| 0.0349887| 0.0446247| 0.0664016| 0.0619022| 0.0273265| 0.0873954| 0.0471673| 0.0472648| 0.0676667| 0.0626598| 0.0697957| 0.0620961| 0.0407092| 0.0449425|
Set model and design matrix
merged_obj@meta.data <- merged_obj@meta.data %>%
  mutate(age_group = case_when(
    age_years >= 1 & age_years < 6  ~ "Preschool_1to5_years",
    age_years >= 6 & age_years < 12 ~ "Kids_6to11_years",
    age_years >= 12 ~ "Adolescent_12to17_years",
    TRUE ~ "Other"))
samples_metadata <- merged_obj@meta.data %>%
  dplyr::filter(donor_id %in% unique(merged_obj@meta.data$donor_id)) %>%
  dplyr::group_by(donor_id) %>%
  dplyr::summarise(
    age = dplyr::first(age_years),
    sex = dplyr::first(sex),
    batch = dplyr::first(batch_name),
    age_group = dplyr::first(age_group),
    .groups = 'drop'
  )

age <- samples_metadata$age
sex <- as.factor(samples_metadata$sex)
batch <- as.factor(samples_metadata$batch)
design <- model.matrix(~age + sex + batch)
design
(Intercept) age sexM batchG000231_batch9
1 1 1.09 1 0
2 1 6.79 0 0
3 1 5.82 0 0
4 1 1.64 1 0
5 1 3.73 1 0
6 1 2.31 1 0
7 1 3.82 1 0
8 1 6.67 0 0
9 1 2.73 1 0
10 1 3.93 1 0
11 1 11.86 0 0
12 1 2.60 0 0
13 1 3.76 1 0
14 1 4.45 1 0
15 1 5.28 0 0
16 1 4.69 0 0
17 1 8.90 1 1
18 1 2.41 1 1
19 1 1.58 0 1
20 1 8.01 1 1
21 1 11.16 1 1
22 1 6.78 1 1
23 1 6.42 1 1
24 1 16.27 0 1
25 1 12.75 1 1
26 1 7.77 0 1
27 1 6.27 1 1
28 1 6.50 1 1
29 1 4.83 0 1
30 1 8.53 0 1
31 1 13.22 0 1
32 1 12.21 0 1
attr(,"assign")
[1] 0 1 2 3
attr(,"contrasts")
attr(,"contrasts")$sex
[1] "contr.treatment"
attr(,"contrasts")$batch
[1] "contr.treatment"Linear model fitting with Limma
fit <- lmFit(props$TransformedProps, design)
fit <- eBayes(fit, robust=TRUE)
coef = "age"
toptable.transformedProps <- topTable(fit, coef = coef, number = Inf)

fit.prop <- lmFit(props$Proportions, design)
fit.prop <- eBayes(fit.prop, robust=TRUE)
toptable.props <- topTable(fit.prop, sort.by = "p", coef = coef, number = Inf)

cat(paste('### ', tissue, '\n', sep = ""))
### Tonsilsprint(knitr::kable(toptable.transformedProps, caption = paste0("Transformed proportions Toptable results: ", tissue)))
Table: Transformed proportions Toptable results: Tonsils
| | logFC| AveExpr| t| P.Value| adj.P.Val| B|
|:--------------------------------|----------:|---------:|----------:|---------:|---------:|---------:|
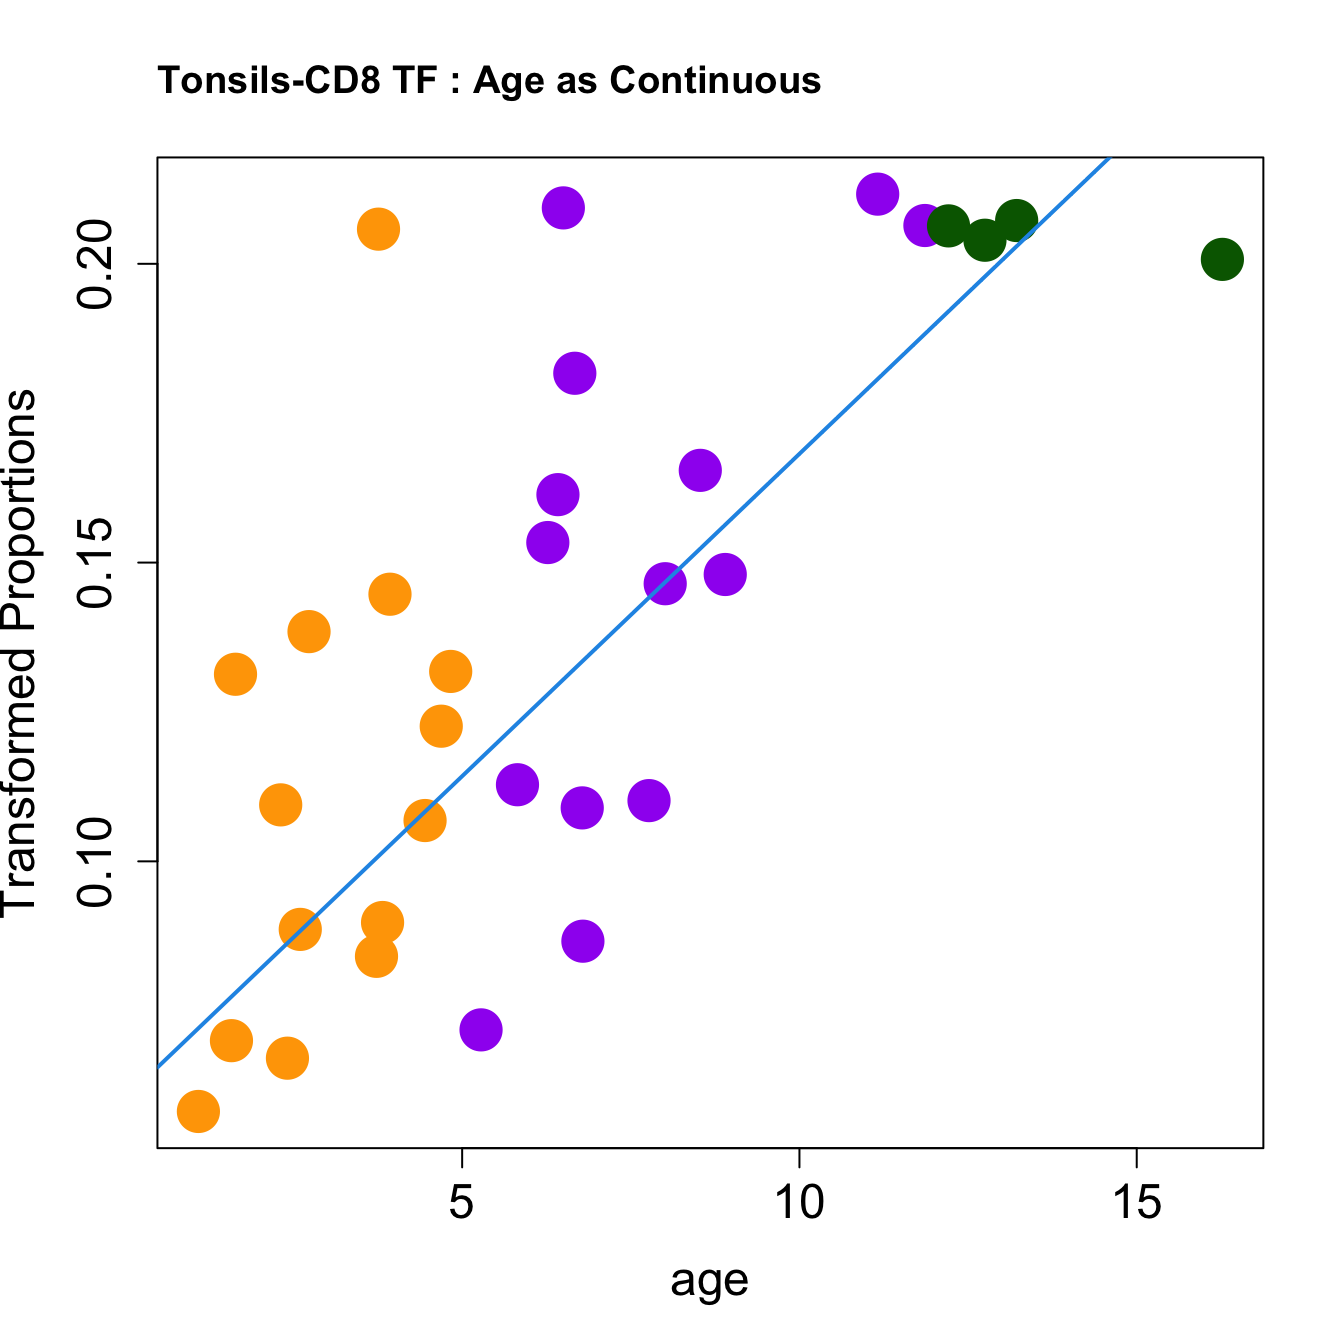
|CD8 TF | 0.0107896| 0.1387817| 5.5868472| 0.0000038| 0.0001479| 2.366465|
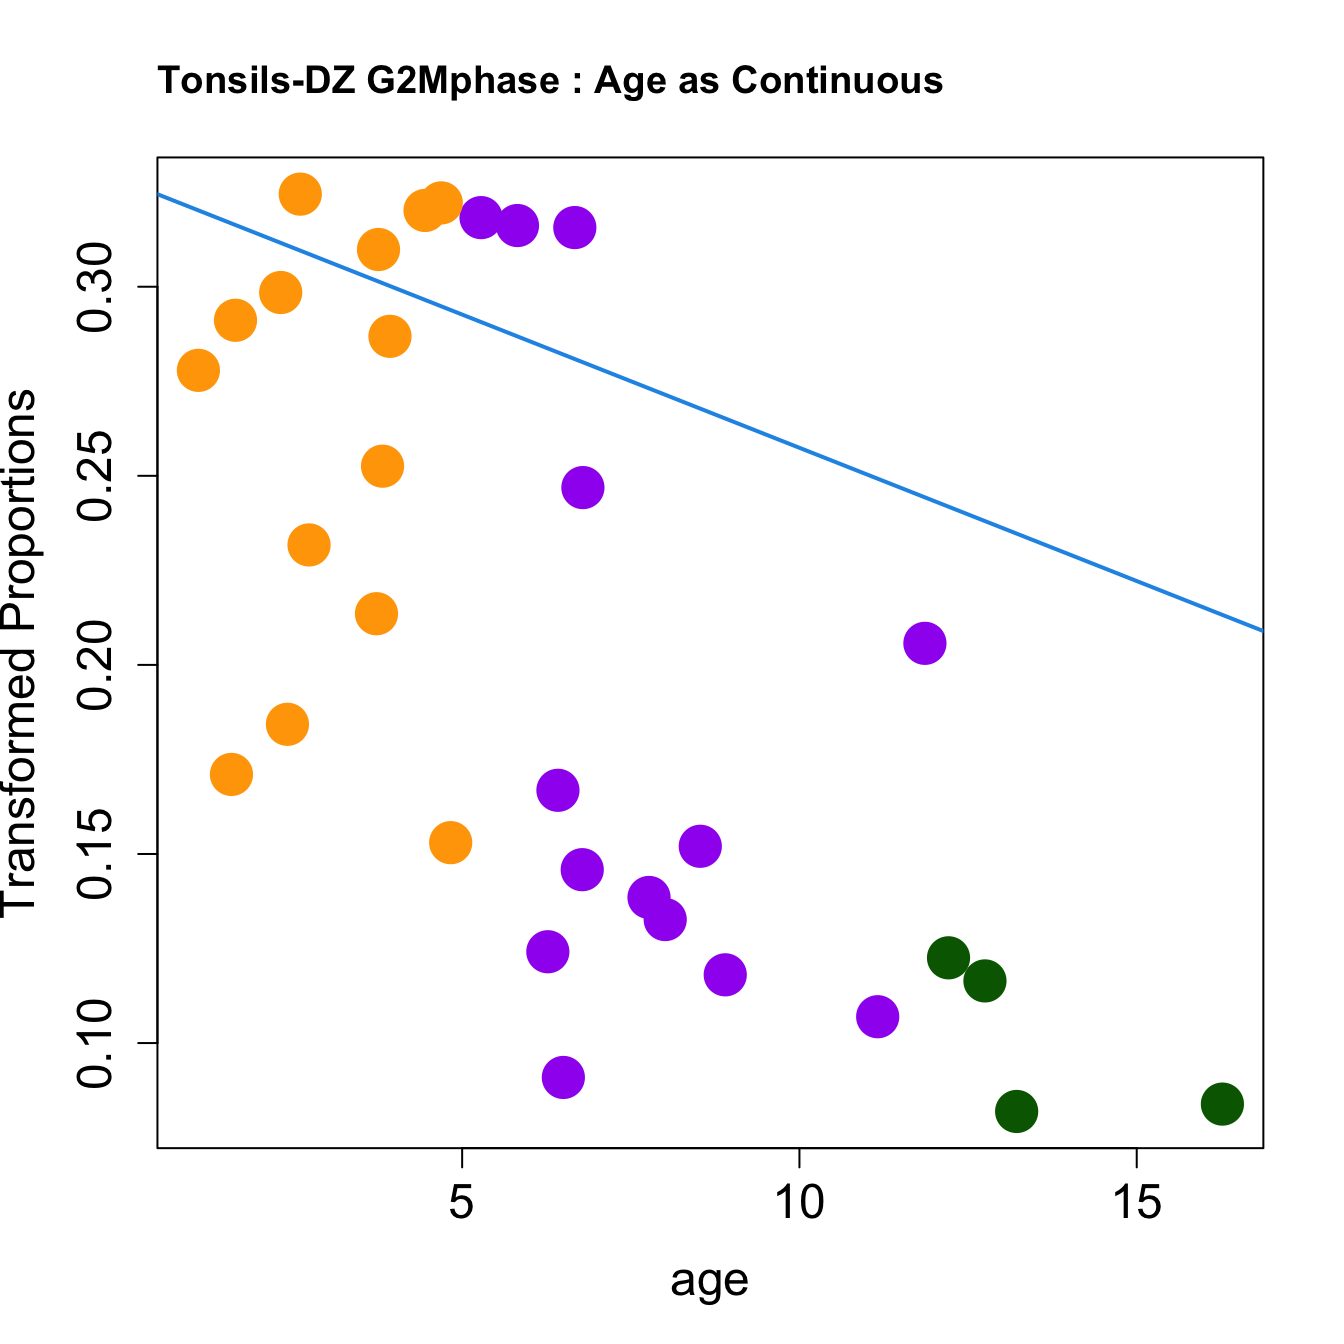
|DZ G2Mphase | -0.0070465| 0.2068927| -4.1757603| 0.0002183| 0.0042576| -1.662299|
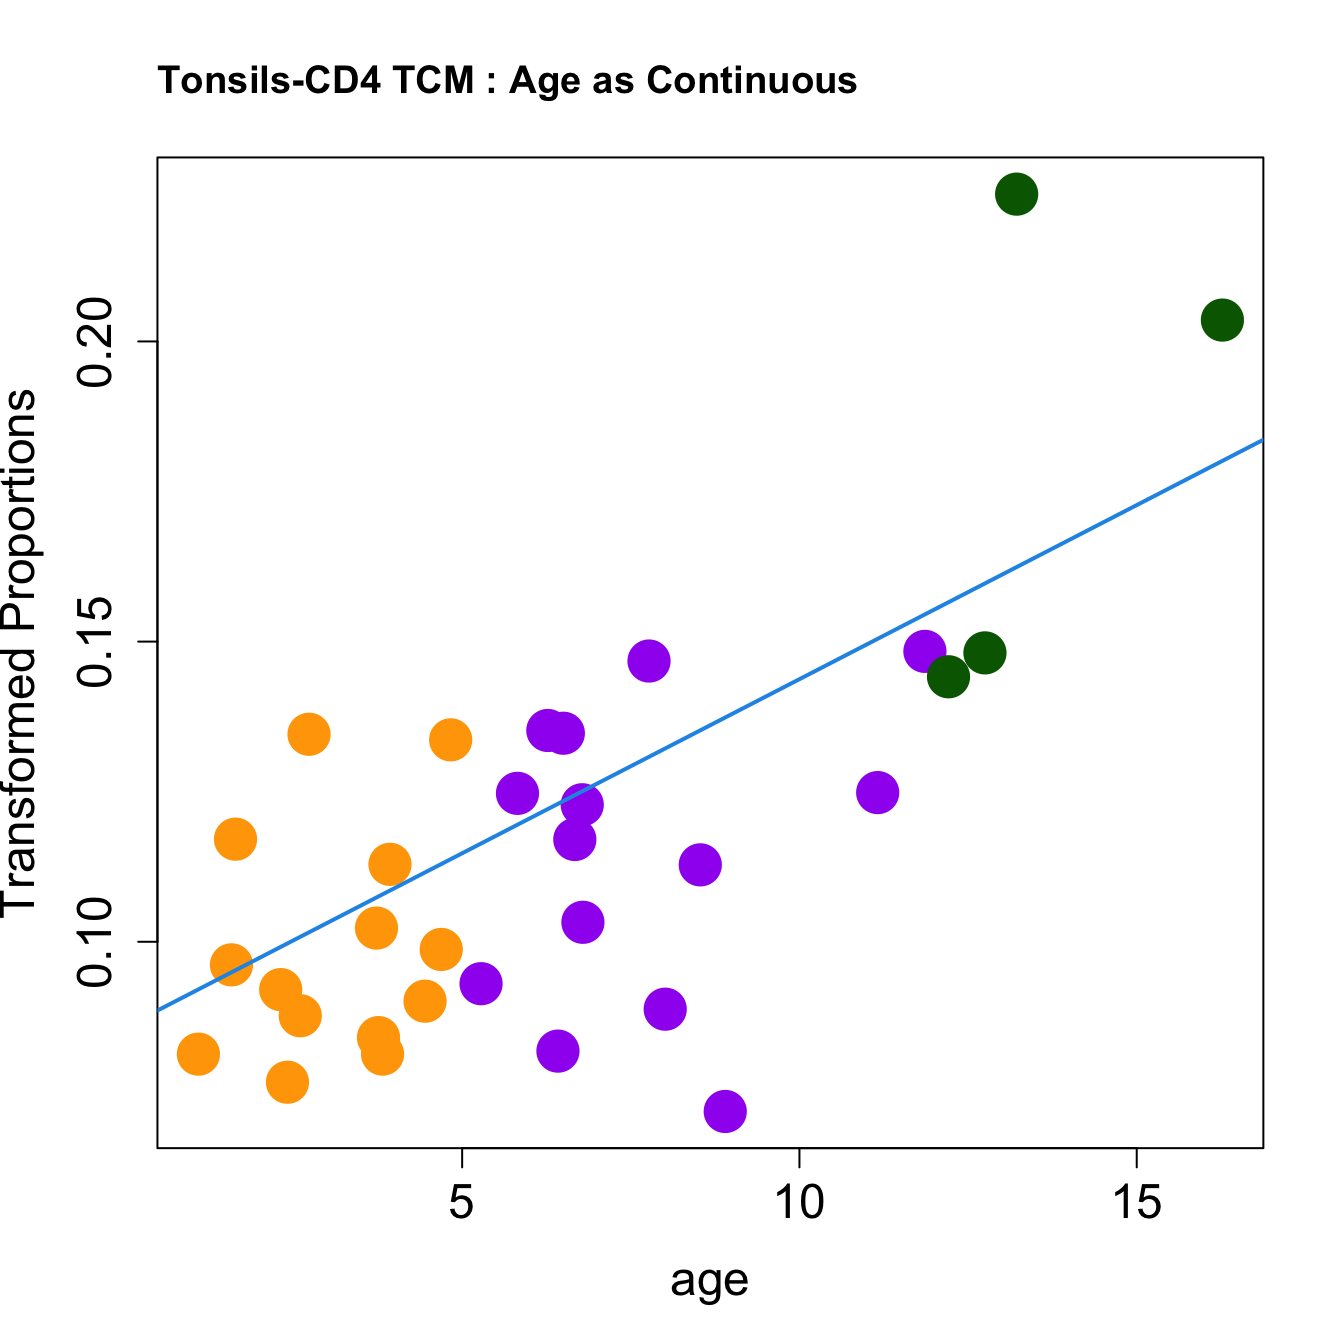
|CD4 TCM | 0.0058001| 0.1160822| 3.9742555| 0.0003843| 0.0049964| -2.216781|
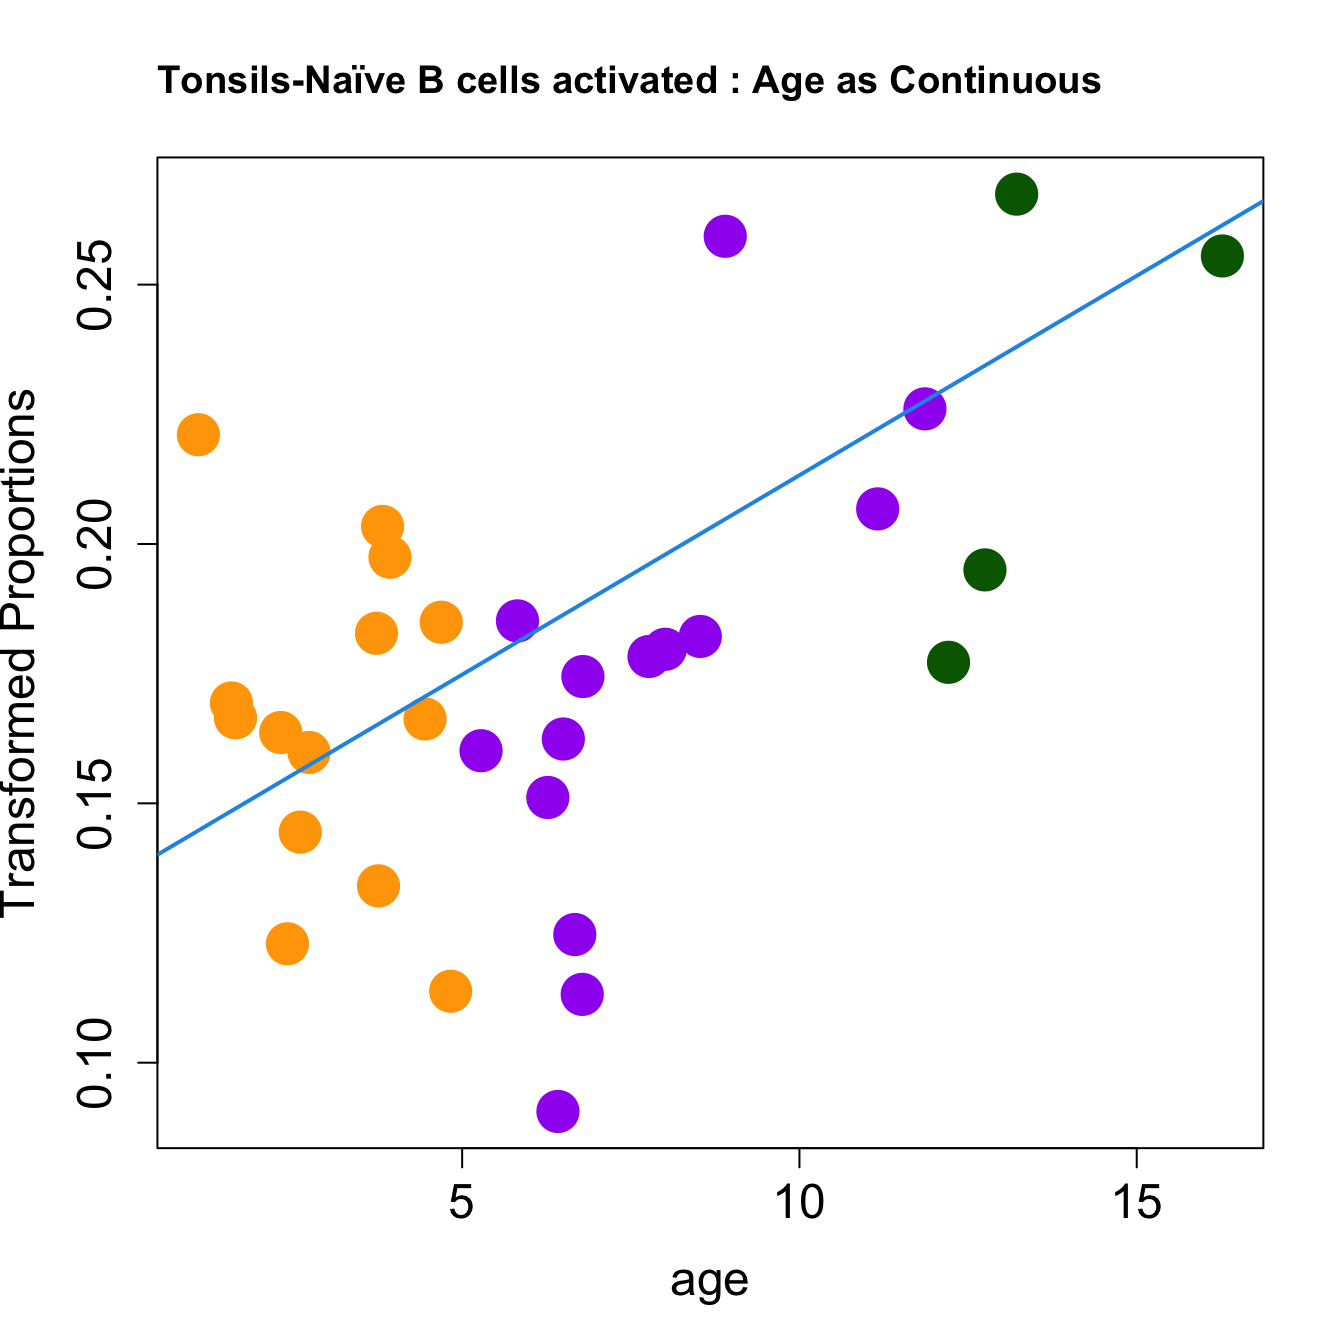
|Naïve B cells activated | 0.0076874| 0.1756144| 3.7933026| 0.0006350| 0.0050975| -2.706862|
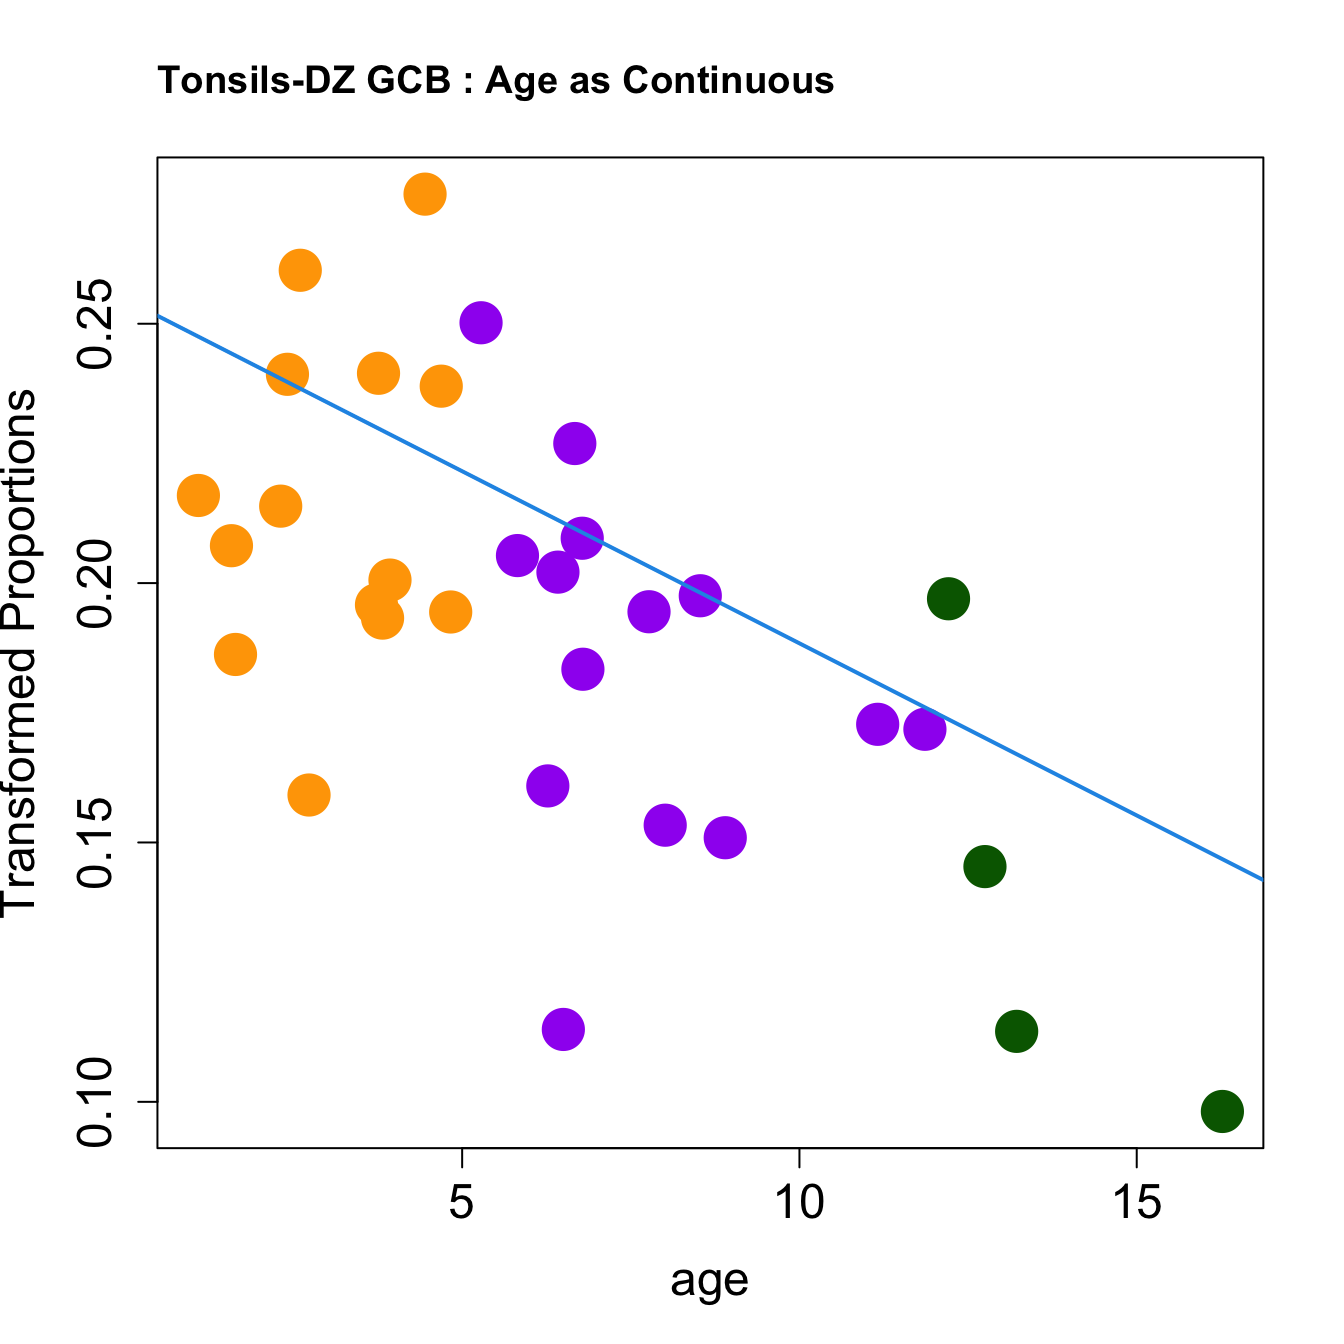
|DZ GCB | -0.0066358| 0.1927723| -3.7096080| 0.0007993| 0.0050975| -2.930685|
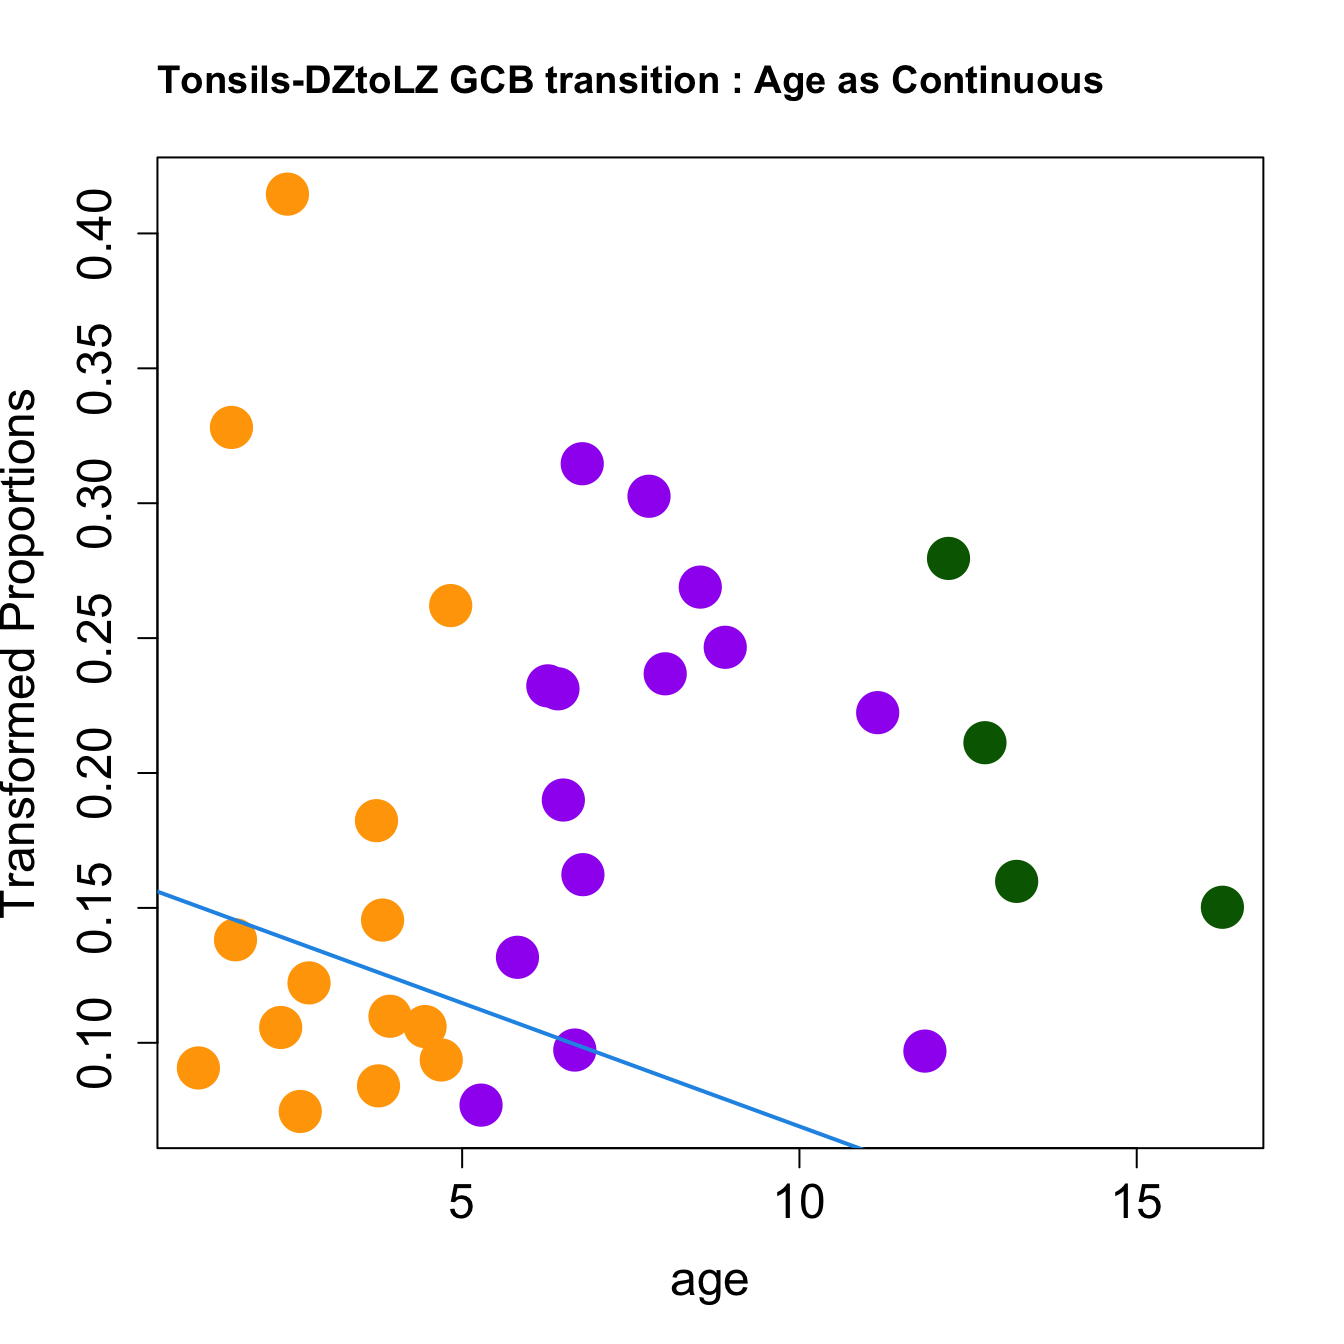
|DZtoLZ GCB transition | -0.0091466| 0.1833999| -3.6667199| 0.0008988| 0.0050975| -3.044625|
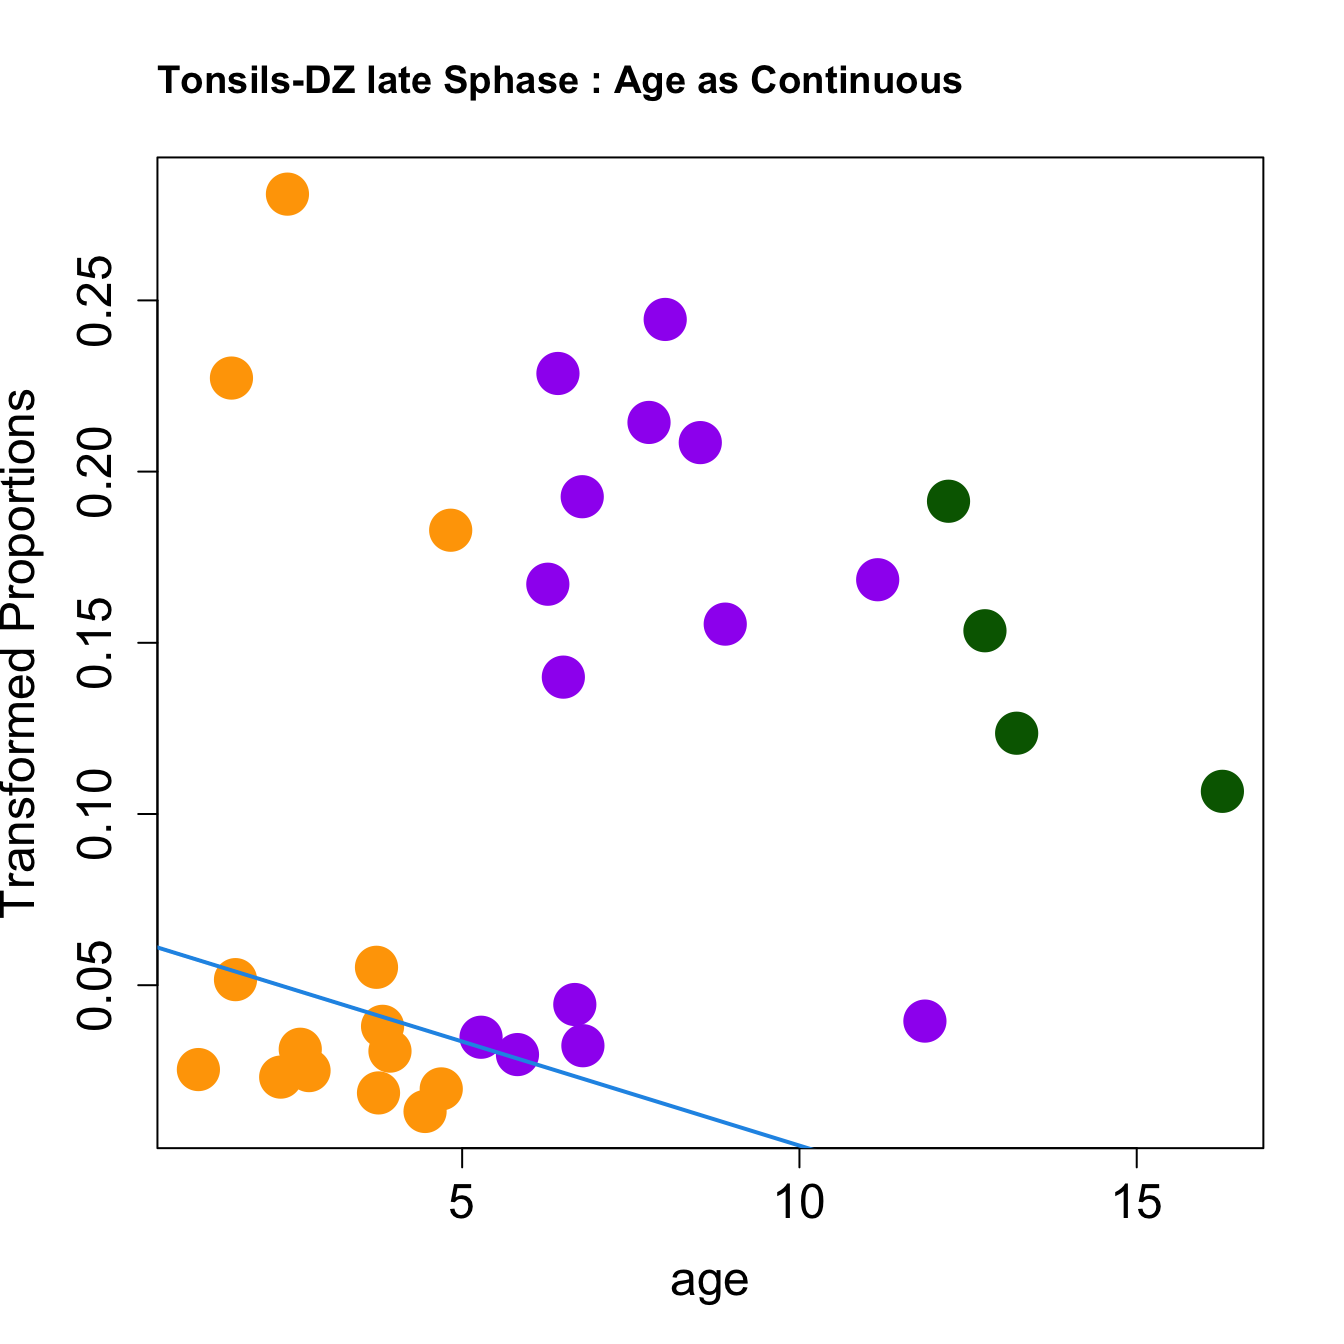
|DZ late Sphase | -0.0060822| 0.1093271| -3.6601968| 0.0009149| 0.0050975| -3.061908|
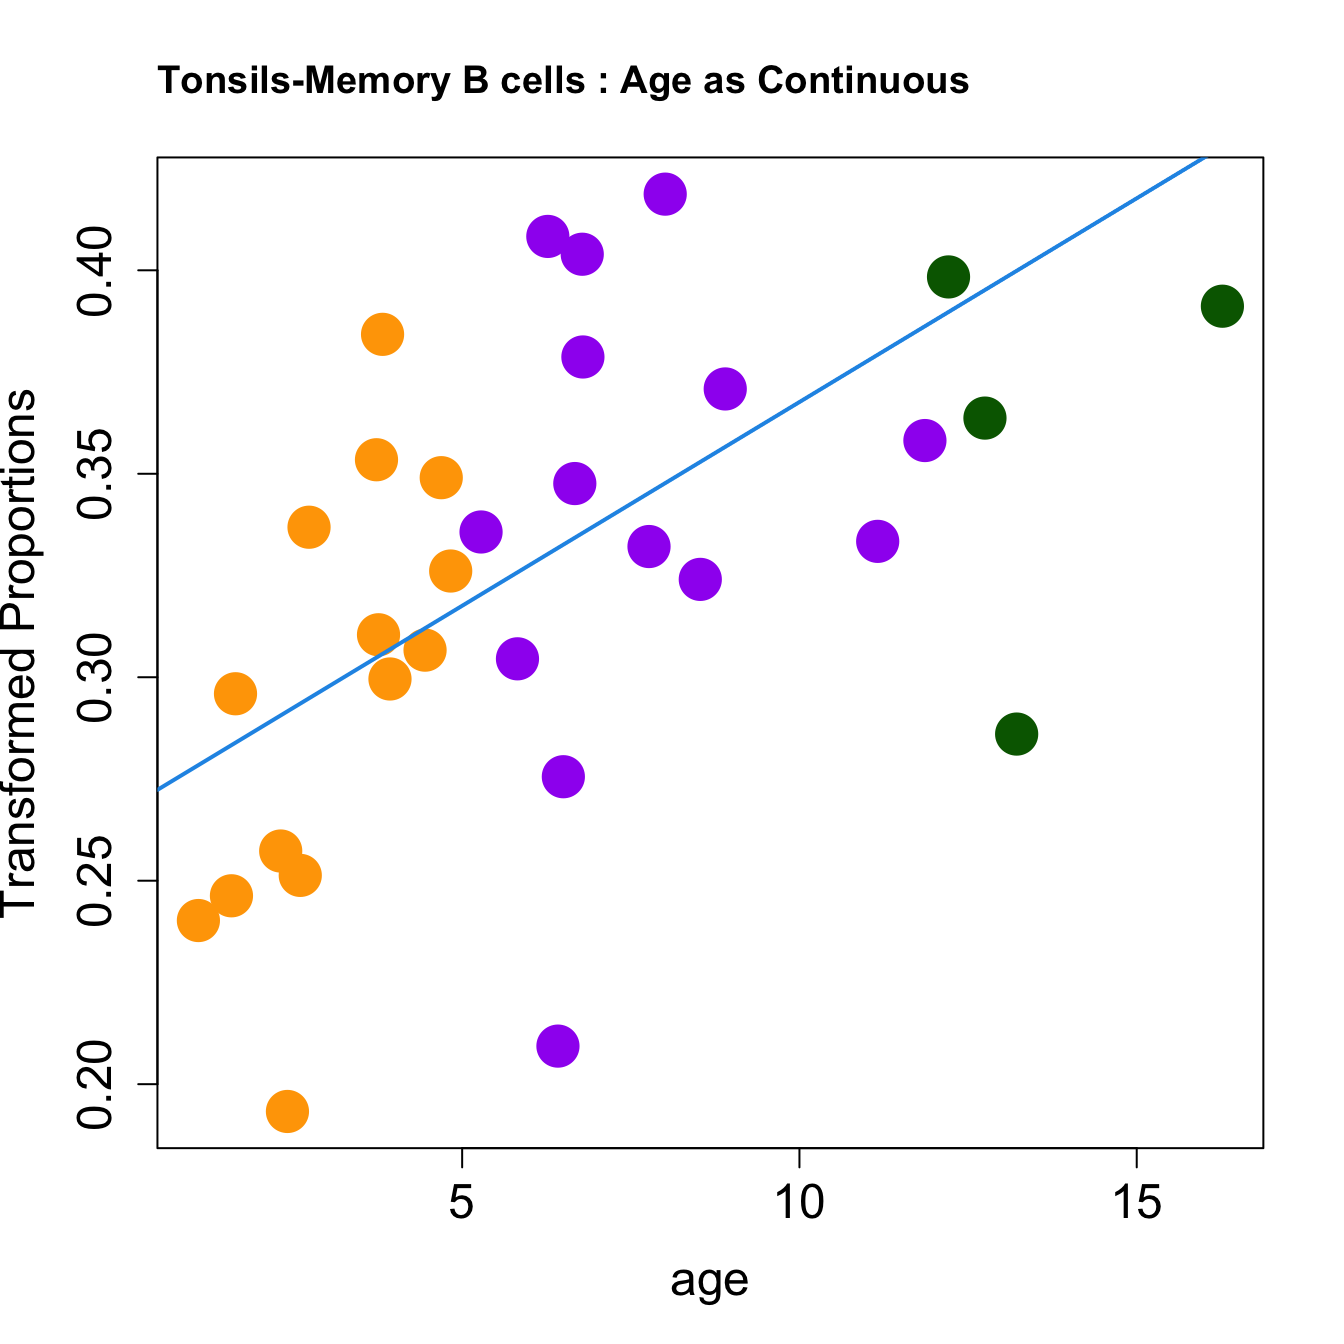
|Memory B cells | 0.0100154| 0.3247181| 3.4752039| 0.0015101| 0.0068979| -3.546666|
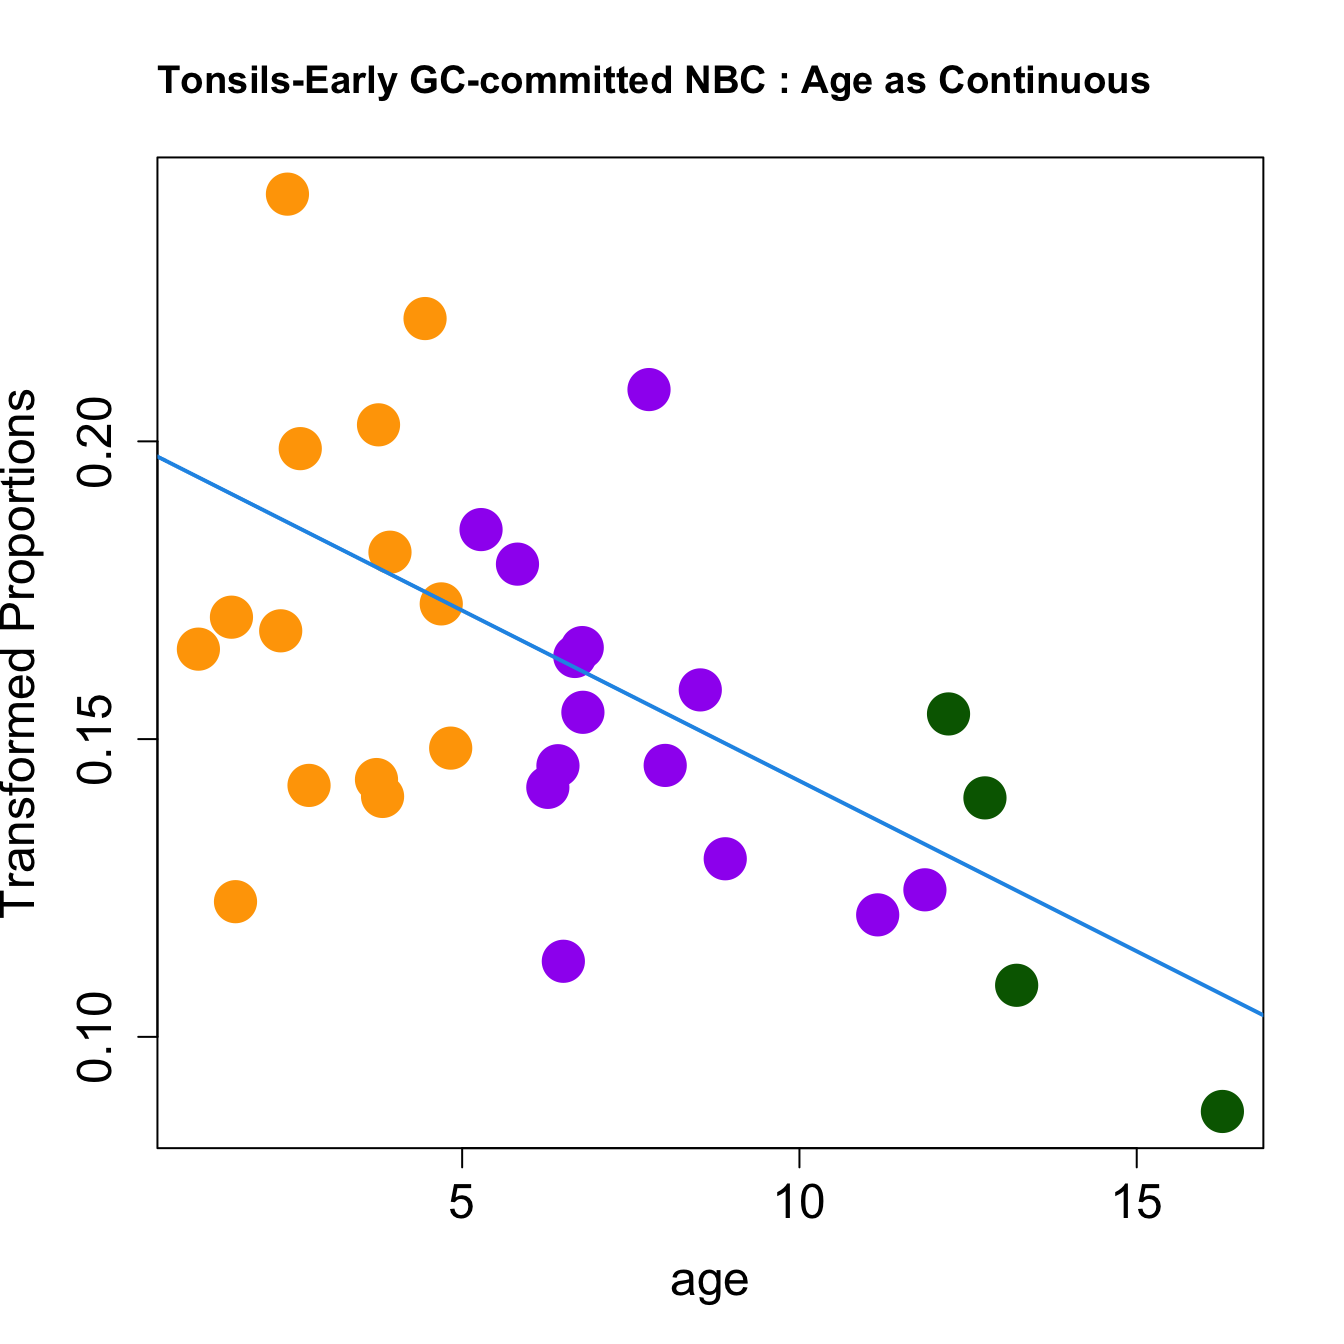
|Early GC-committed NBC | -0.0057234| 0.1576590| -3.4555649| 0.0015918| 0.0068979| -3.597485|
|DZ early Sphase | -0.0059026| 0.1639000| -3.3968967| 0.0018621| 0.0072623| -3.748520|
|CD4 Treg | 0.0034475| 0.0955855| 3.1616516| 0.0034590| 0.0122638| -4.341559|
|Neutrophils | 0.0040962| 0.0435832| 3.0043175| 0.0051841| 0.0168483| -4.725852|
|Pre-T cells | -0.0026976| 0.0137338| -2.8337354| 0.0079611| 0.0238832| -5.130040|
|Cycling GCB | -0.0039900| 0.1417592| -2.6980635| 0.0111103| 0.0308847| -5.441434|
|TFH-LZ-GC | 0.0055243| 0.1866960| 2.6704736| 0.0118787| 0.0308847| -5.503602|
|MAIT cells | 0.0021362| 0.0470655| 2.5024231| 0.0177273| 0.0432103| -5.873341|
|Naïve B cell-IFN | -0.0088163| 0.1681446| -1.8971504| 0.0671931| 0.1497048| -7.062114|
|Naïve B cells | 0.0102301| 0.4390636| 1.8833901| 0.0690945| 0.1497048| -7.086176|
|Early MBC | -0.0038929| 0.1611794| -1.7756866| 0.0854488| 0.1753949| -7.269182|
|Pre-BCRi II | -0.0019335| 0.1102476| -1.6887202| 0.1011518| 0.1972460| -7.411049|
|Early PC precursor | -0.0021121| 0.0787276| -1.5647673| 0.1276311| 0.2270313| -7.602902|
|Mast cells | -0.0011950| 0.0149422| -1.5629030| 0.1280689| 0.2270313| -7.605692|
|CD4 effector | 0.0021801| 0.1149409| 1.5104365| 0.1409009| 0.2389190| -7.683055|
|CD4 TFH | -0.0023000| 0.2557934| -1.3700468| 0.1803605| 0.2930859| -7.878708|
|GC-commited metabolic activation | -0.0016397| 0.0856524| -1.2750290| 0.2116249| 0.3301349| -8.001506|
|Epithelial cells | 0.0018176| 0.0332756| 1.1757657| 0.2485001| 0.3727502| -8.121258|
|Cycling T | -0.0010478| 0.0488681| -1.0992811| 0.2799777| 0.4044123| -8.207459|
|Gamma delta T | -0.0015607| 0.0833453| -0.9359301| 0.3564307| 0.4964570| -8.373435|
|T-IFN | -0.0025723| 0.0717145| -0.7642408| 0.4504119| 0.5885878| -8.520577|
|Follicular dendritic cells | -0.0014541| 0.0842402| -0.7420019| 0.4635841| 0.5885878| -8.537548|
|CD4 Treg-eff | -0.0008690| 0.1231964| -0.7348762| 0.4678518| 0.5885878| -8.542883|
|Monocytes/macrophages | -0.0012461| 0.1173527| -0.6887567| 0.4960192| 0.6045234| -8.576210|
|GCB-IFN | -0.0012052| 0.0130231| -0.6340624| 0.5306187| 0.6270949| -8.613014|
|CD8 TN | -0.0013989| 0.1367512| -0.6002867| 0.5526105| 0.6338767| -8.634259|
|NK cells | 0.0005537| 0.0621524| 0.4798955| 0.6346178| 0.7071456| -8.700708|
|Plasmacytoid DCs | -0.0005567| 0.0401559| -0.4257621| 0.6731767| 0.7292748| -8.725830|
|CD4 TN | 0.0008197| 0.2160560| 0.2436118| 0.8091114| 0.8358856| -8.788476|
|Double negative T | -0.0003020| 0.0757670| -0.2366606| 0.8144526| 0.8358856| -8.790195|
|Plasma B cells | 0.0001799| 0.2098409| 0.1230429| 0.9028550| 0.9028550| -8.811250|print(knitr::kable(toptable.props, caption = paste0("Proportions Toptable results: ", tissue)))
Table: Proportions Toptable results: Tonsils
| | logFC| AveExpr| t| P.Value| adj.P.Val| B|
|:--------------------------------|----------:|---------:|----------:|---------:|---------:|-----------:|
|CD8 TF | 0.0030651| 0.0214238| 5.6478383| 0.0000042| 0.0001644| 0.5306465|
|CD4 TCM | 0.0016242| 0.0145399| 4.0684358| 0.0003326| 0.0052001| -3.8228233|
|DZtoLZ GCB transition | -0.0047174| 0.0400090| -3.9155205| 0.0005036| 0.0052001| -4.2302099|
|Naïve B cells activated | 0.0028203| 0.0321006| 3.8942547| 0.0005333| 0.0052001| -4.2864944|
|DZ late Sphase | -0.0022490| 0.0187255| -3.7658203| 0.0007534| 0.0058767| -4.6243142|
|DZ GCB | -0.0022663| 0.0382800| -3.3378958| 0.0023290| 0.0136106| -5.7190068|
|Memory B cells | 0.0056963| 0.1044420| 3.2678057| 0.0027909| 0.0136106| -5.8929838|
|CD4 Treg | 0.0006880| 0.0095694| 3.2667131| 0.0027919| 0.0136106| -5.8940738|
|DZ early Sphase | -0.0017826| 0.0278829| -3.1651730| 0.0036289| 0.0157252| -6.1446227|
|Early GC-committed NBC | -0.0017401| 0.0256953| -3.1156667| 0.0041145| 0.0160467| -6.2646132|
|DZ G2Mphase | -0.0023475| 0.0486118| -2.8666583| 0.0076515| 0.0271280| -6.8531757|
|TFH-LZ-GC | 0.0021202| 0.0372079| 2.6621254| 0.0125366| 0.0407438| -7.3159238|
|Cycling GCB | -0.0010359| 0.0207148| -2.4540497| 0.0203749| 0.0611246| -7.7650120|
|Neutrophils | 0.0004037| 0.0026519| 2.2791900| 0.0301765| 0.0840632| -8.1232910|
|MAIT cells | 0.0001842| 0.0024466| 2.1084123| 0.0437268| 0.1136897| -8.4557398|
|Pre-BCRi II | -0.0004842| 0.0127858| -2.0075806| 0.0540752| 0.1318083| -8.6431827|
|Pre-T cells | -0.0001261| 0.0004711| -1.8317305| 0.0772524| 0.1772261| -8.9529333|
|Naïve B cells | 0.0076760| 0.1866683| 1.7916025| 0.0836480| 0.1812374| -9.0206071|
|Naïve B cell-IFN | -0.0035492| 0.0350793| -1.6596487| 0.1077722| 0.2212167| -9.2341883|
|CD4 effector | 0.0005504| 0.0138492| 1.5058243| 0.1429377| 0.2787286| -9.4659709|
|Early PC precursor | -0.0003303| 0.0066879| -1.3309782| 0.1935544| 0.3492992| -9.7058263|
|CD4 TFH | -0.0010926| 0.0647529| -1.3203910| 0.1970406| 0.3492992| -9.7195077|
|Cycling T | -0.0001094| 0.0025897| -1.1010116| 0.2799211| 0.4624313| -9.9809782|
|Gamma delta T | -0.0003339| 0.0076931| -1.0902749| 0.2845731| 0.4624313| -9.9926367|
|GC-commited metabolic activation | -0.0002367| 0.0083871| -0.9089520| 0.3708596| 0.5680665| -10.1738588|
|Early MBC | -0.0010256| 0.0410117| -0.8939569| 0.3787110| 0.5680665| -10.1874445|
|CD4 Treg-eff | -0.0002383| 0.0154495| -0.8592976| 0.3972187| 0.5737603| -10.2180769|
|Monocytes/macrophages | -0.0003997| 0.0145770| -0.8081509| 0.4255896| 0.5927856| -10.2611430|
|Epithelial cells | 0.0001440| 0.0019615| 0.6715890| 0.5071485| 0.6820273| -10.3637325|
|Follicular dendritic cells | -0.0002400| 0.0082263| -0.6100168| 0.5466058| 0.7105875| -10.4039592|
|NK cells | 0.0000811| 0.0042230| 0.5367298| 0.5955368| 0.7364920| -10.4469562|
|T-IFN | -0.0005888| 0.0084892| -0.5008073| 0.6202901| 0.7364920| -10.4660412|
|CD8 TN | -0.0003375| 0.0201497| -0.4966468| 0.6231855| 0.7364920| -10.4681695|
|Mast cells | -0.0000196| 0.0003481| -0.3554214| 0.7248389| 0.8108051| -10.5300222|
|GCB-IFN | -0.0001271| 0.0012999| -0.3516497| 0.7276456| 0.8108051| -10.5313881|
|Double negative T | -0.0000576| 0.0061277| -0.2985177| 0.7674317| 0.8313843| -10.5491959|
|Plasmacytoid DCs | -0.0000271| 0.0020777| -0.2347857| 0.8160203| 0.8393466| -10.5667316|
|CD4 TN | 0.0003578| 0.0488695| 0.2324472| 0.8178249| 0.8393466| -10.5672923|
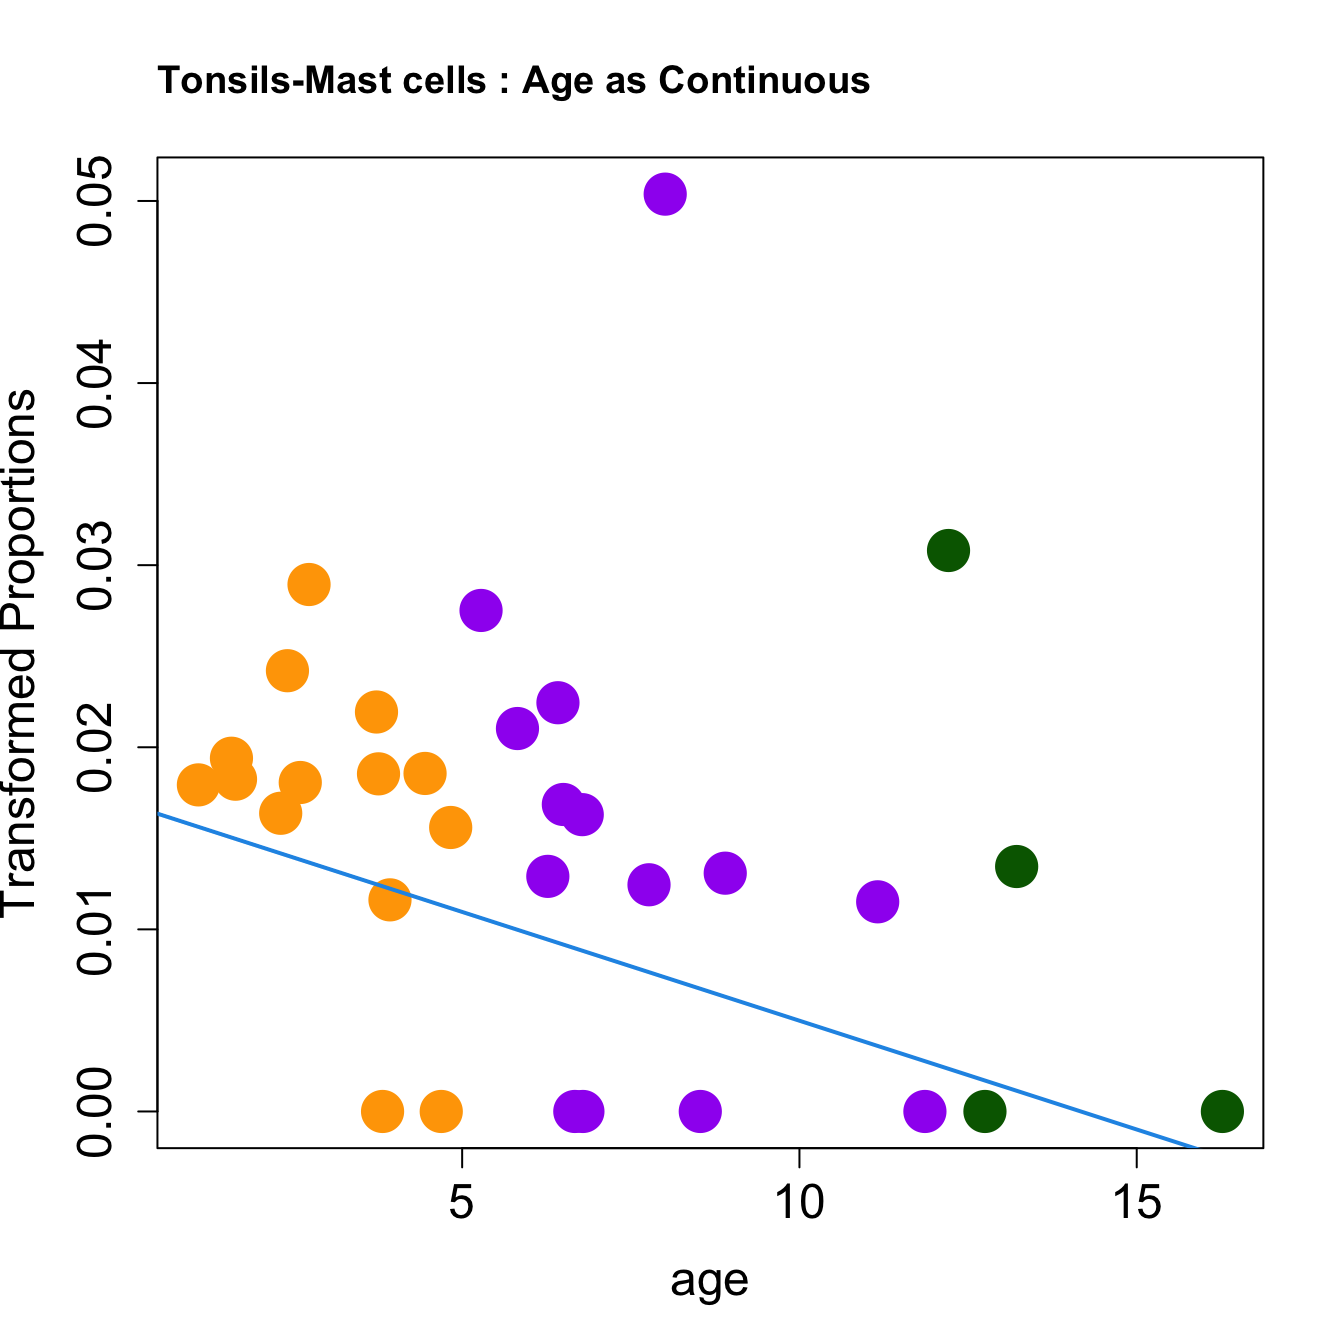
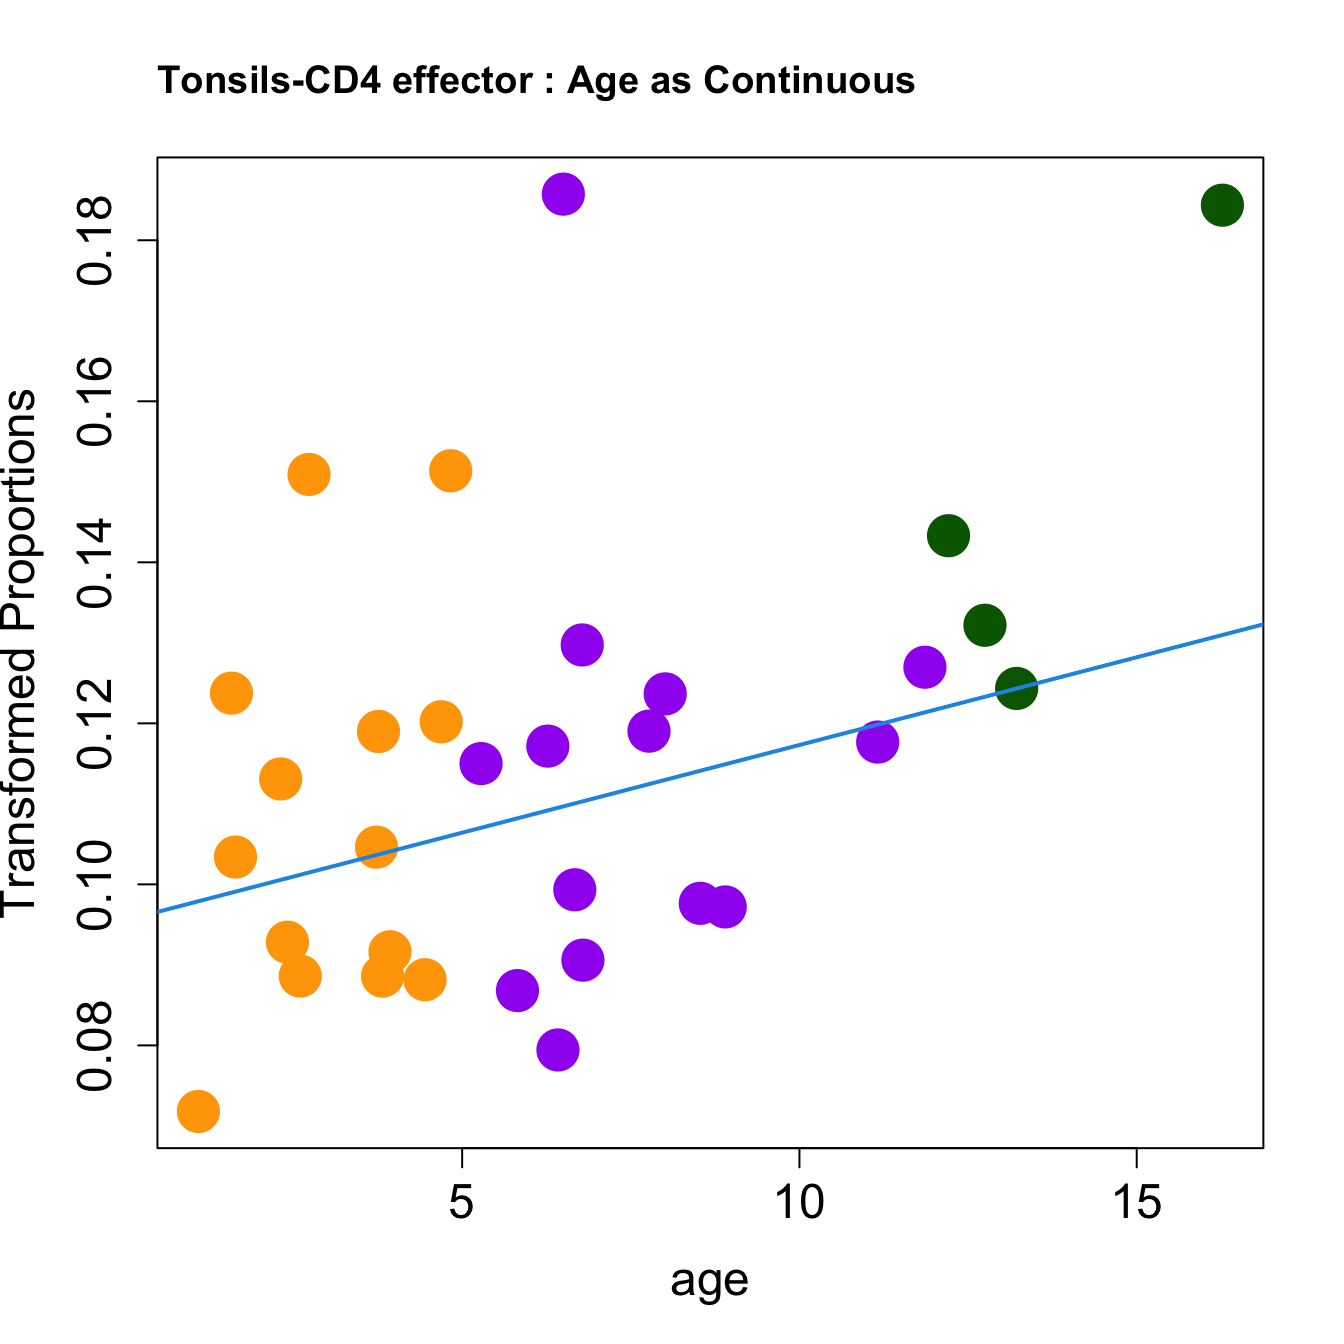
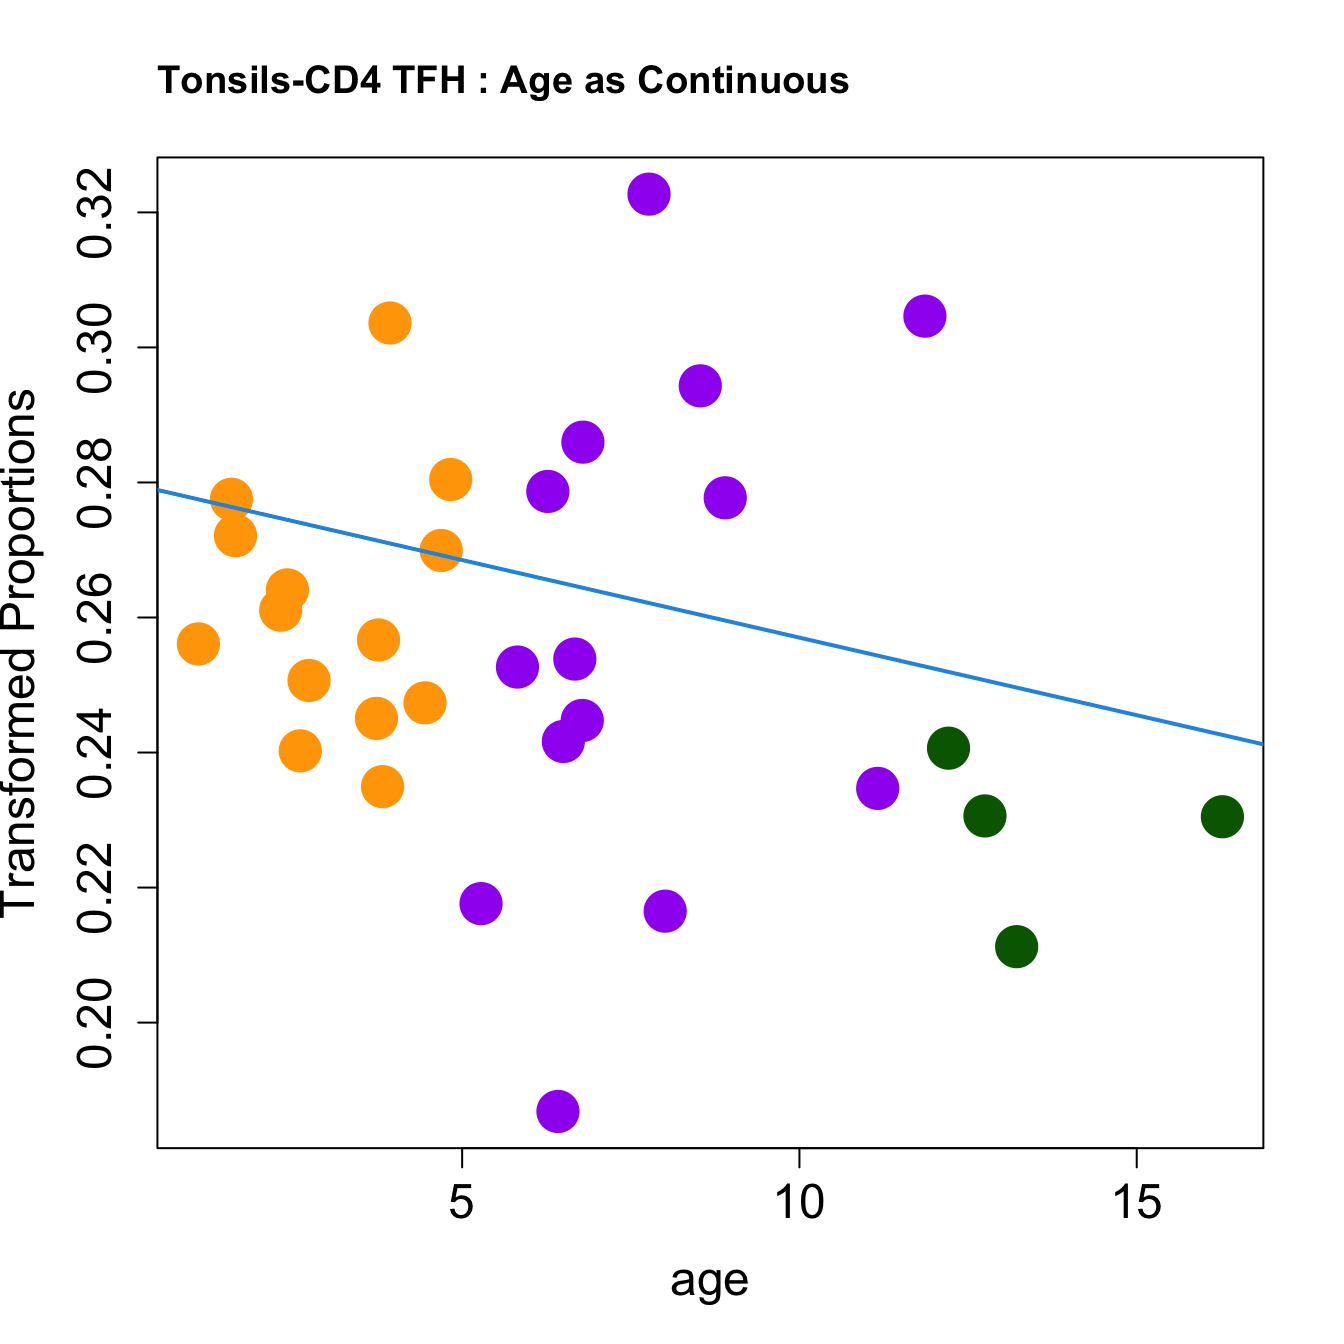
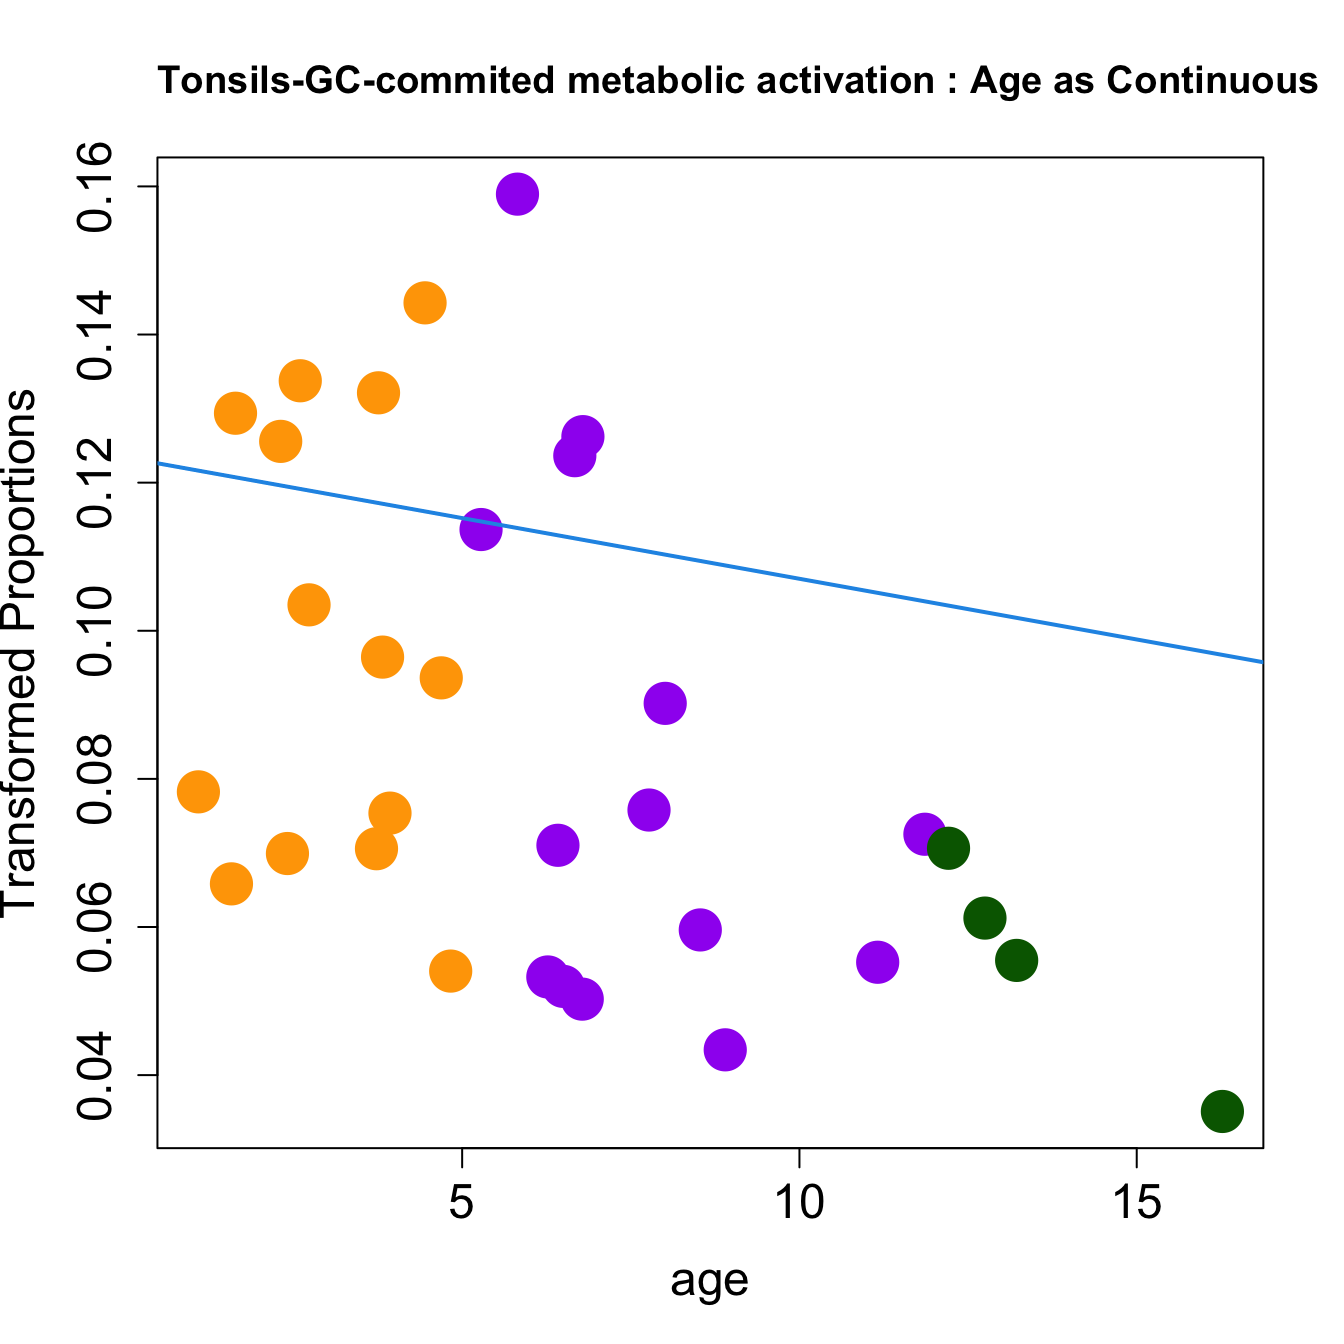
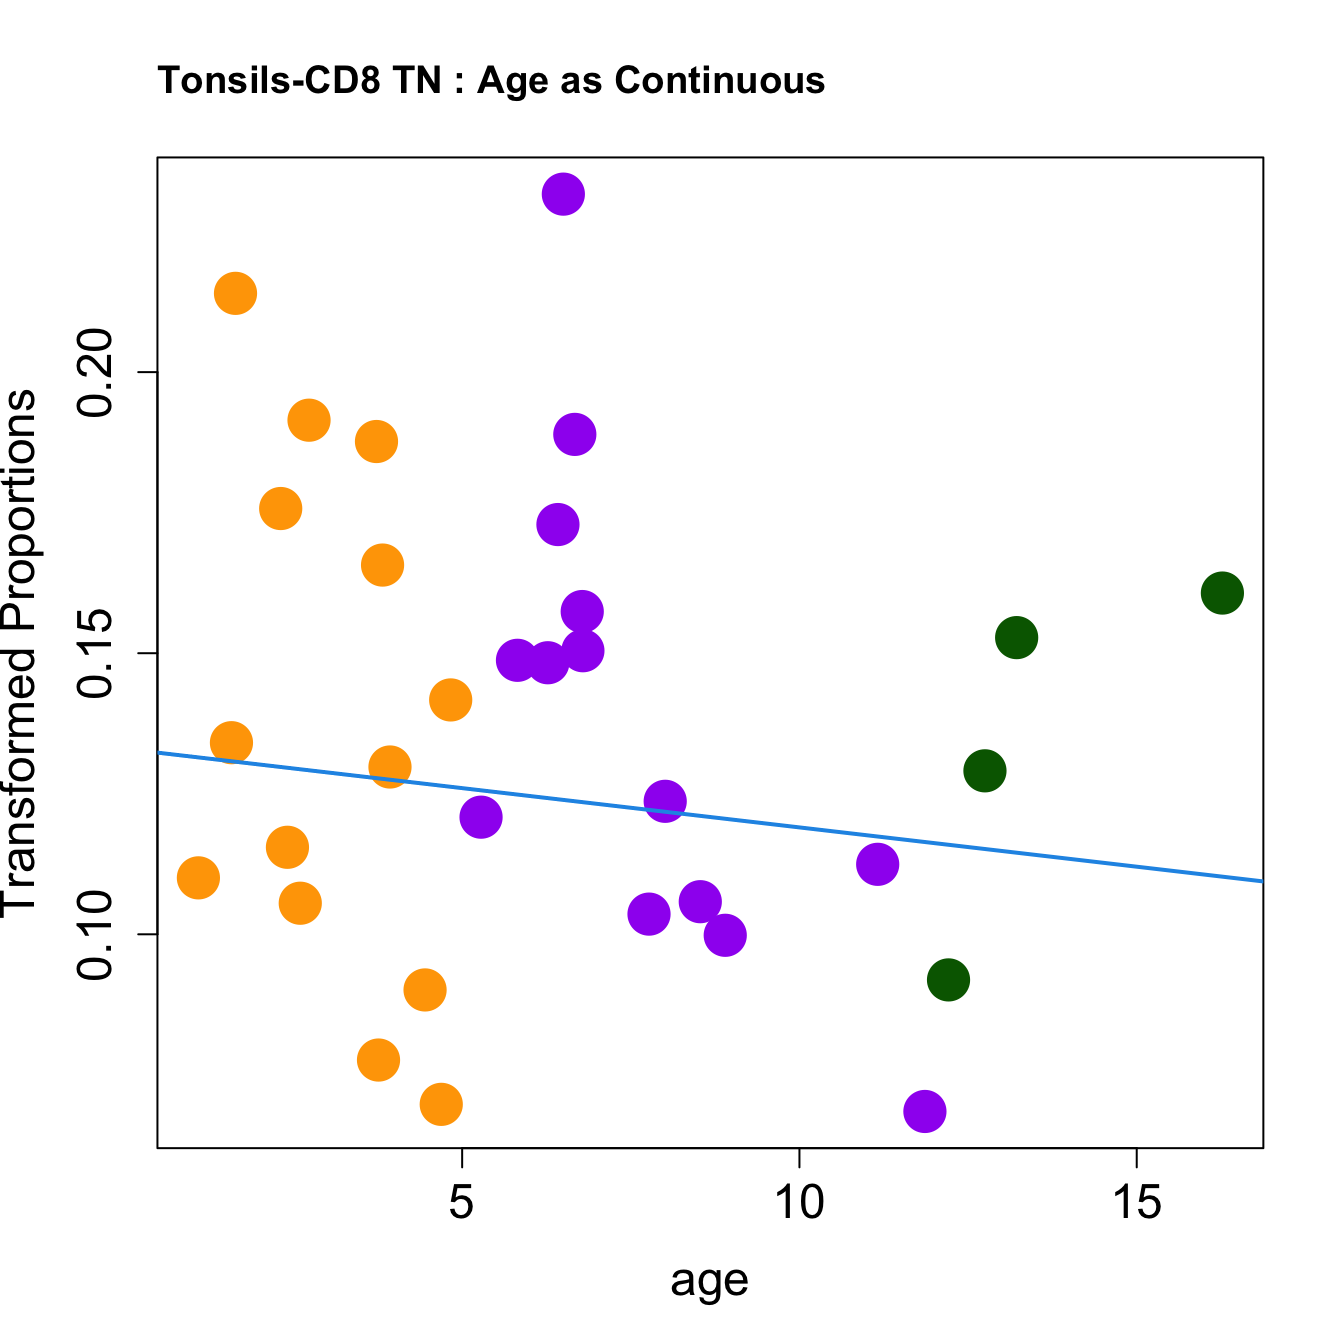
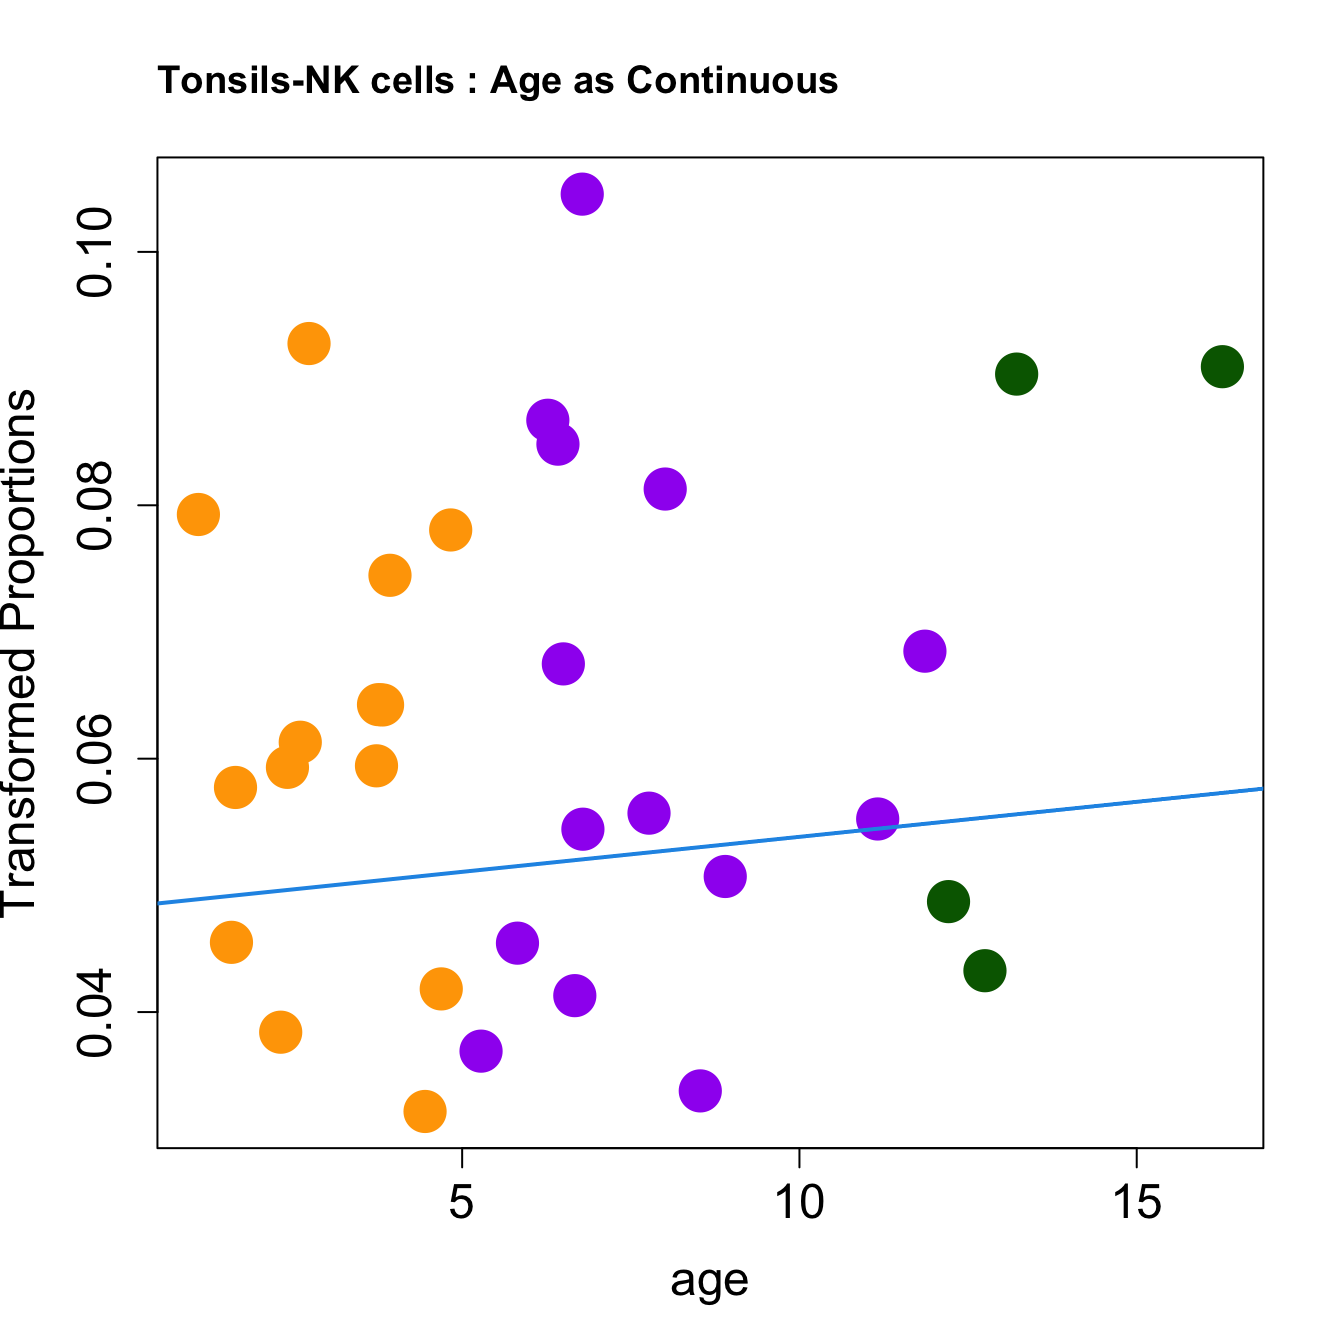
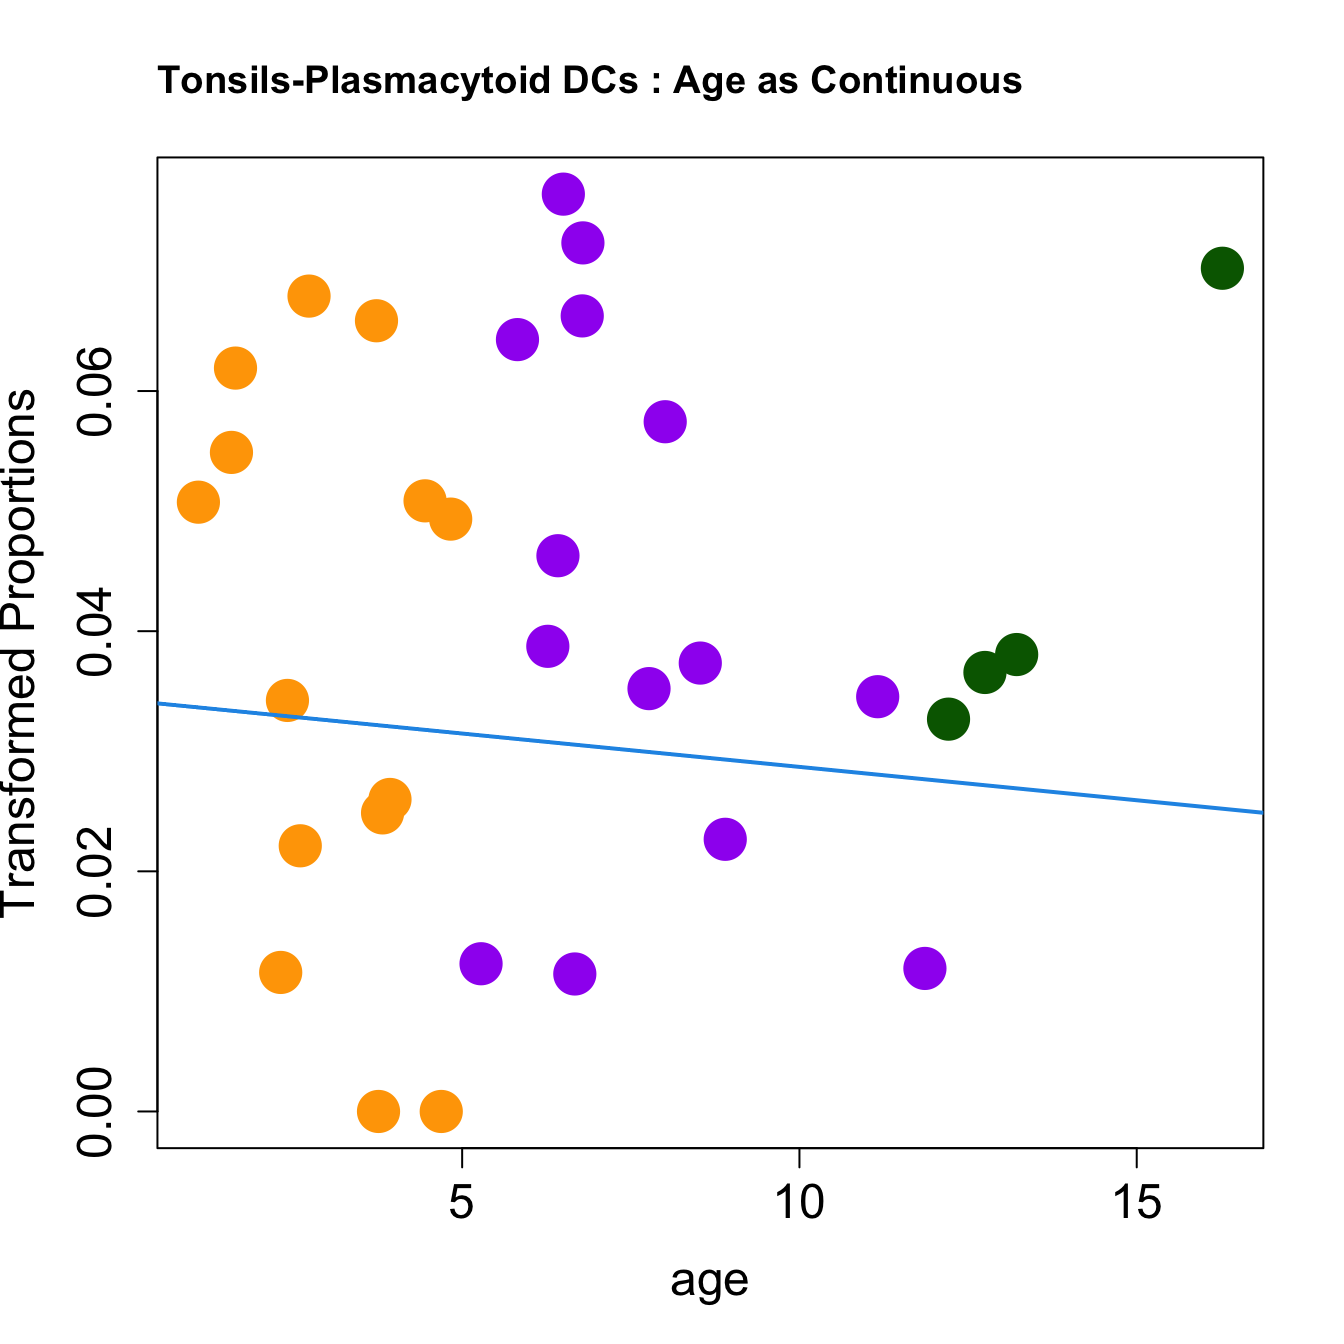
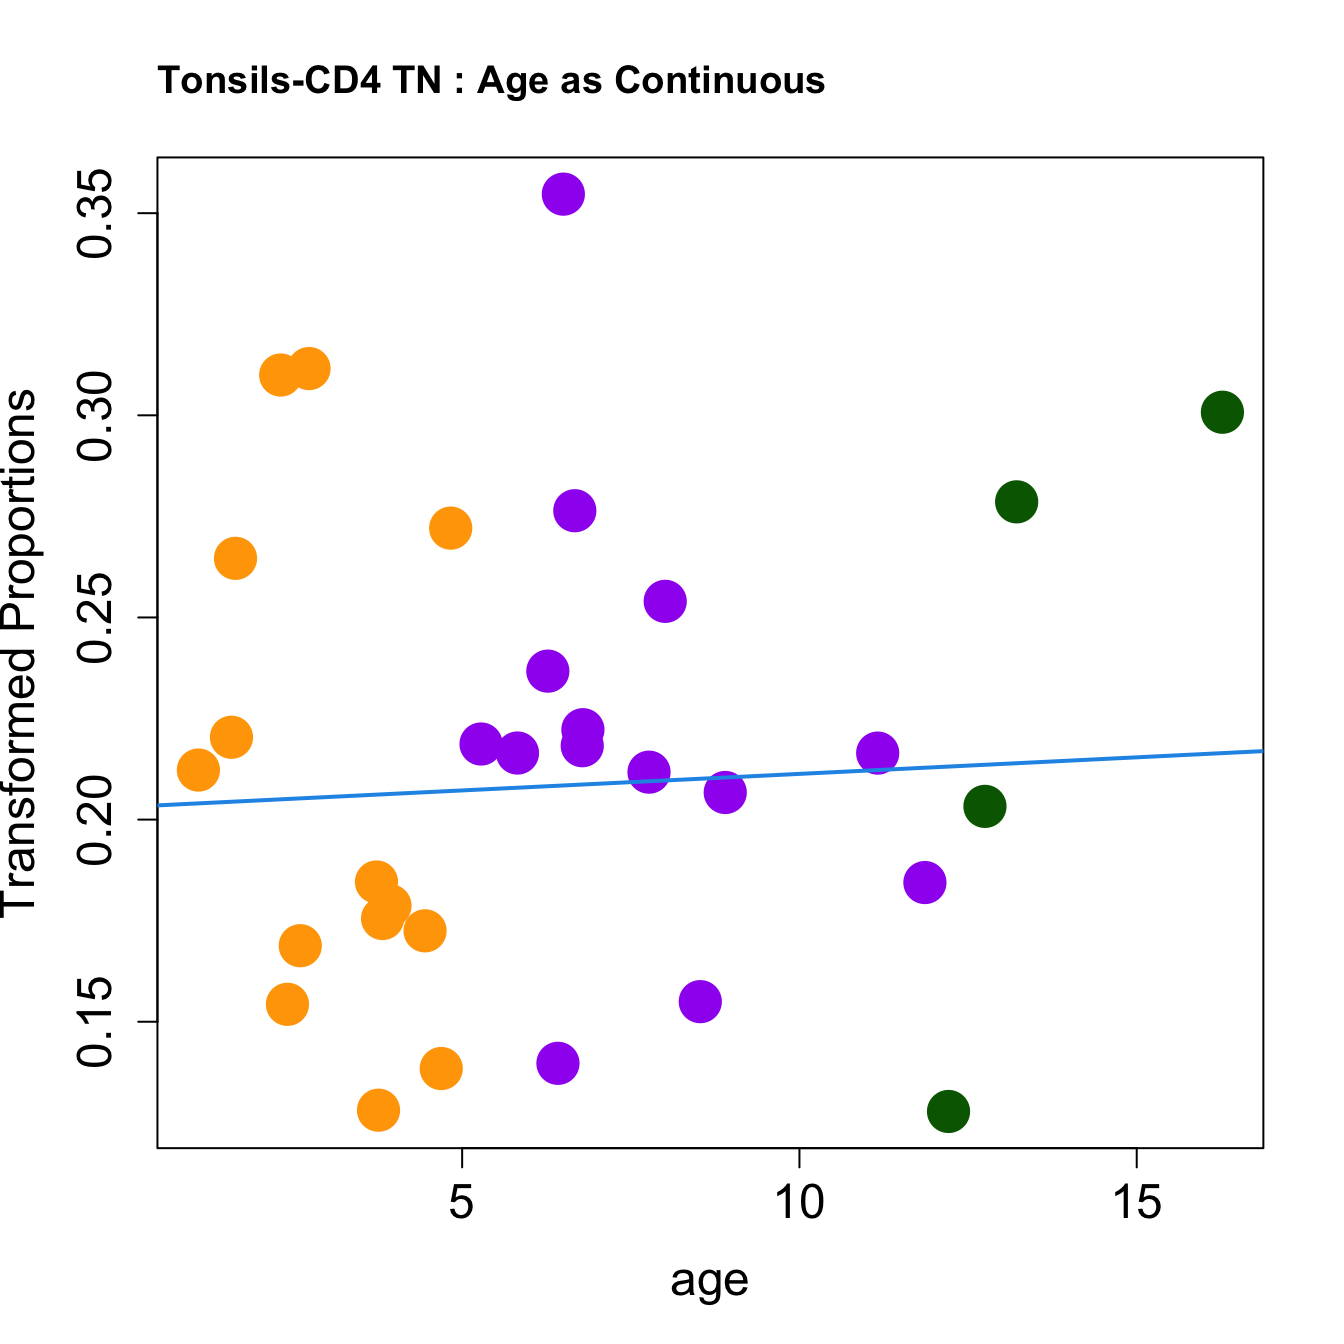
|Plasma B cells | 0.0000511| 0.0439236| 0.0852233| 0.9326700| 0.9326700| -10.5914580|get_age_group_color <- function(age) {
if (age >= 1 && age <= 5) {
return("orange") # Preschool (1-5 years)
} else if (age > 5 && age <= 12) {
return("purple") # Kids (6-11 years)
} else if (age > 12 && age <= 17) {
return("darkgreen") # Adolescent (12-17 years)
} else {
return("black") # Default color for other cases
}
}
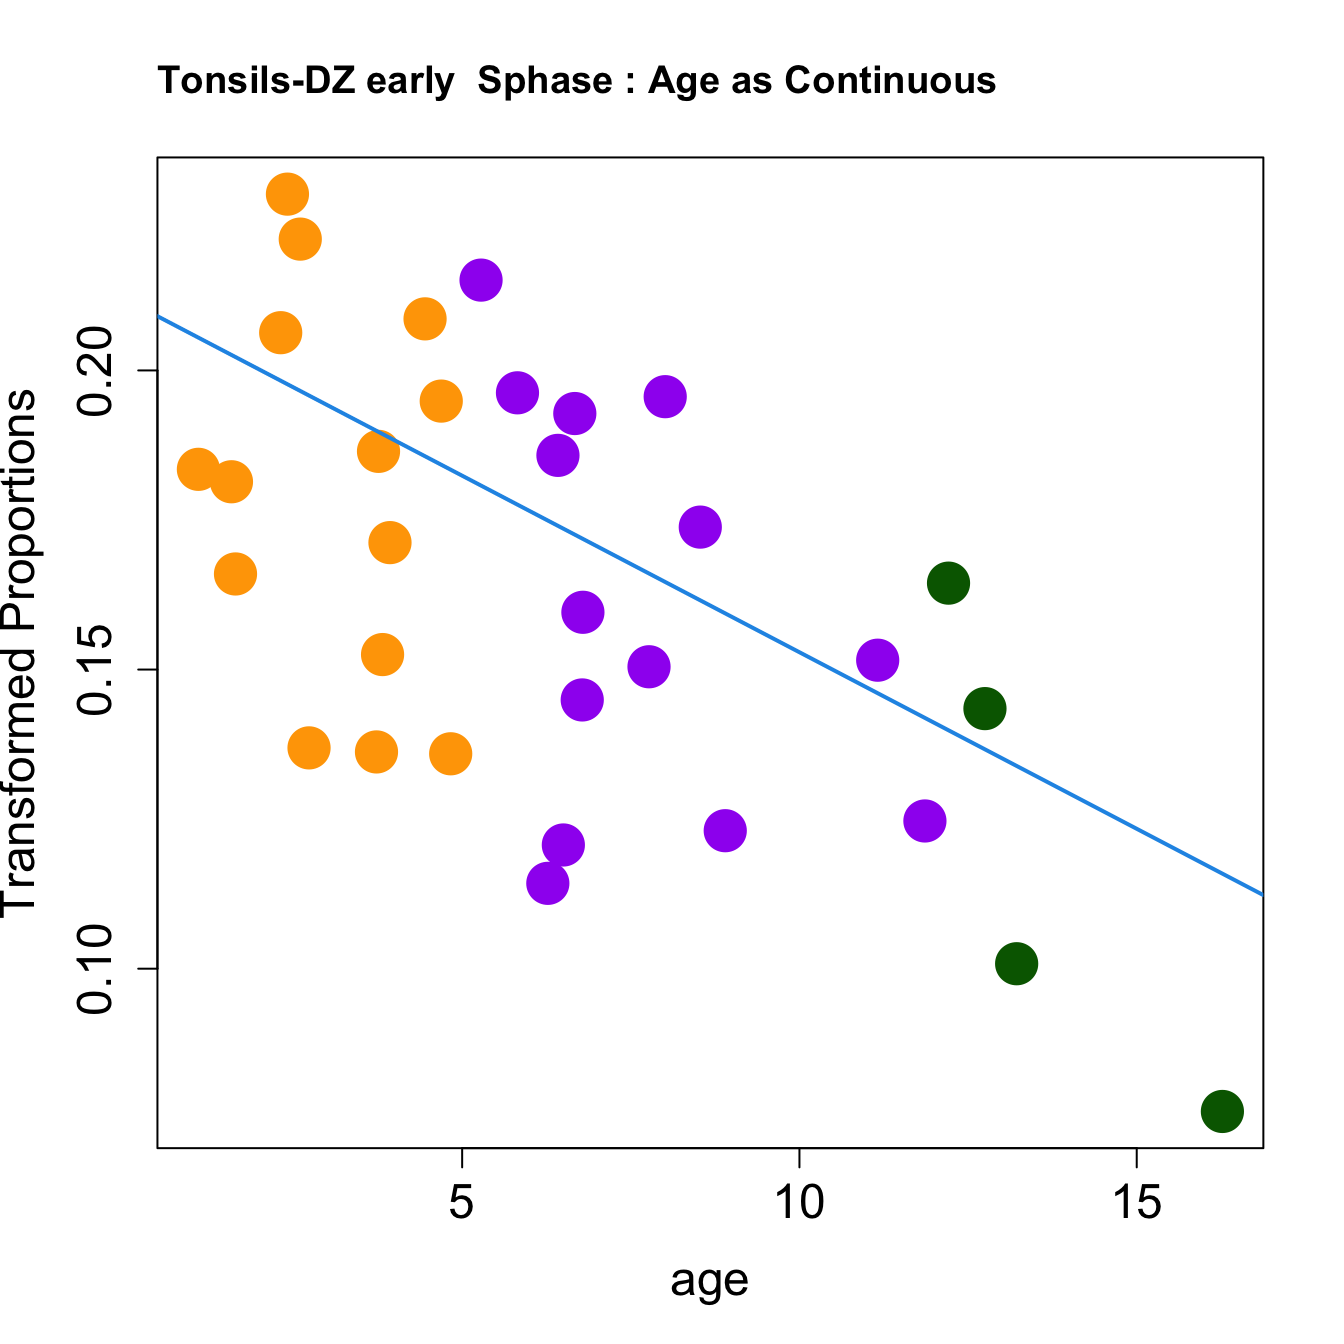
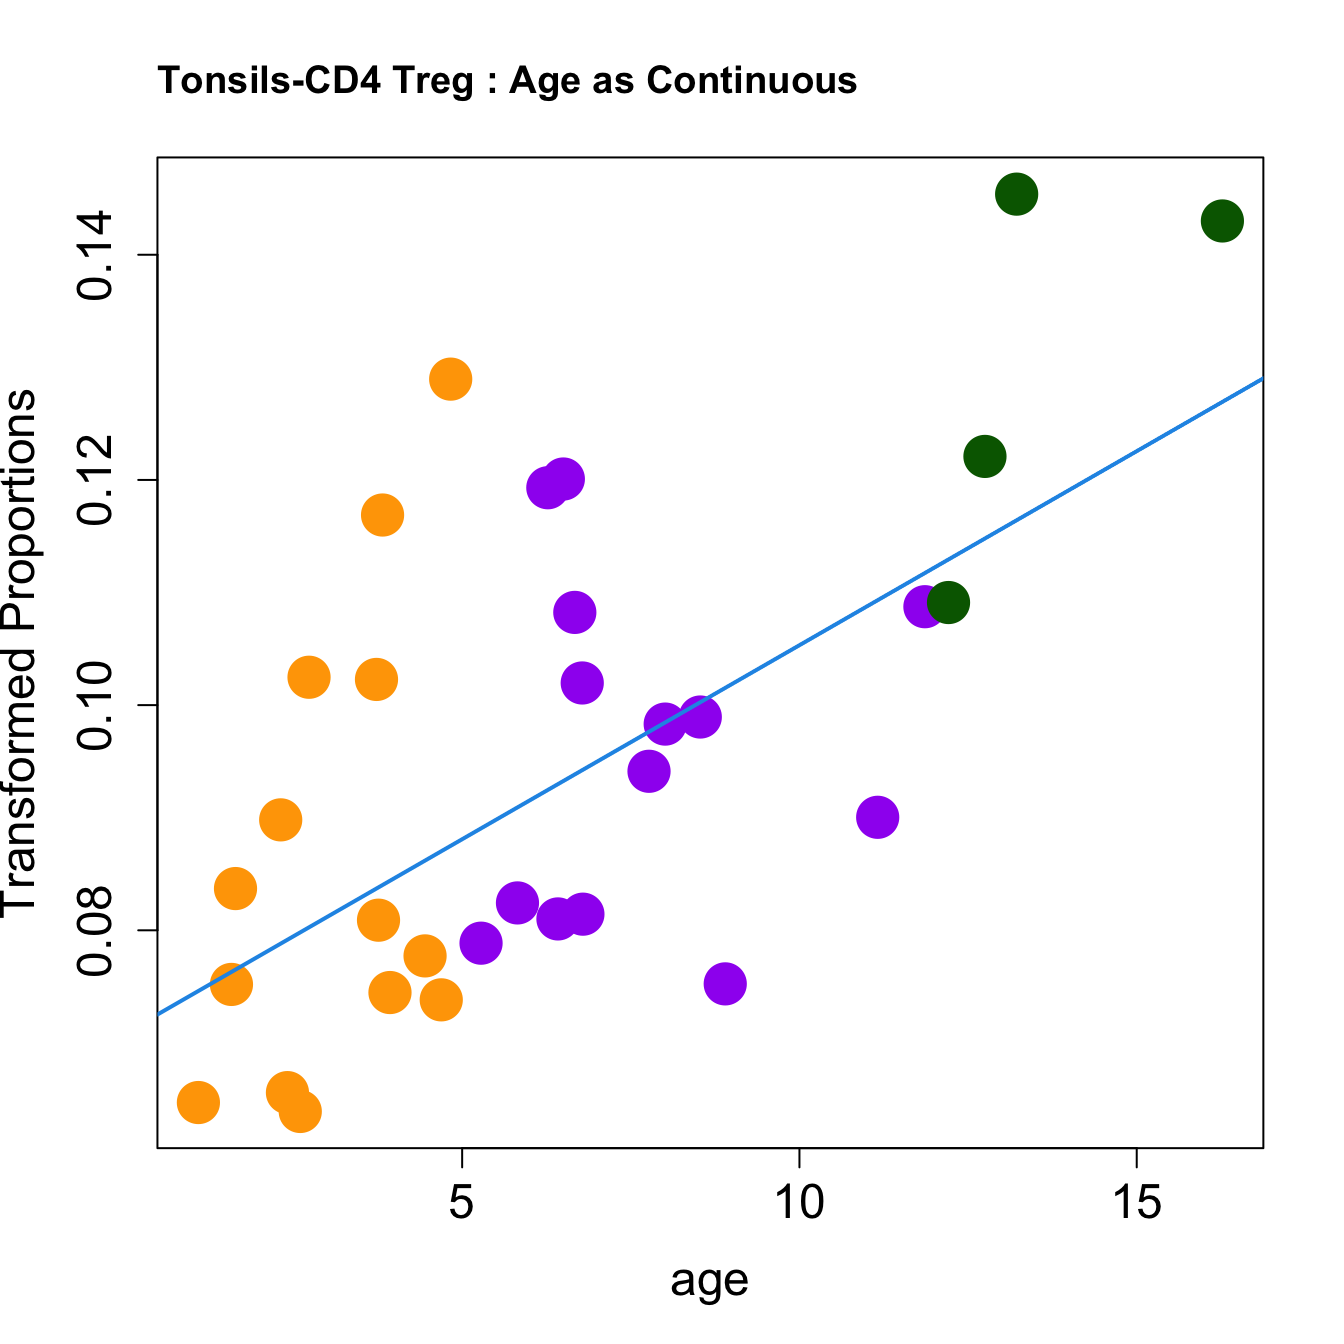
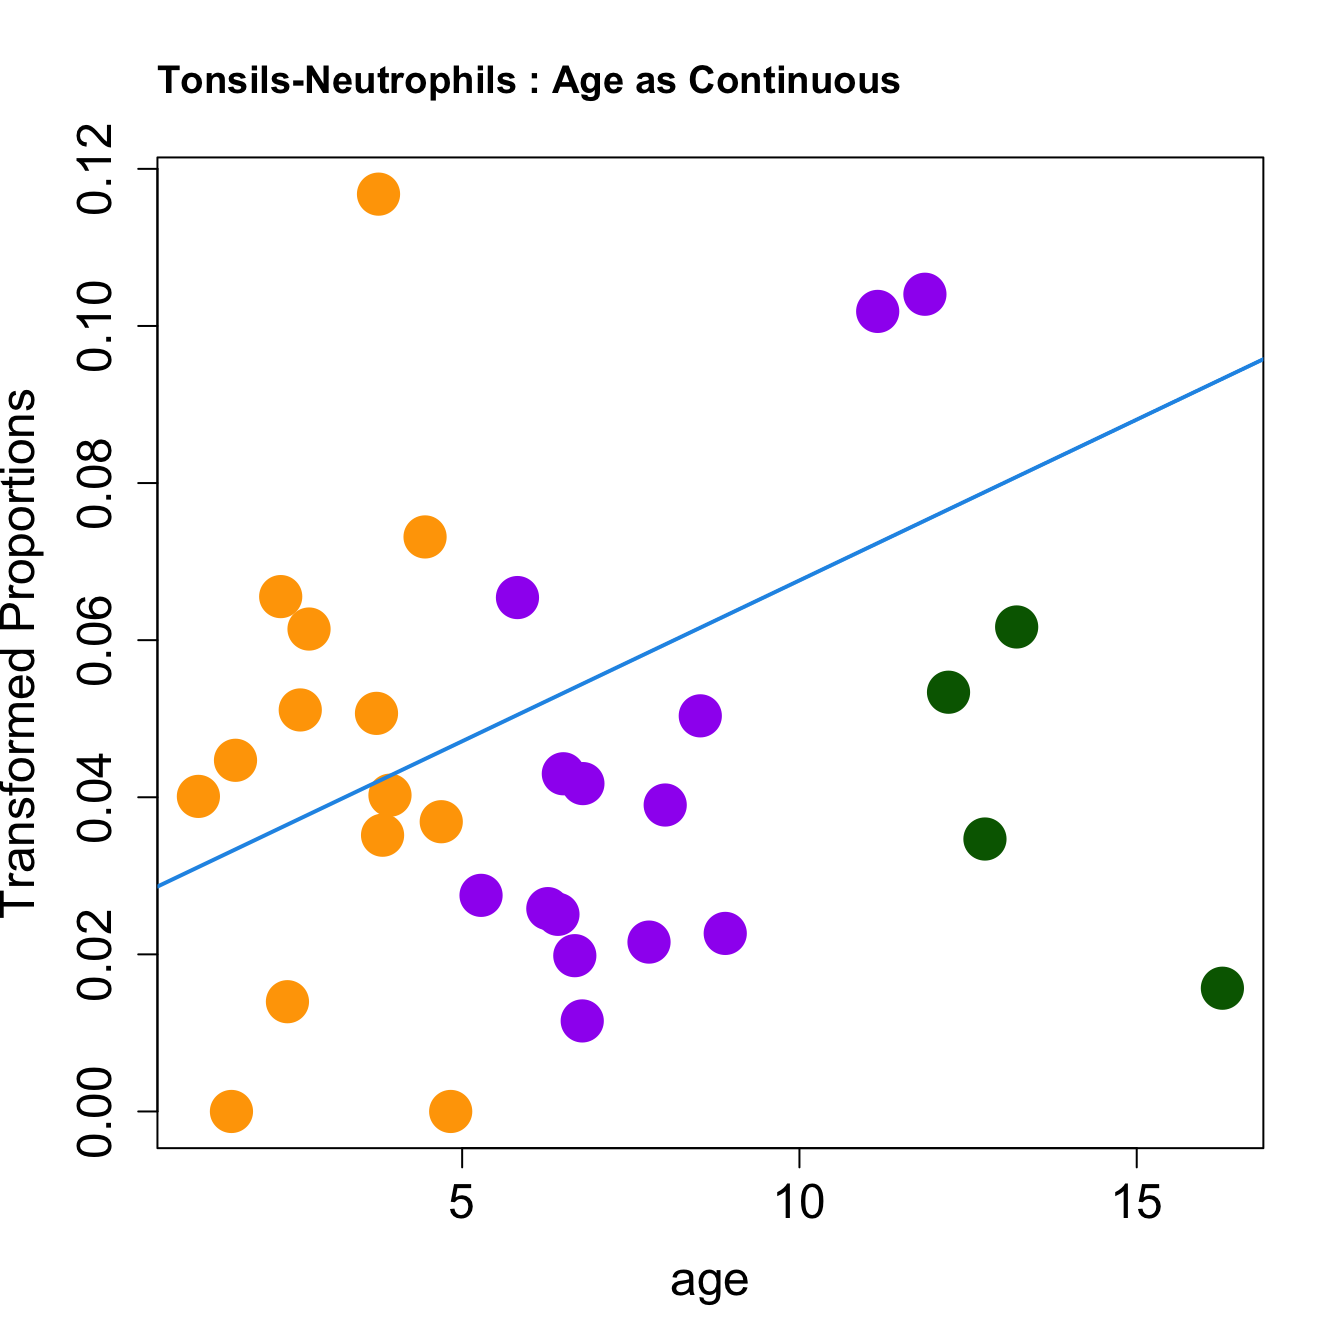
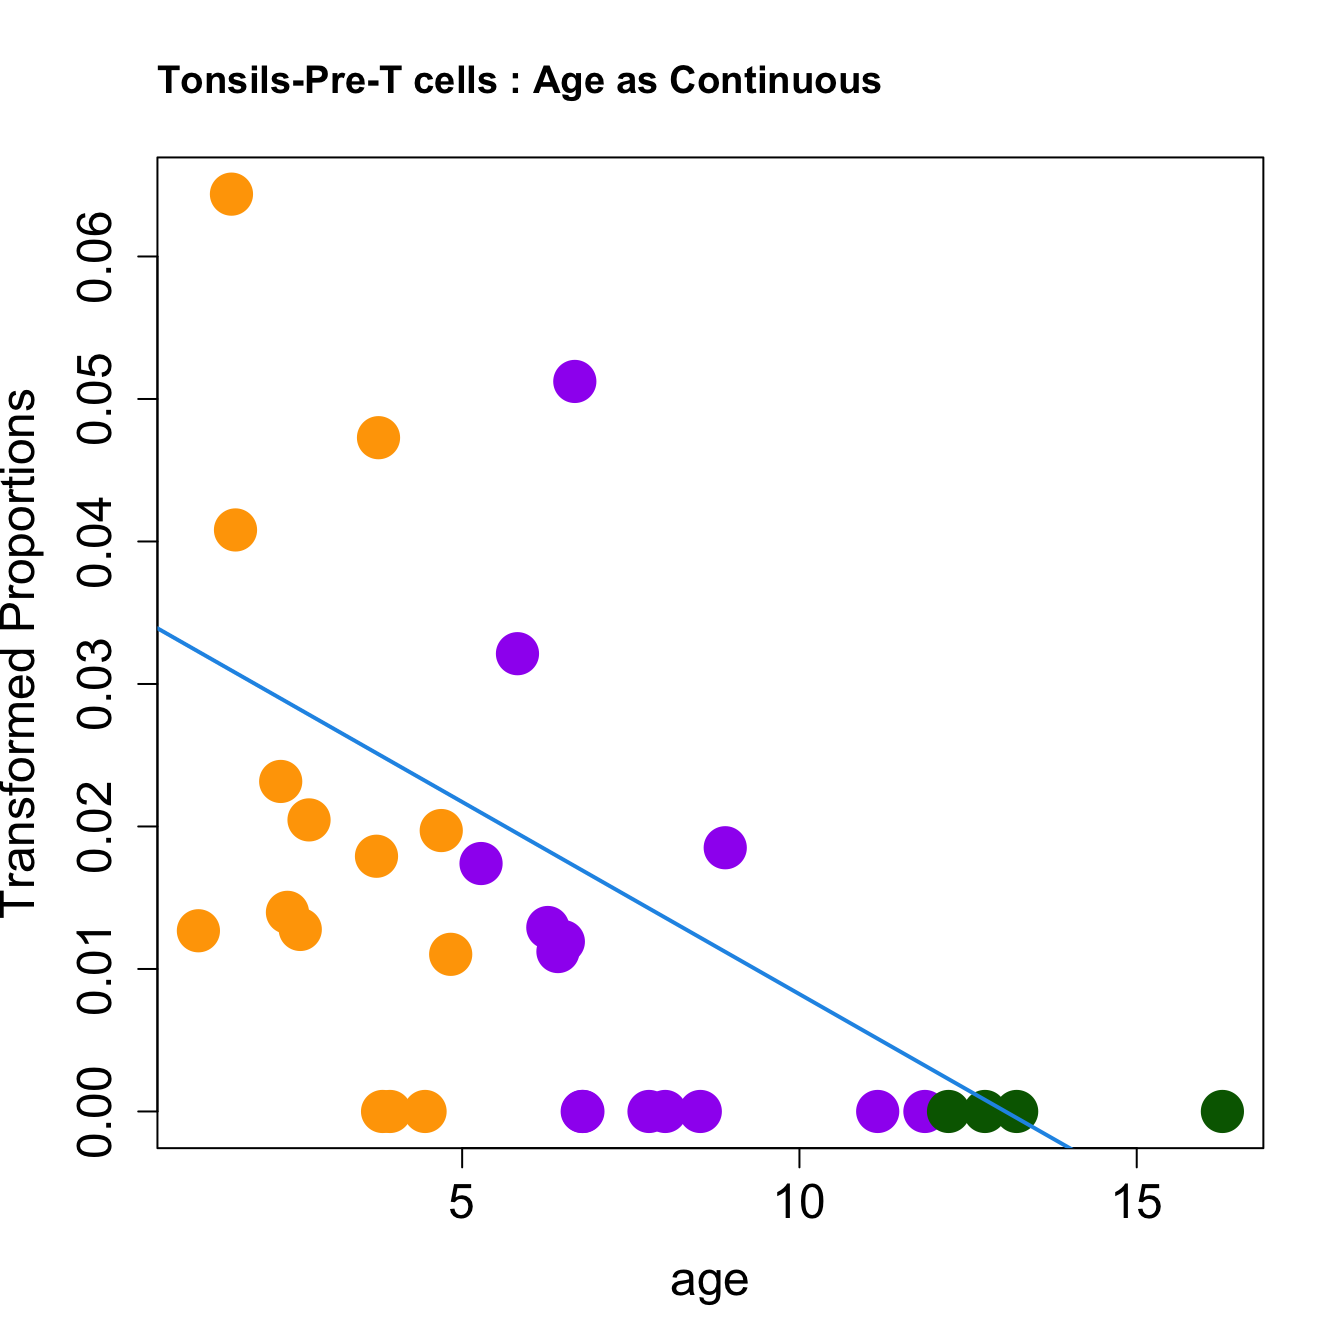
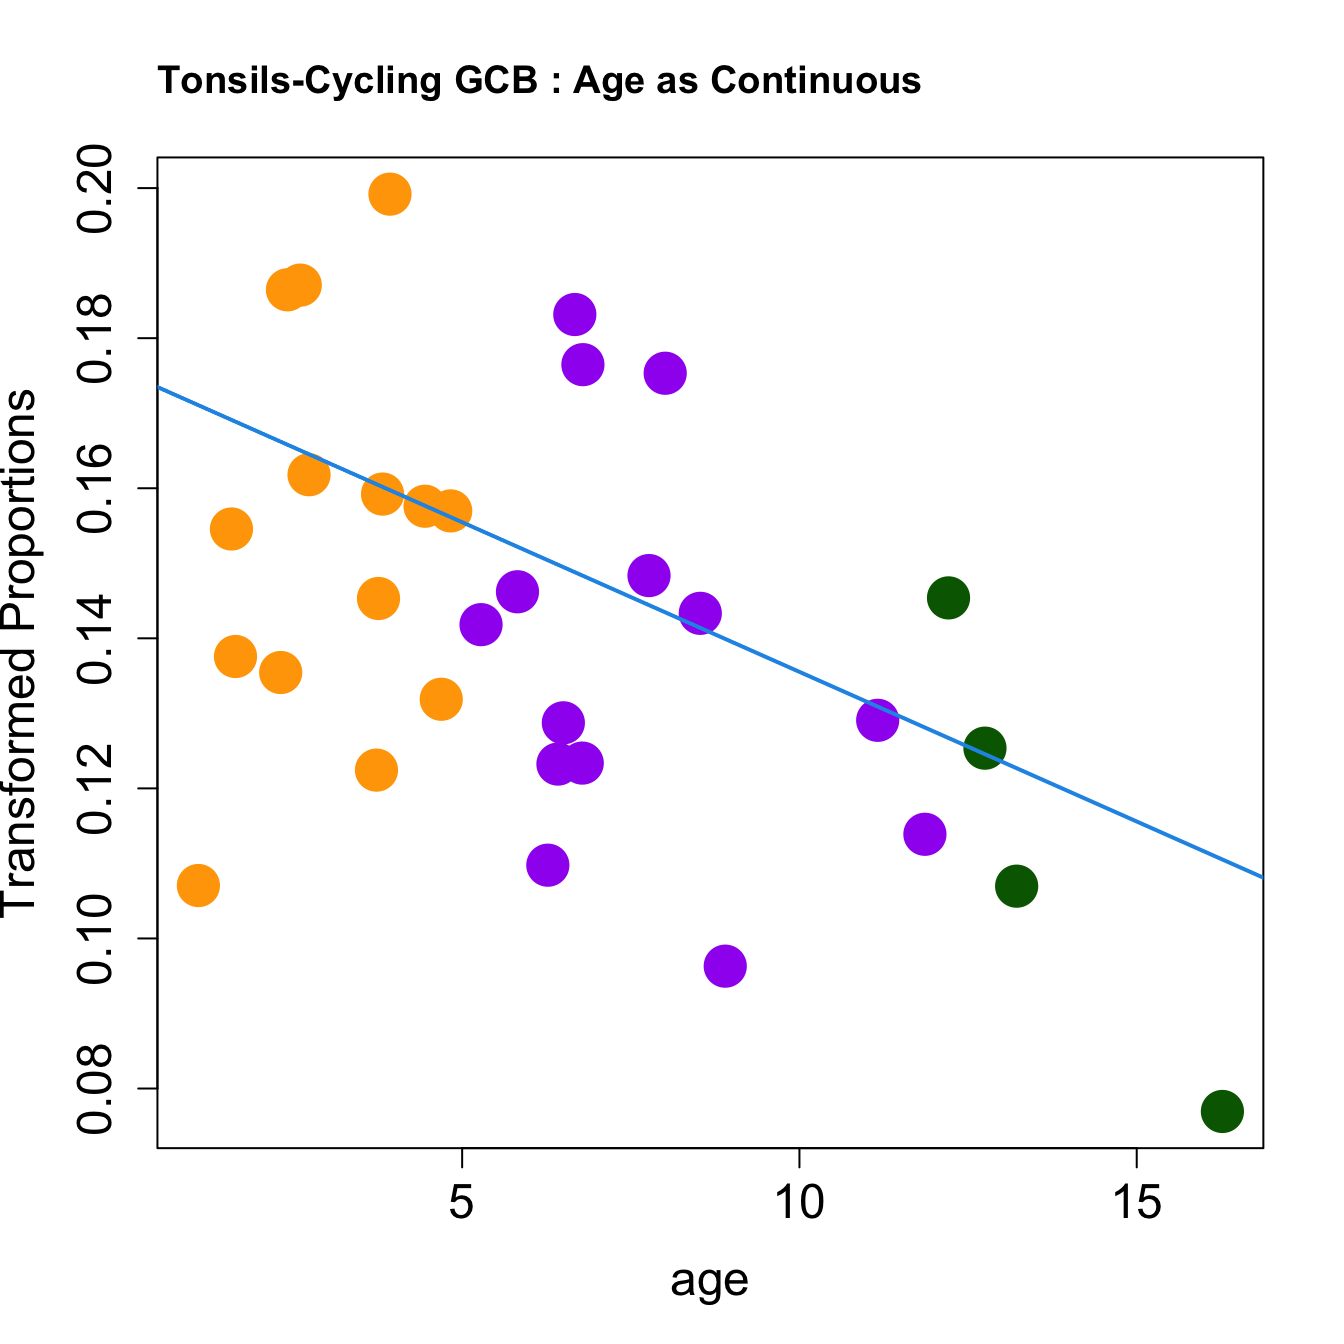
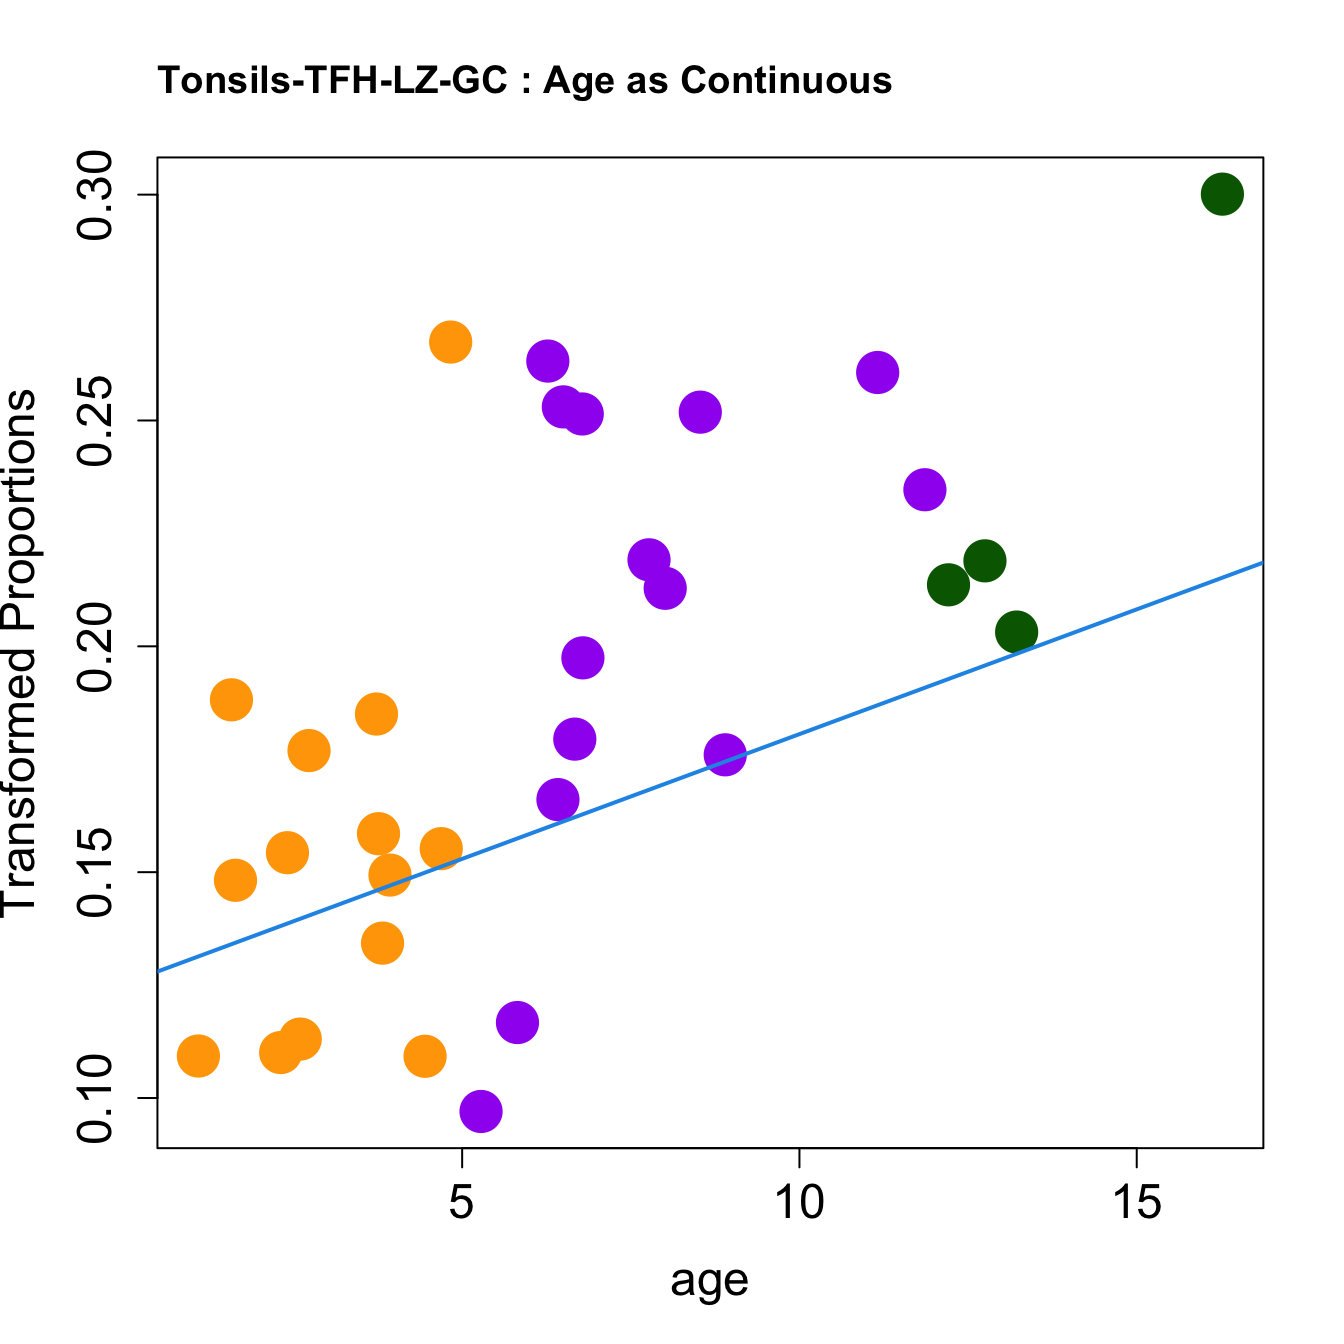
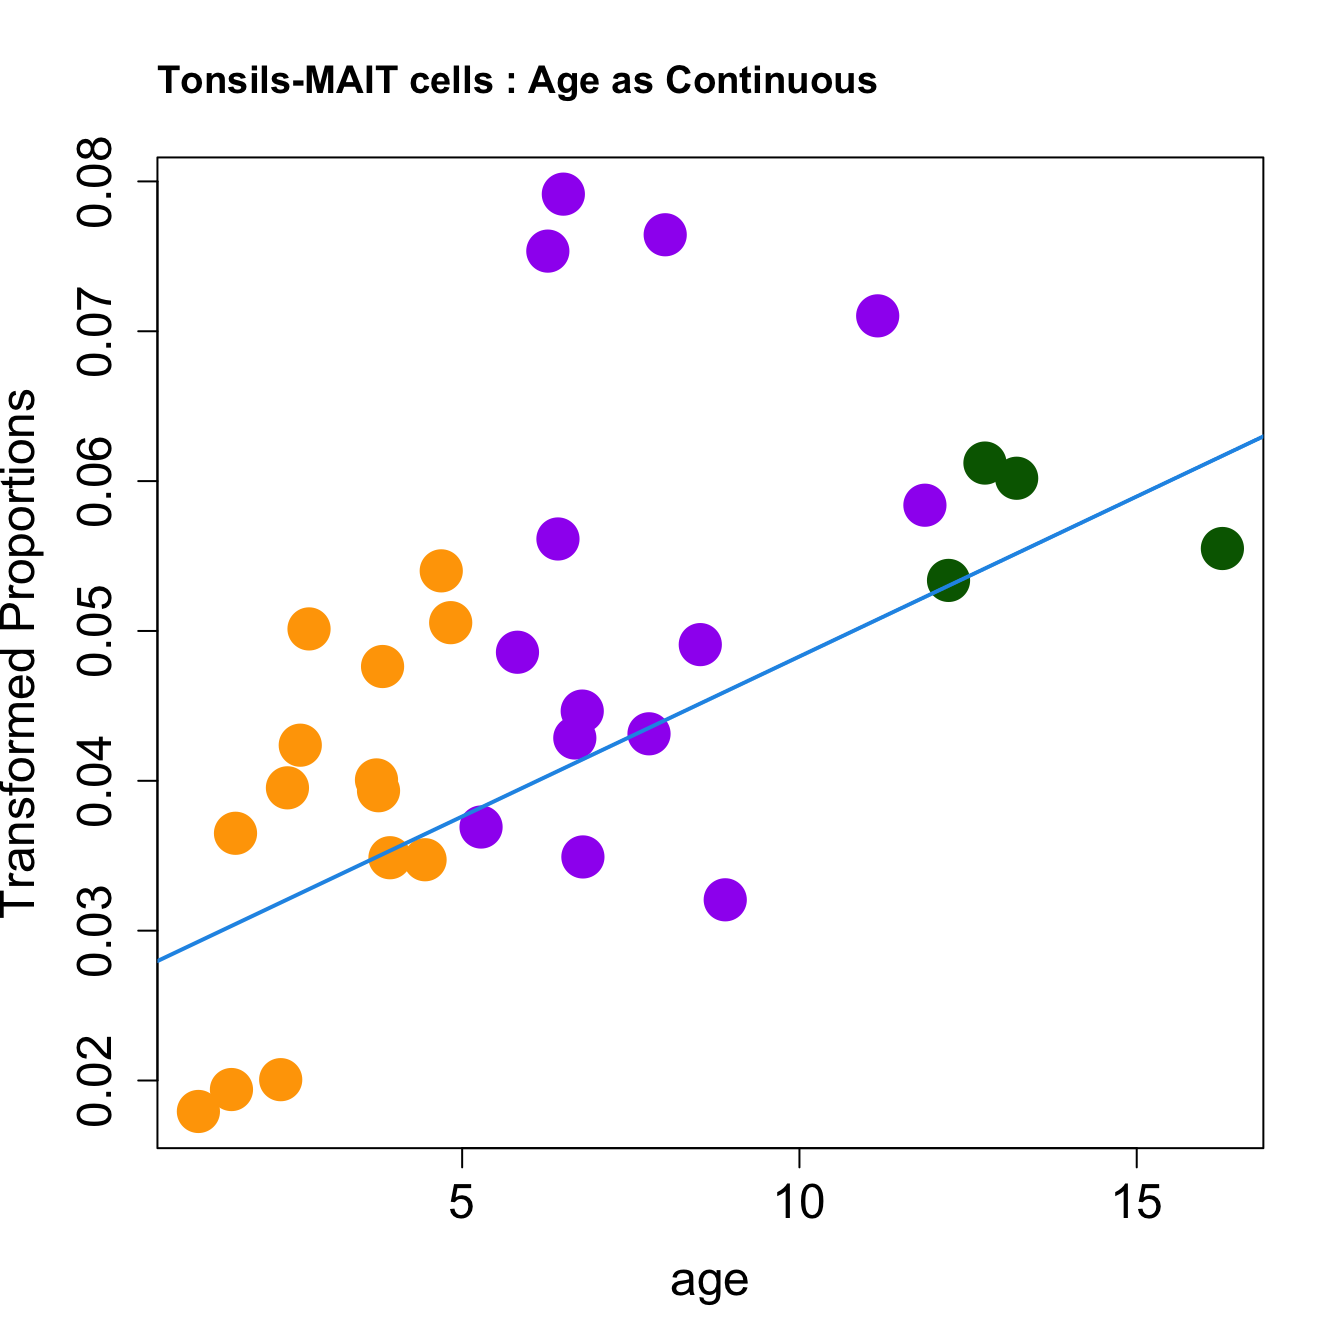
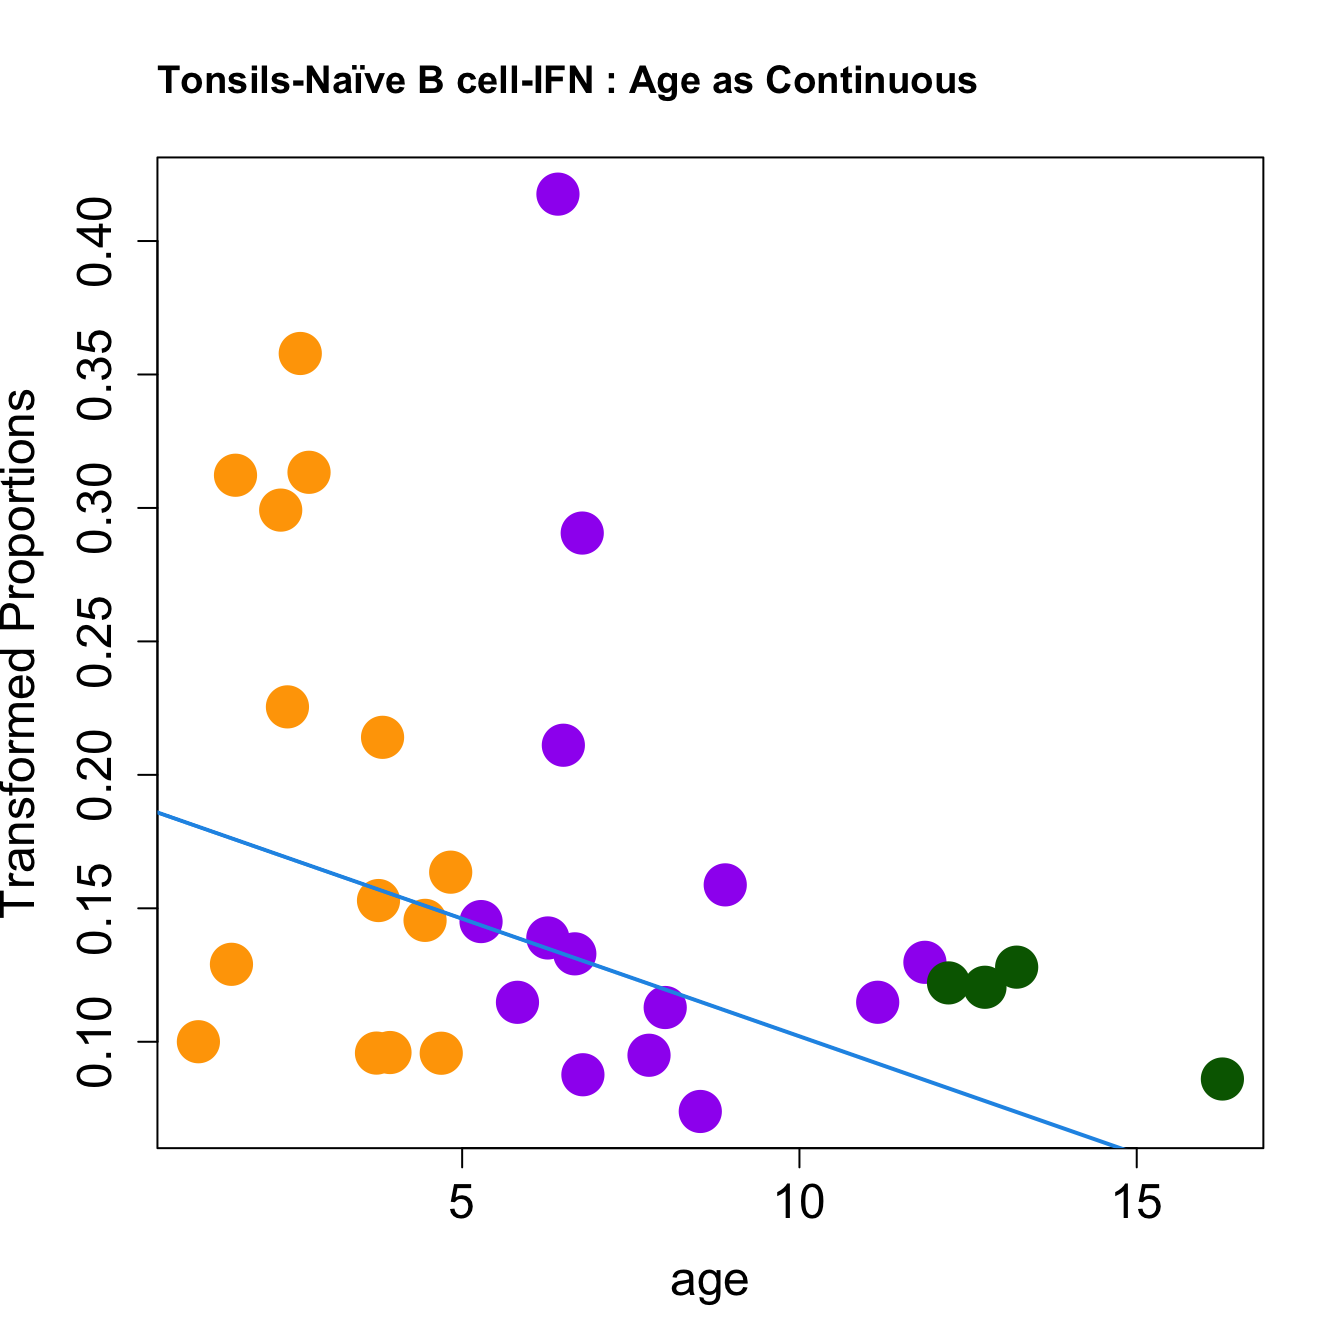
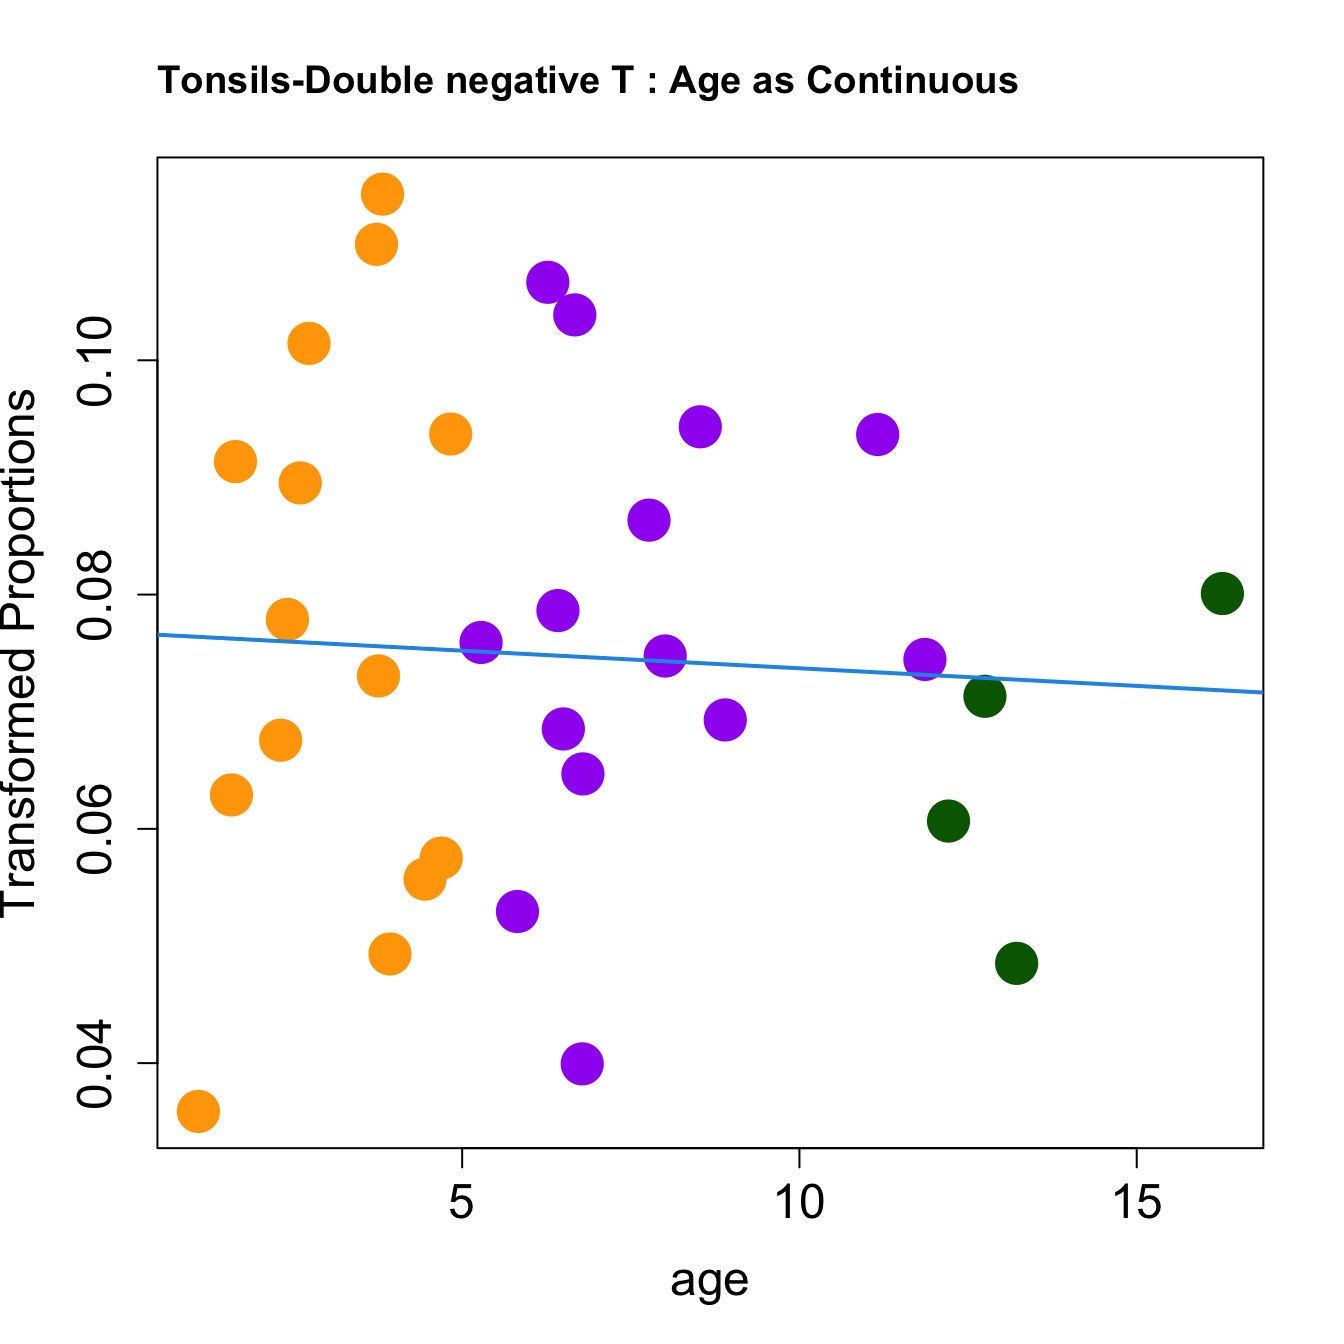
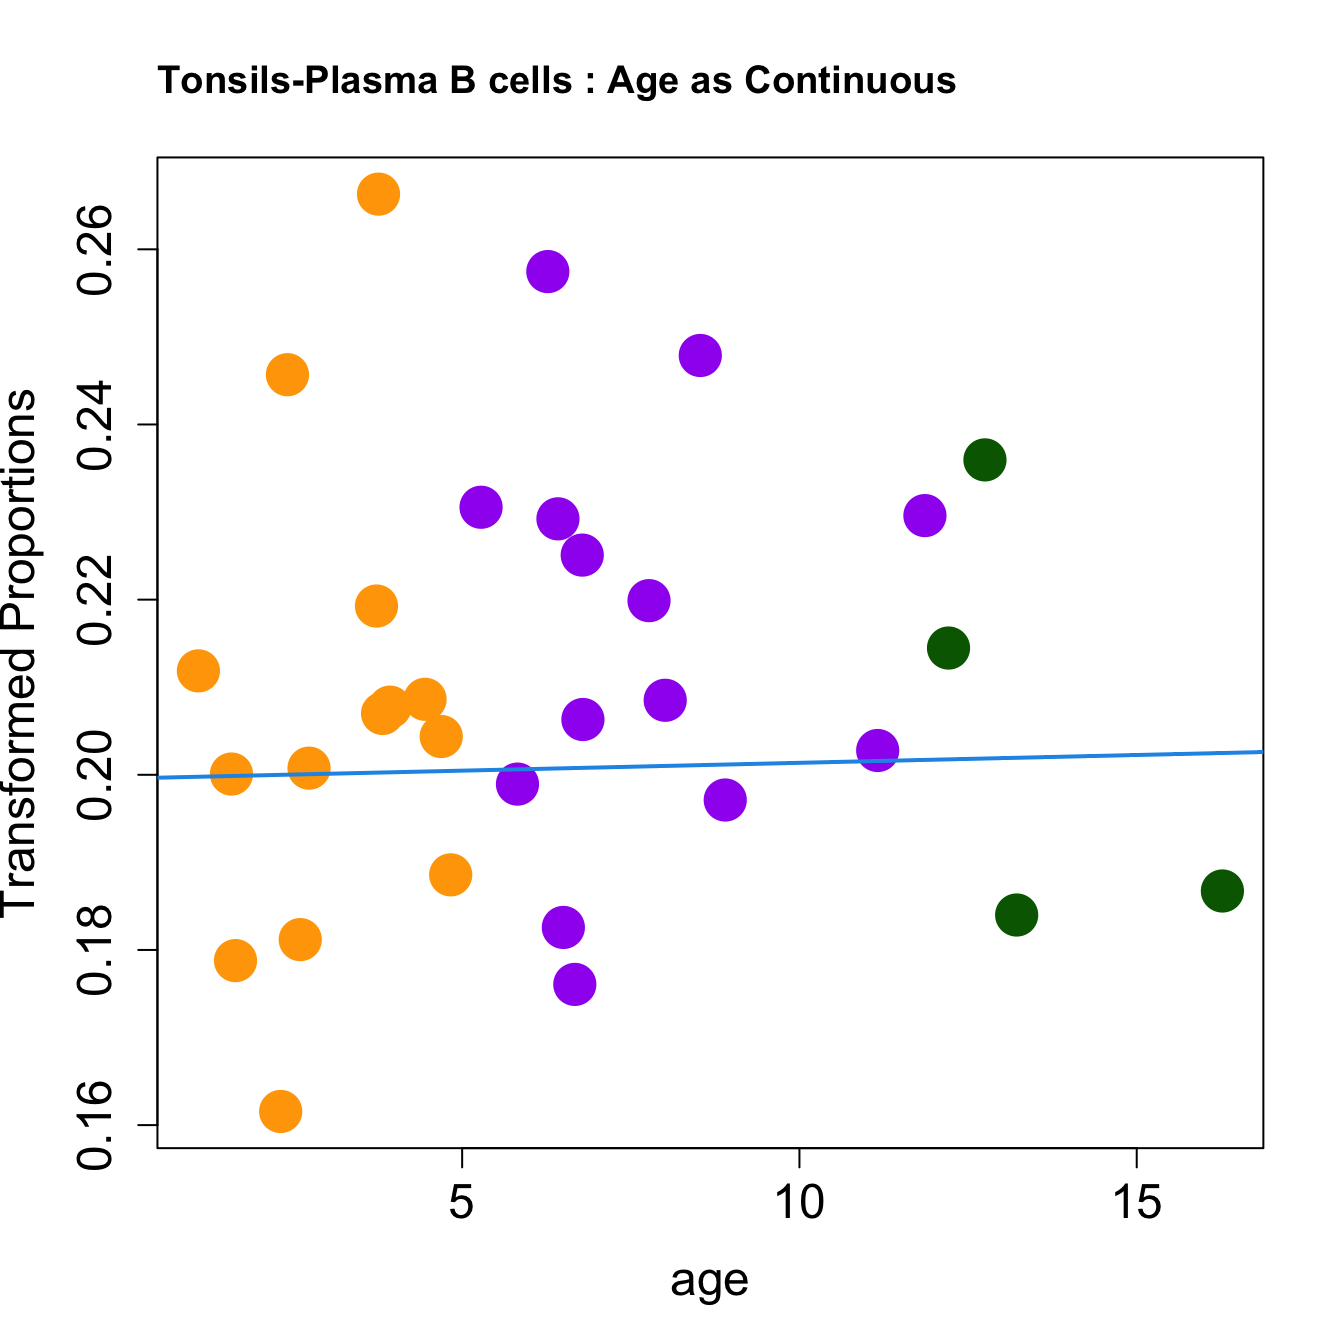
age_group_colors <- sapply(age, get_age_group_color)
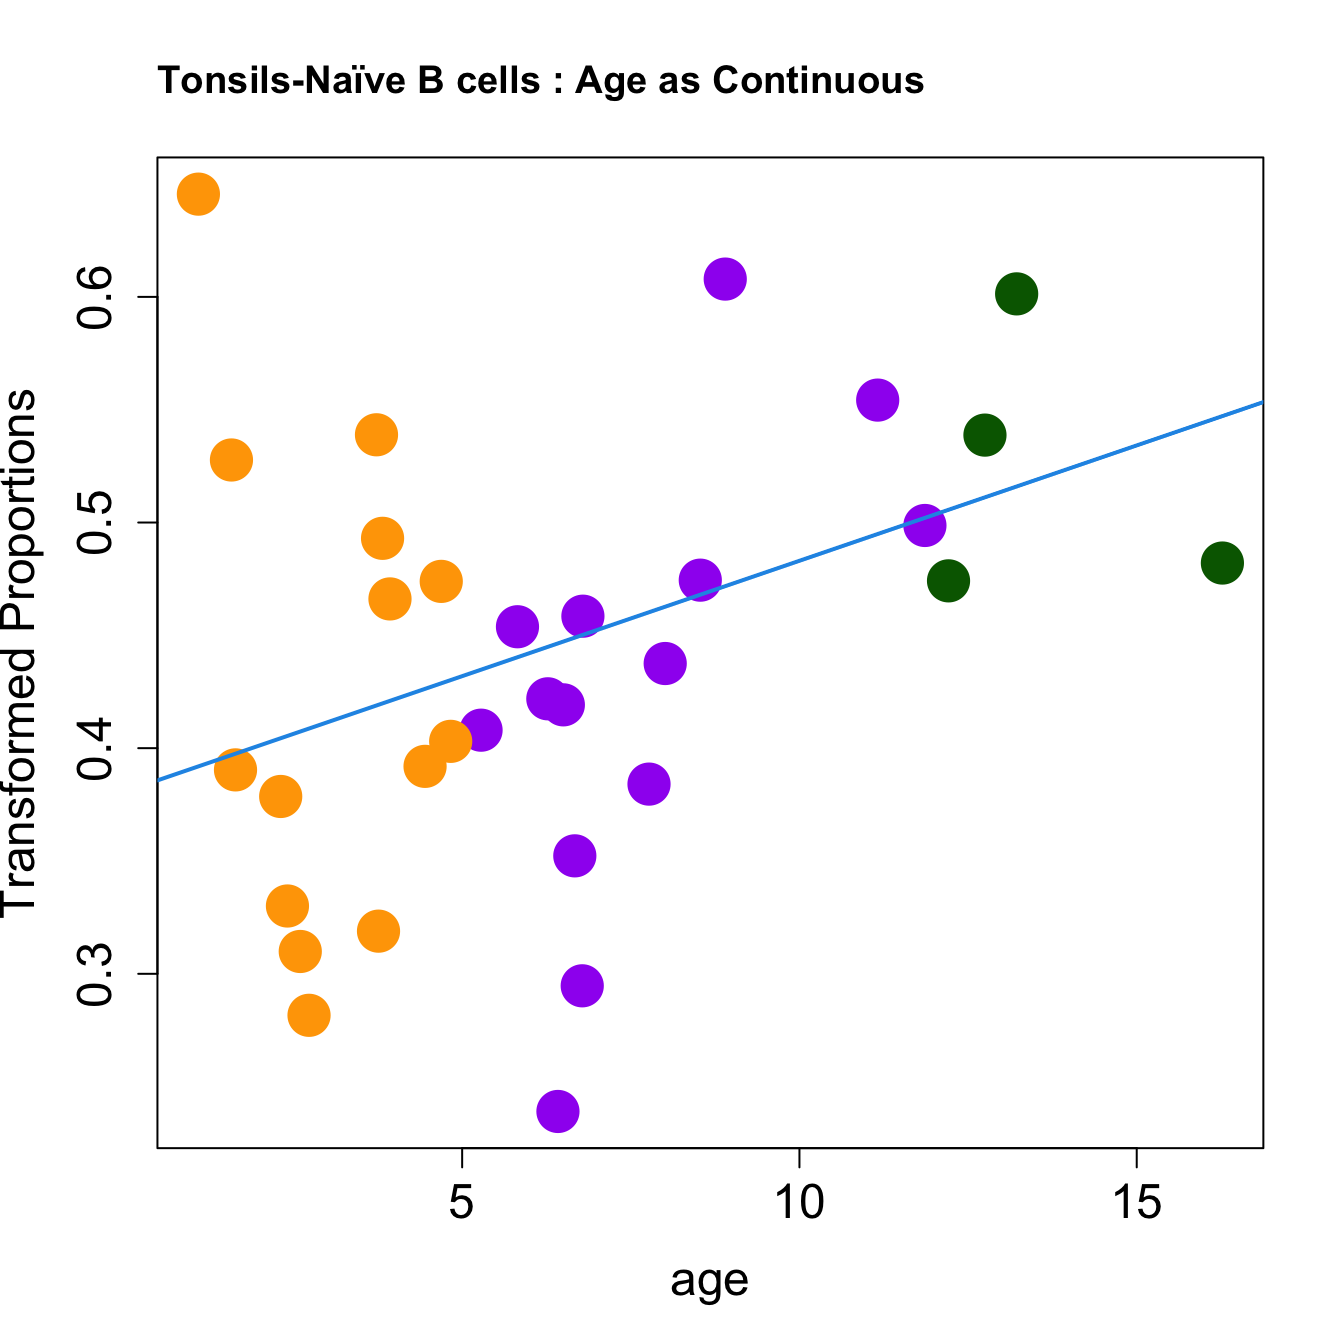
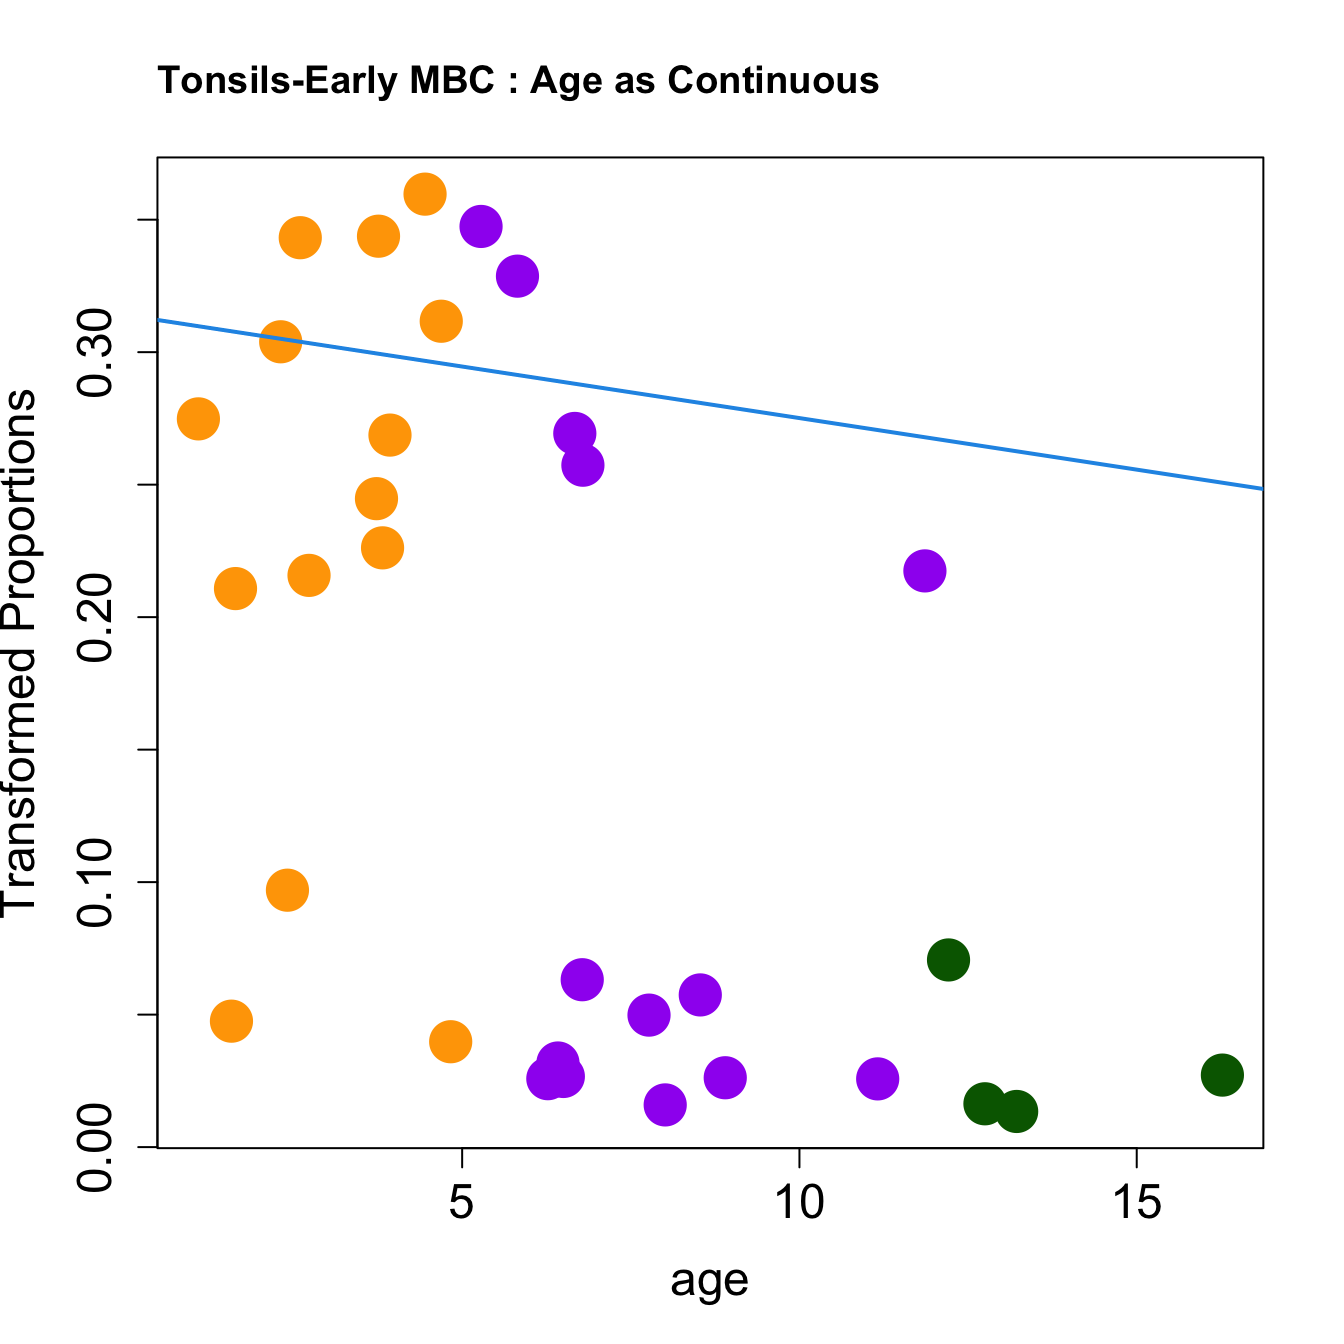
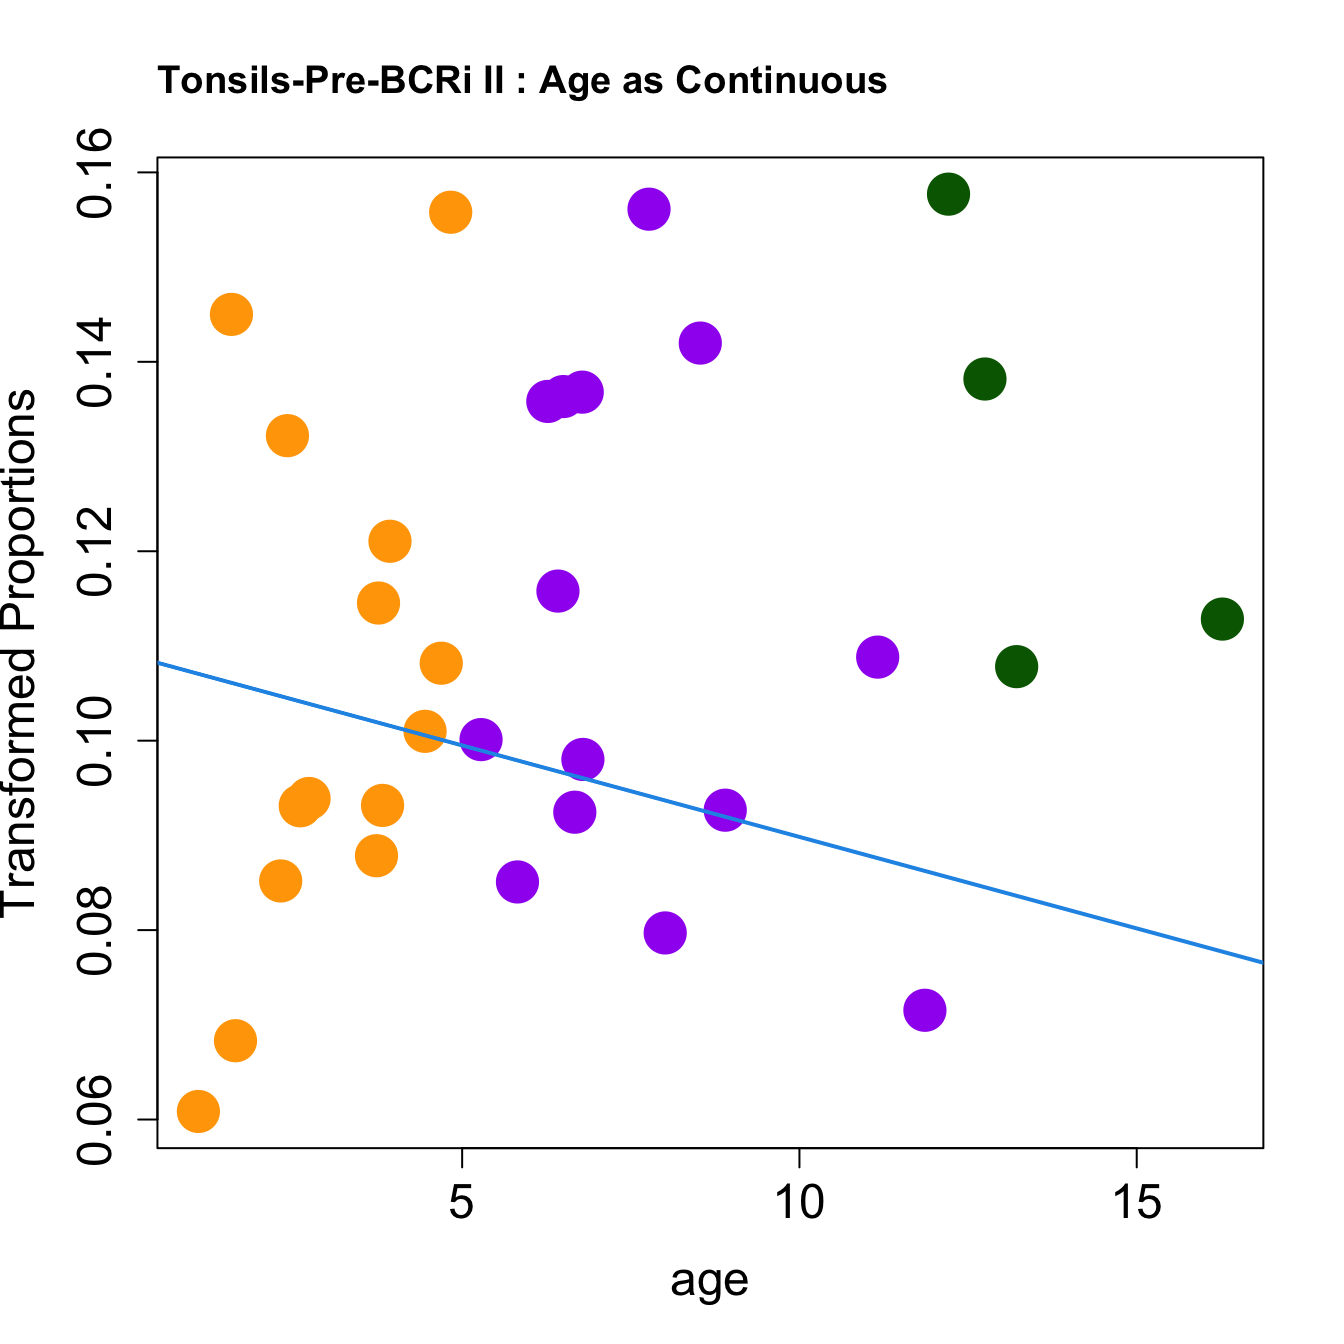
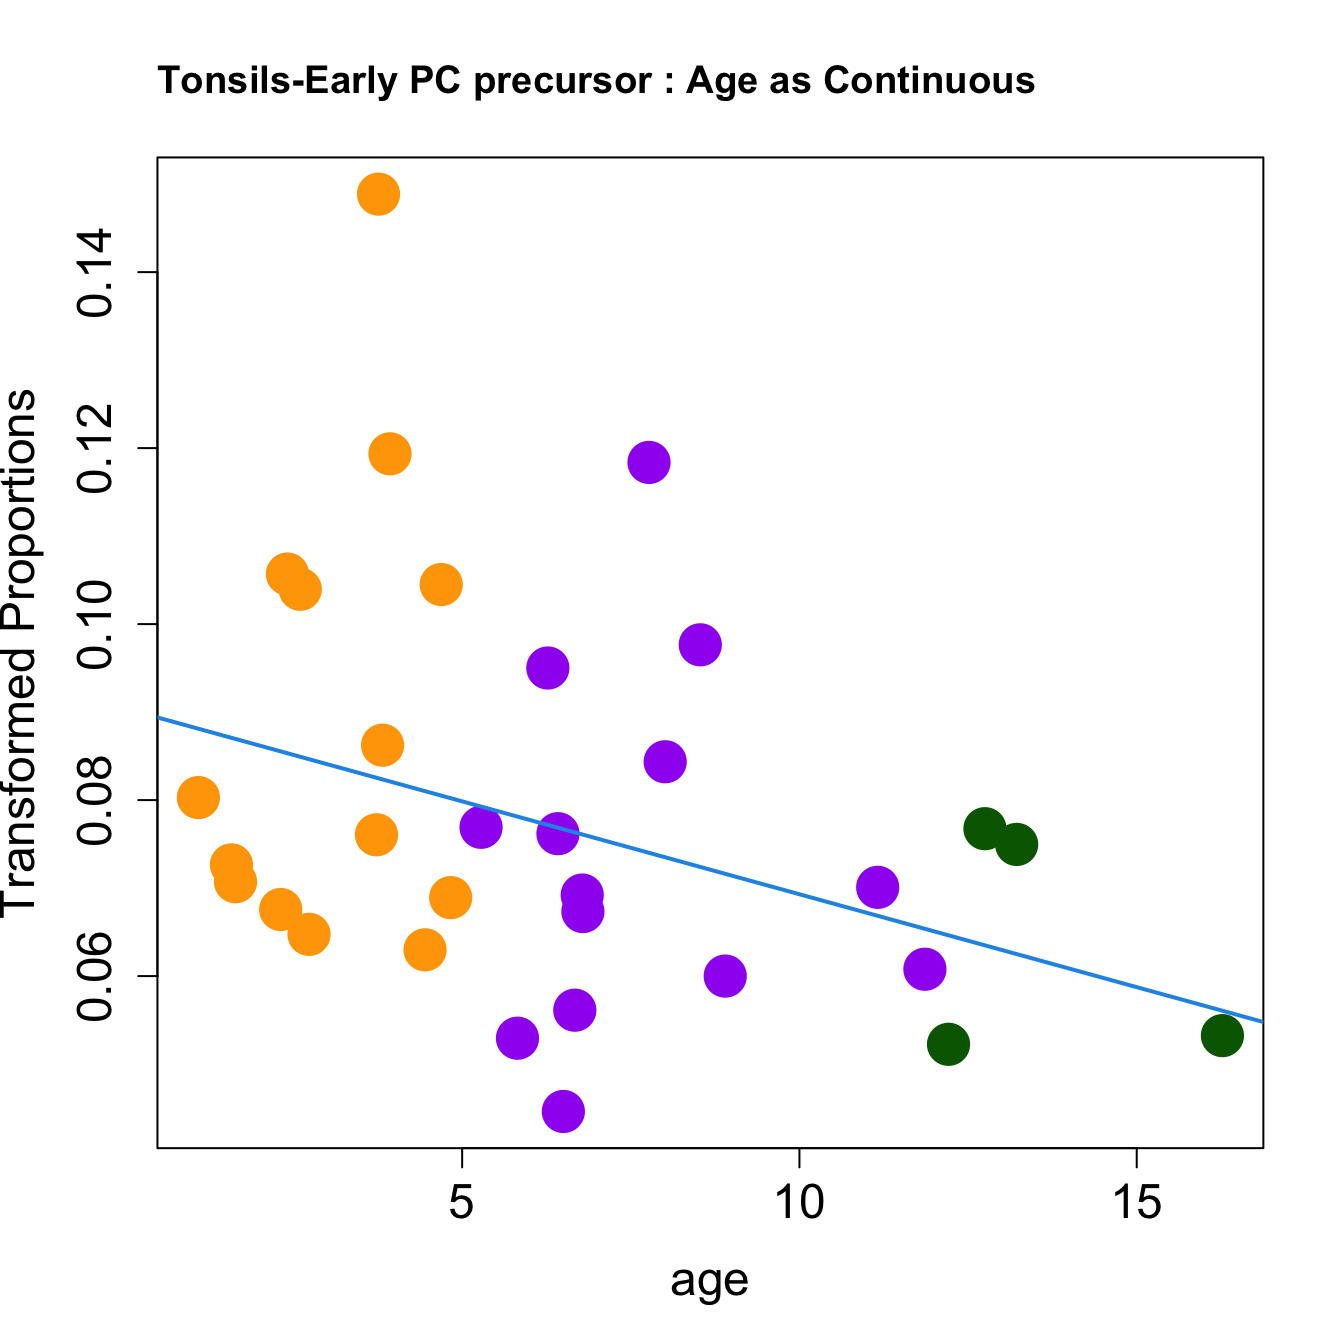
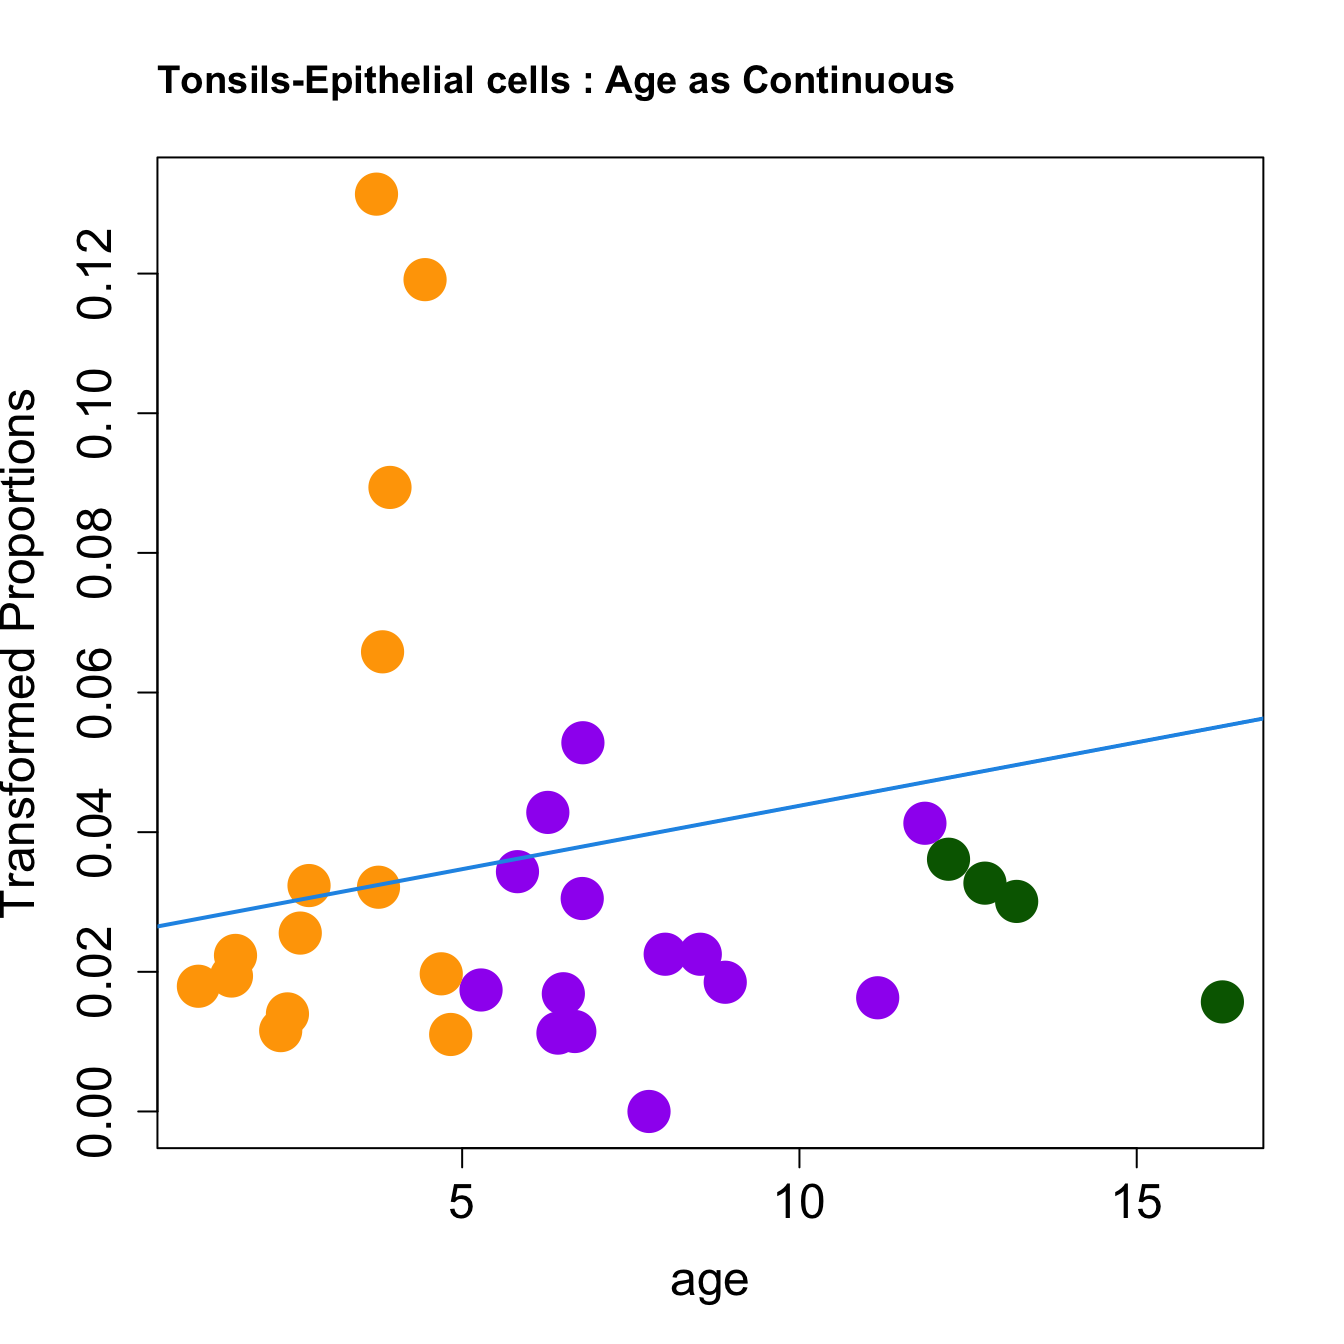
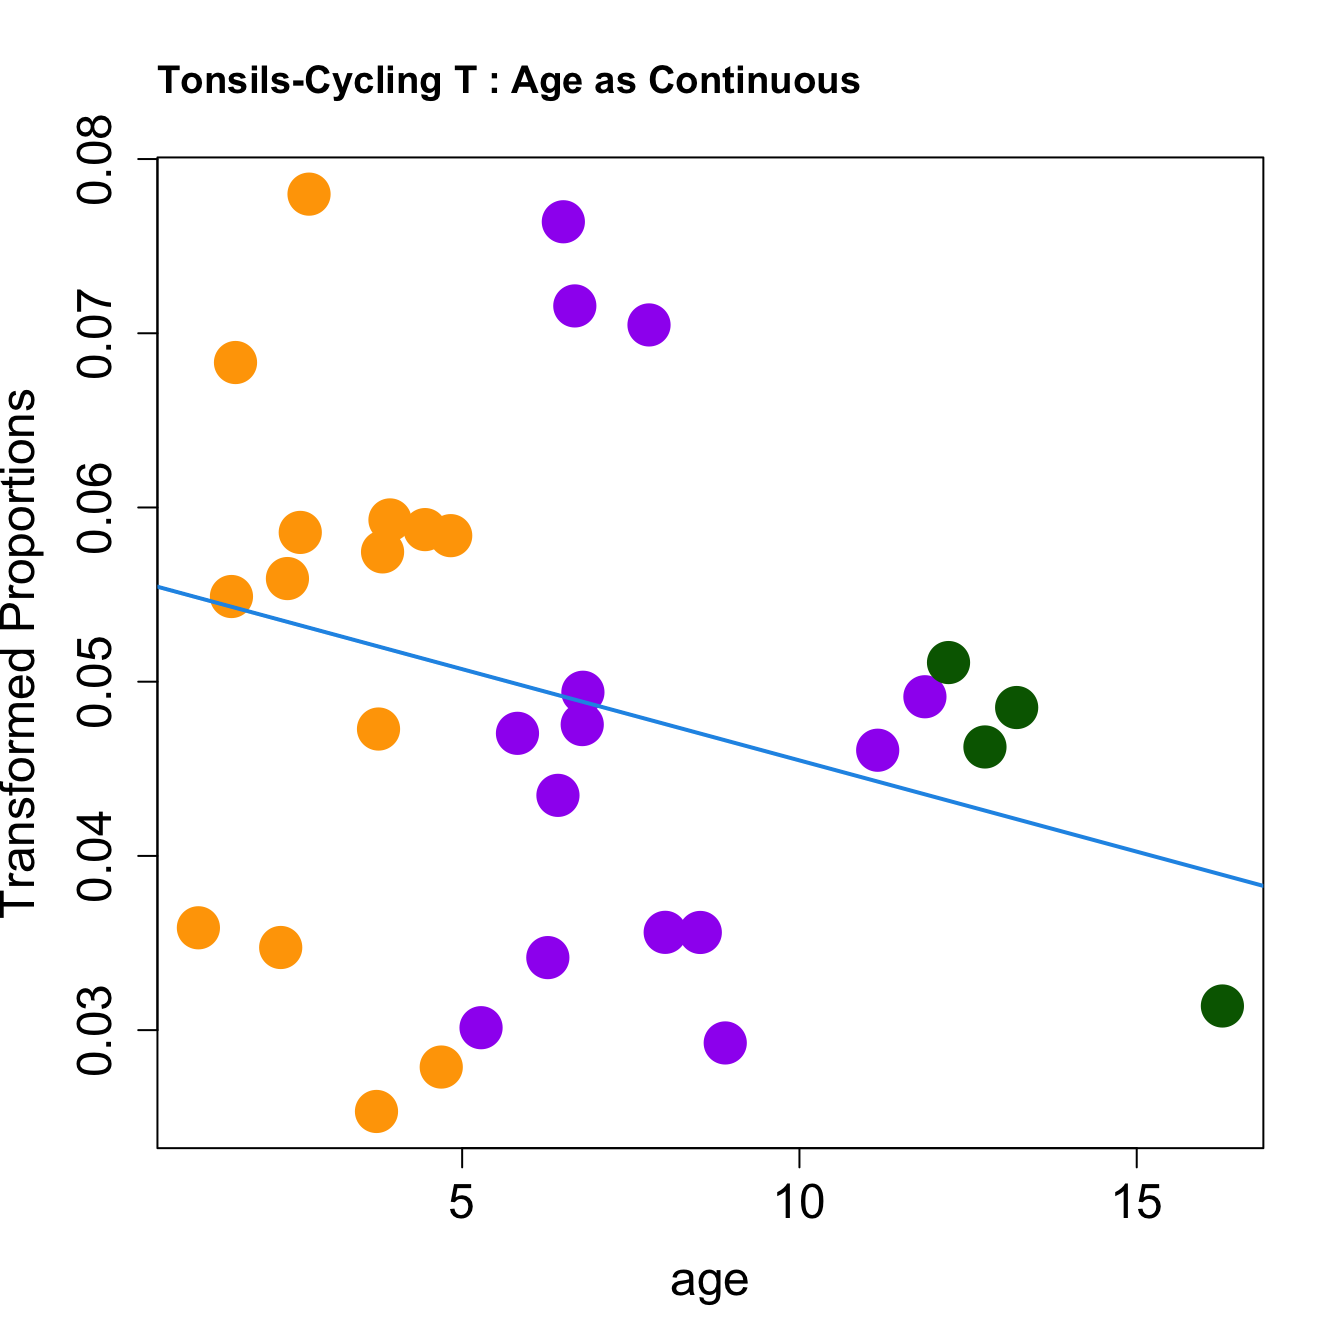
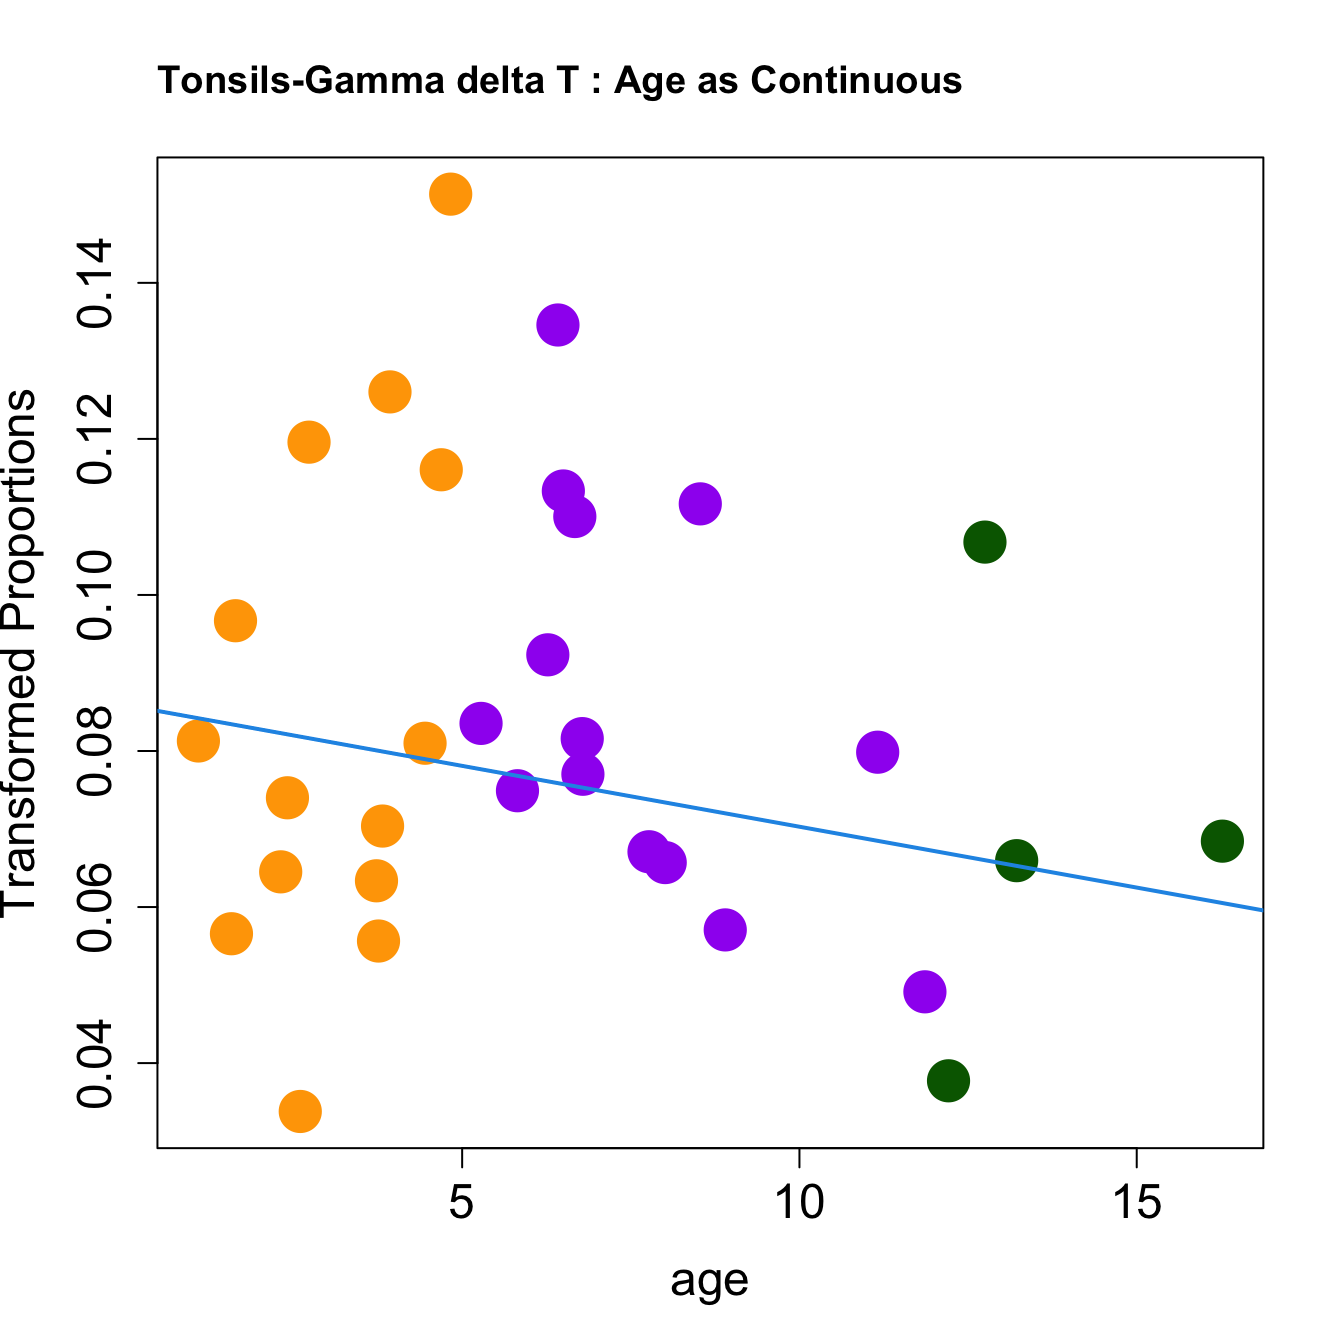
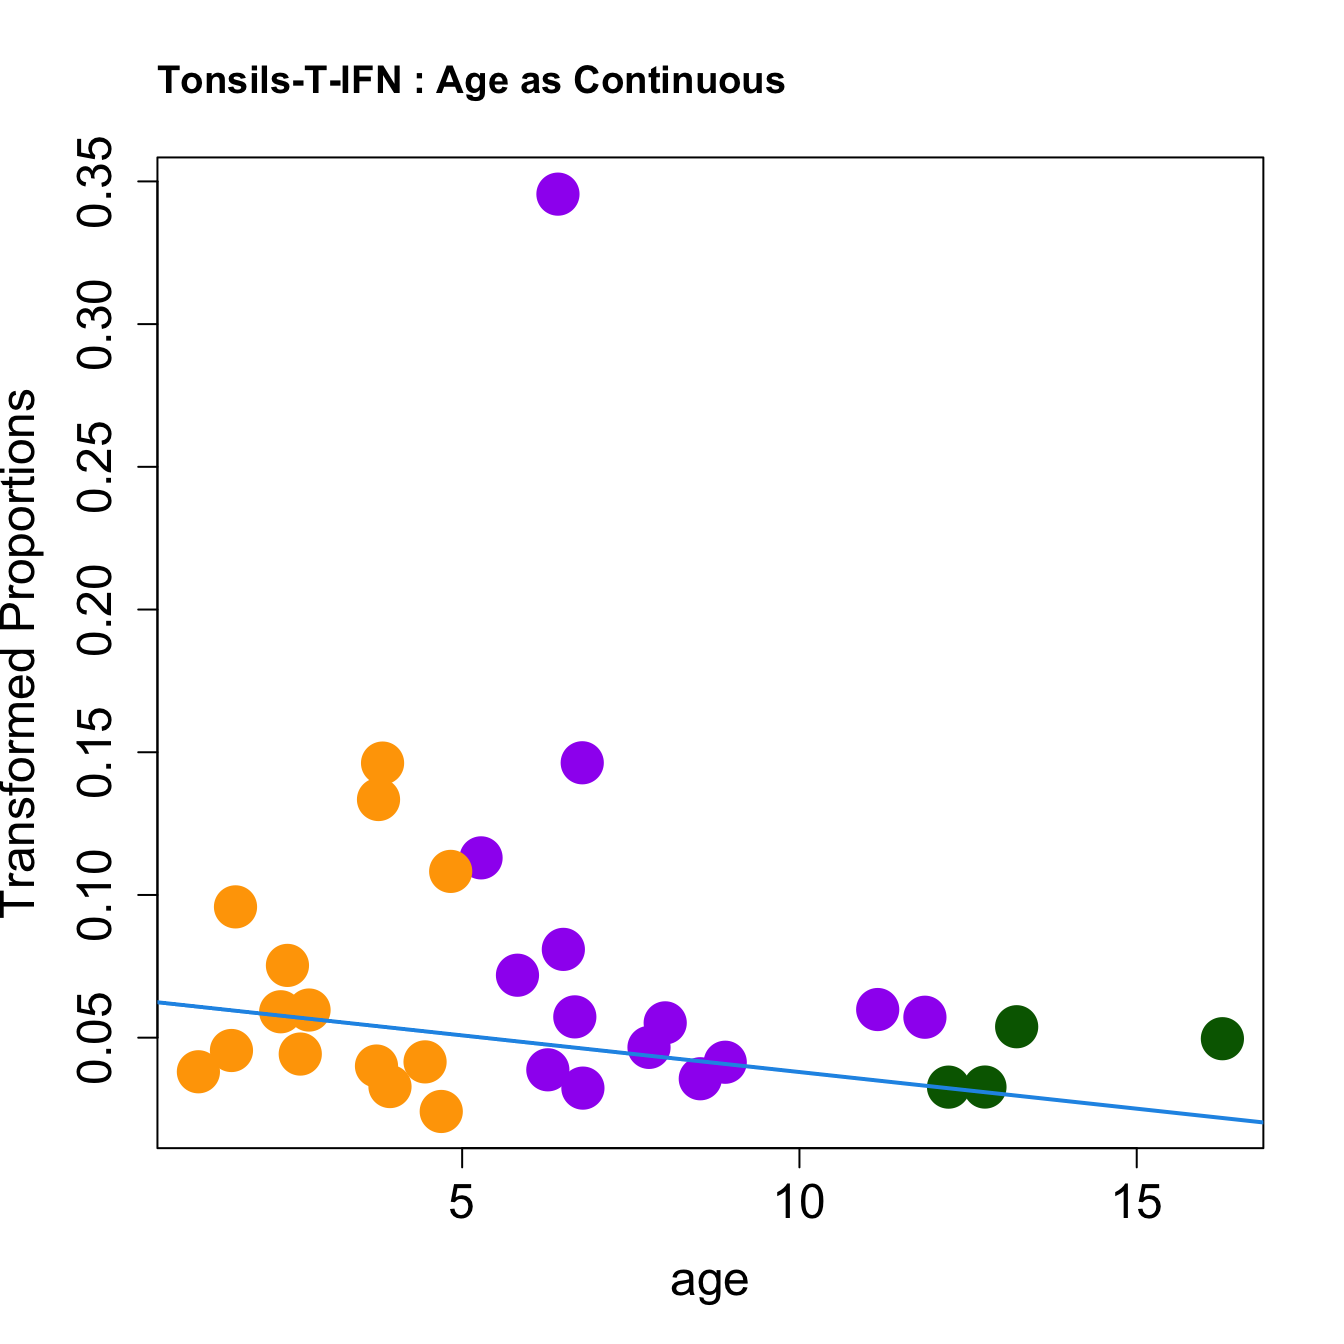
par(mfrow=c(1,1))
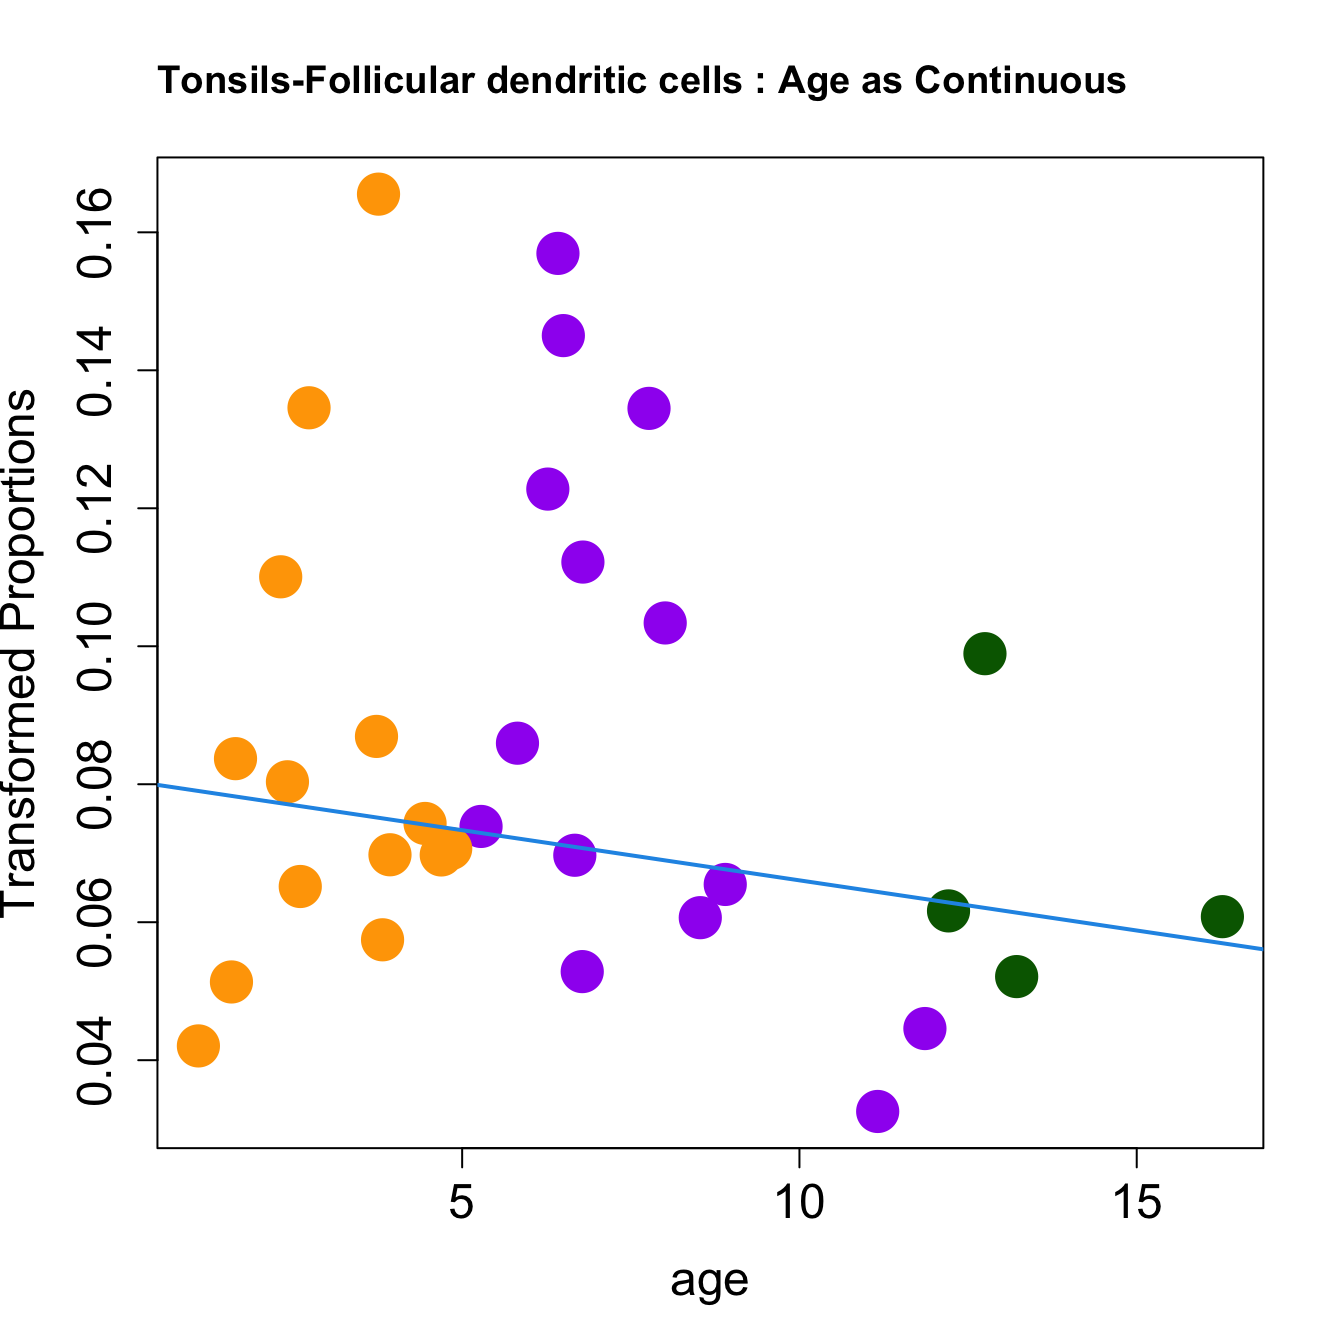
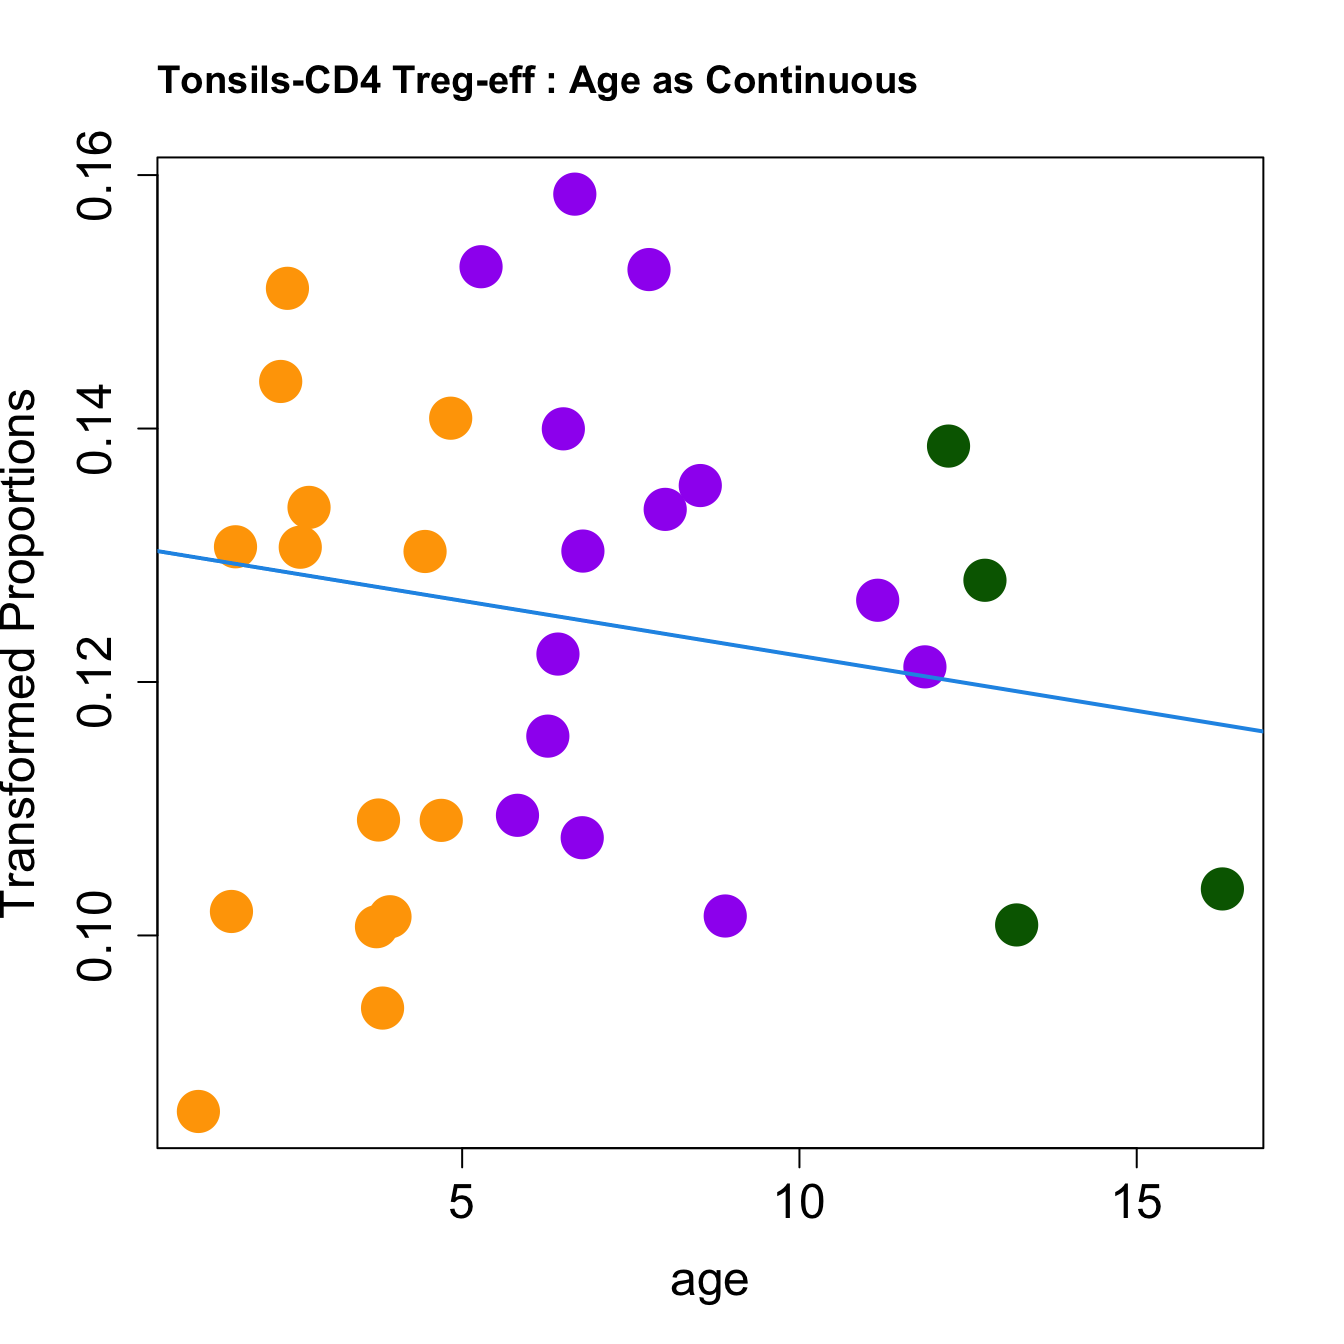
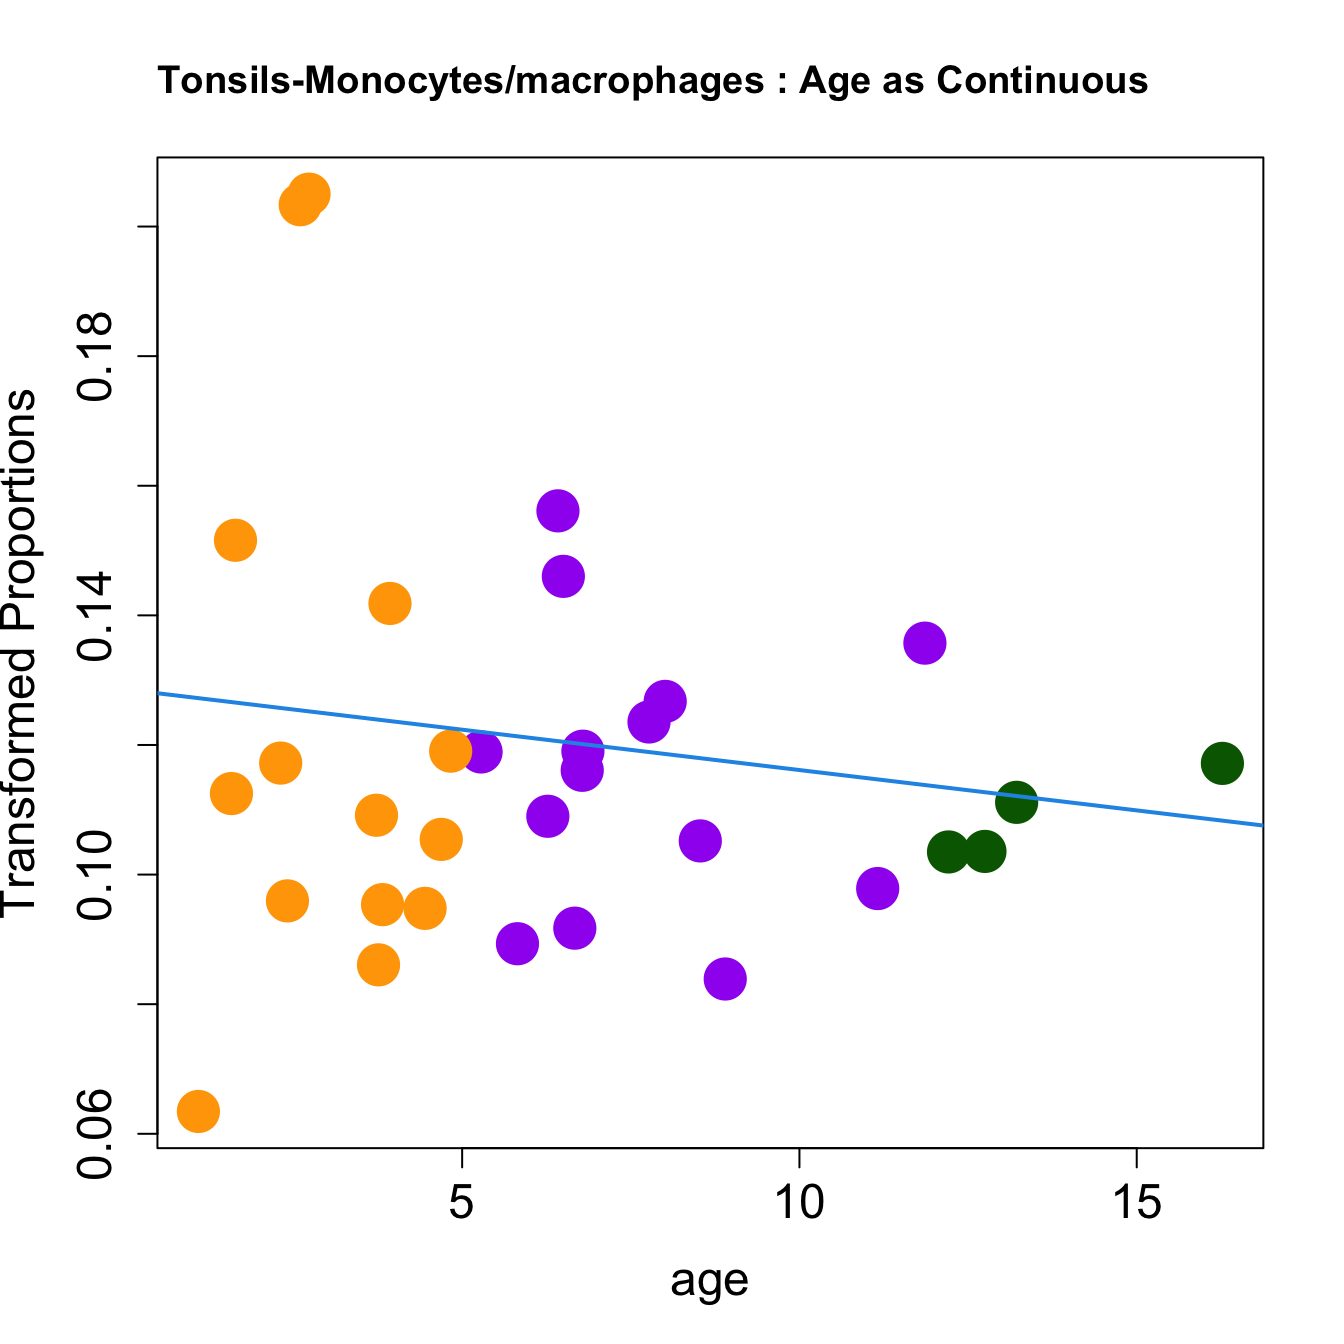
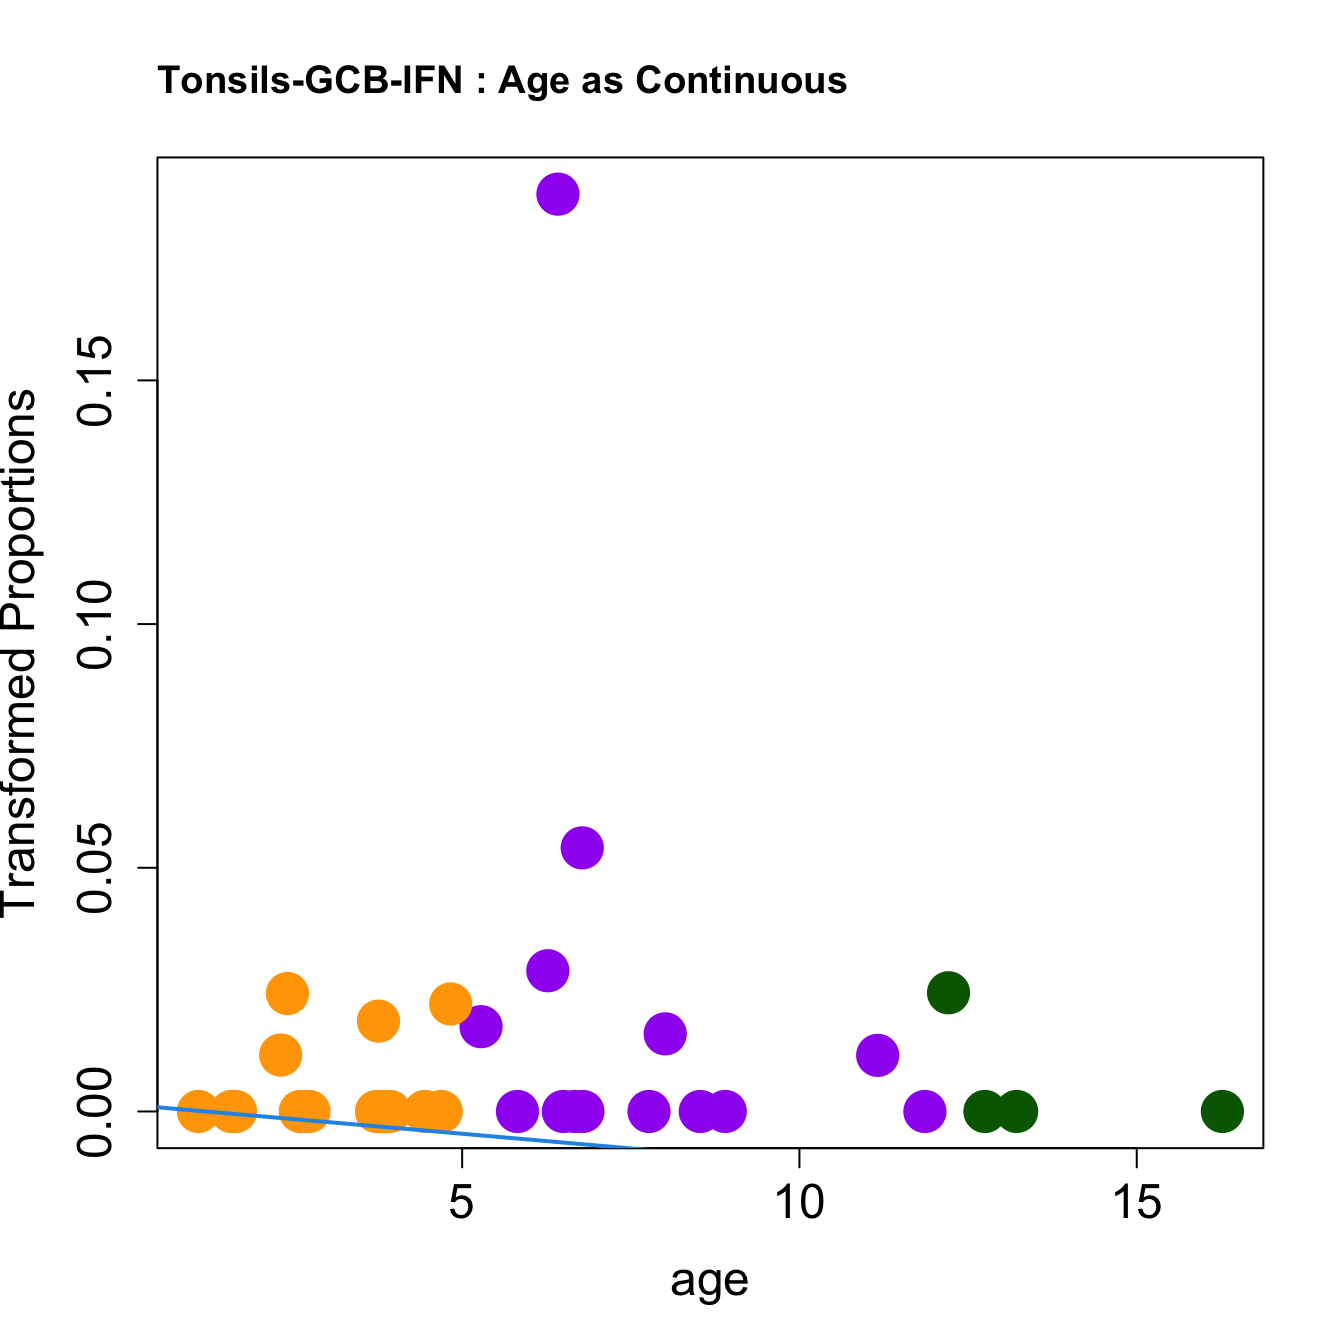
for (i in rownames(toptable.transformedProps)) {
plot(age, props$TransformedProps[i,],
pch=16, cex=3, ylab="Transformed Proportions", cex.lab=1.5, cex.axis=1.5,cex.main=2, col=age_group_colors)
abline(a=fit$coefficients[i, 1], b=fit$coefficients[i, 2], col=4, lwd=2)
title(paste0(tissue, "-", i, " : Age as Continuous"), cex.main = 1.2, adj = 0)
}
| Version | Author | Date |
|---|---|---|
| 0f07f72 | Gunjan Dixit | 2024-10-07 |
| Version | Author | Date |
|---|---|---|
| 0f07f72 | Gunjan Dixit | 2024-10-07 |
| Version | Author | Date |
|---|---|---|
| 0f07f72 | Gunjan Dixit | 2024-10-07 |
| Version | Author | Date |
|---|---|---|
| 0f07f72 | Gunjan Dixit | 2024-10-07 |
| Version | Author | Date |
|---|---|---|
| 0f07f72 | Gunjan Dixit | 2024-10-07 |
| Version | Author | Date |
|---|---|---|
| 0f07f72 | Gunjan Dixit | 2024-10-07 |
| Version | Author | Date |
|---|---|---|
| 0f07f72 | Gunjan Dixit | 2024-10-07 |
| Version | Author | Date |
|---|---|---|
| 0f07f72 | Gunjan Dixit | 2024-10-07 |
| Version | Author | Date |
|---|---|---|
| 0f07f72 | Gunjan Dixit | 2024-10-07 |
| Version | Author | Date |
|---|---|---|
| 0f07f72 | Gunjan Dixit | 2024-10-07 |
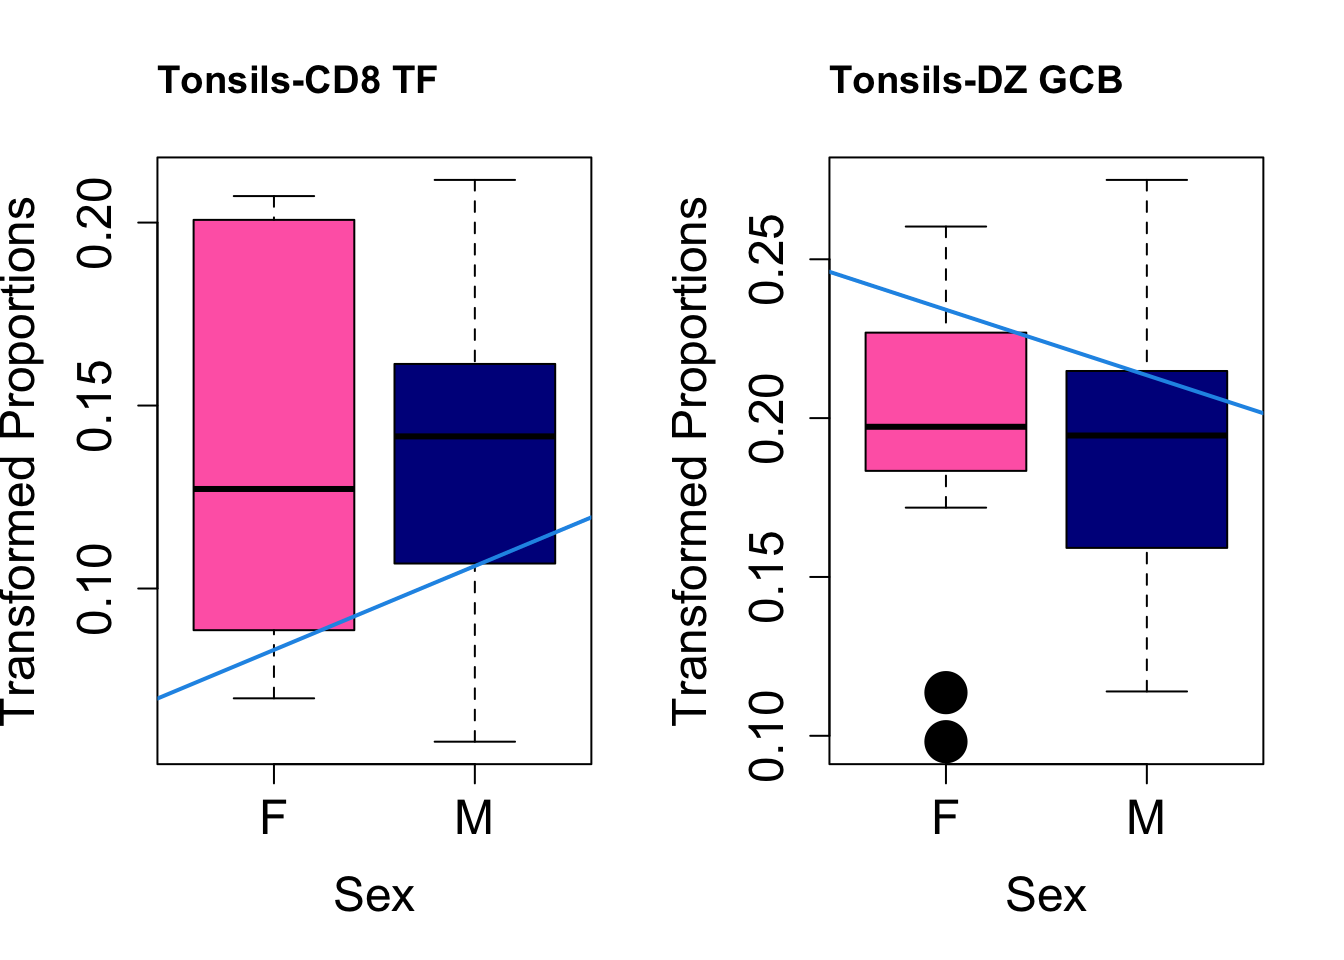
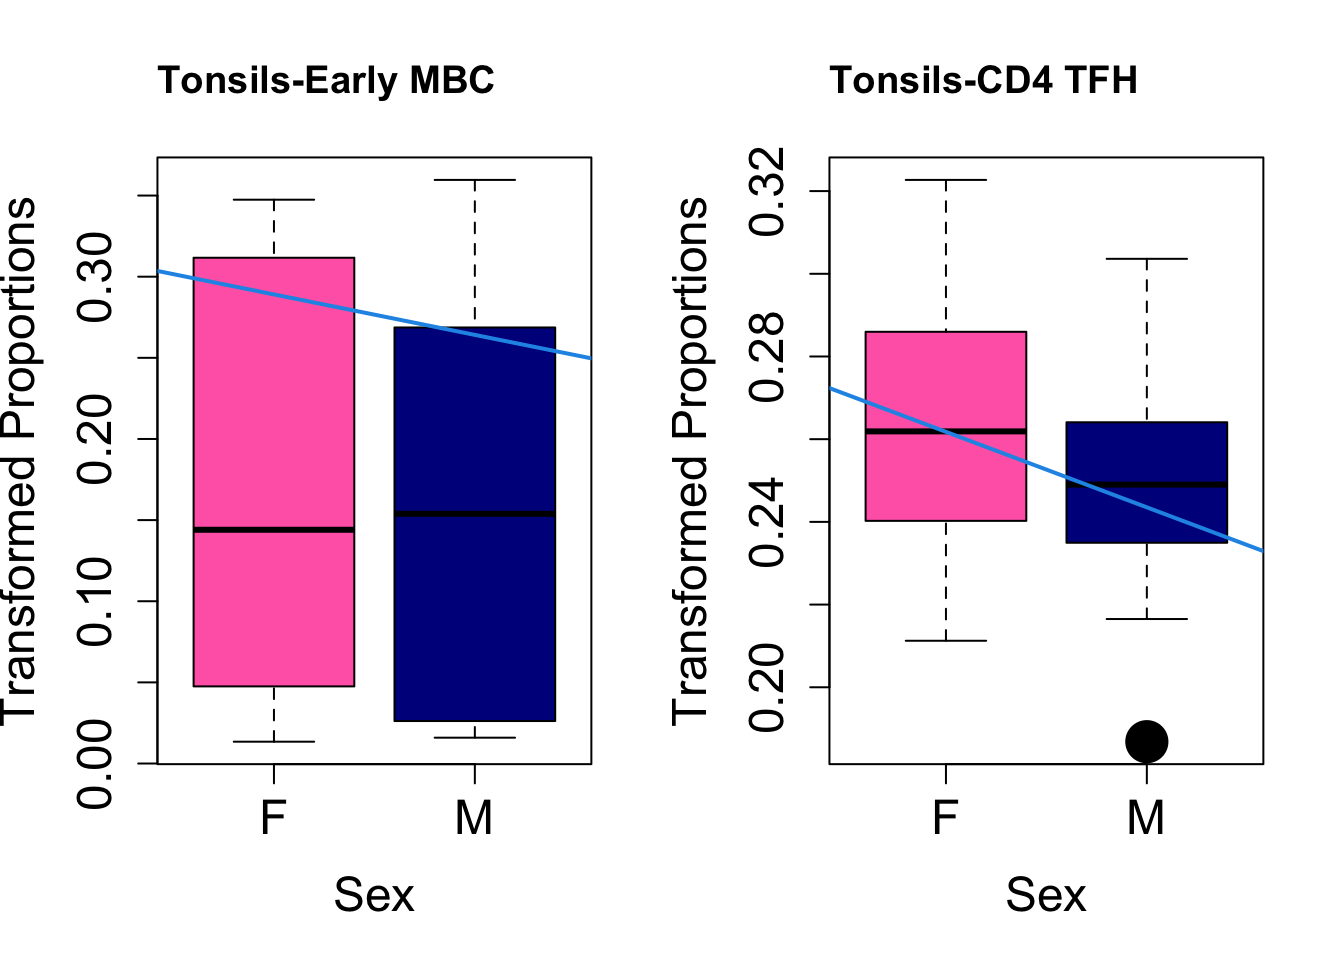
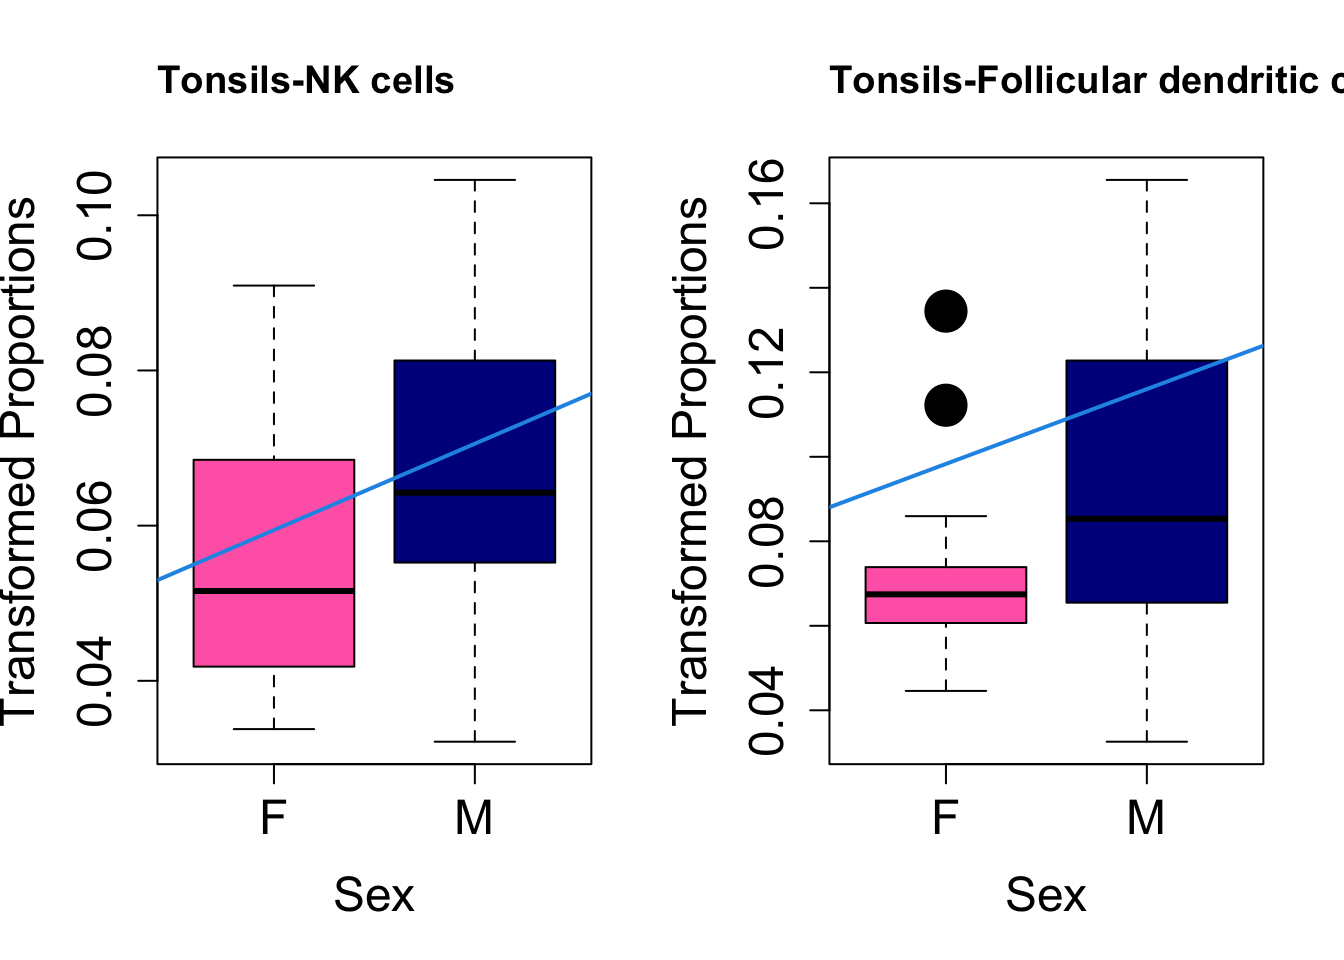
Plot results for Sex
coef = "sexM"
toptable.transformedProps.sex <- topTable(fit, coef = coef)
# Plot Sex
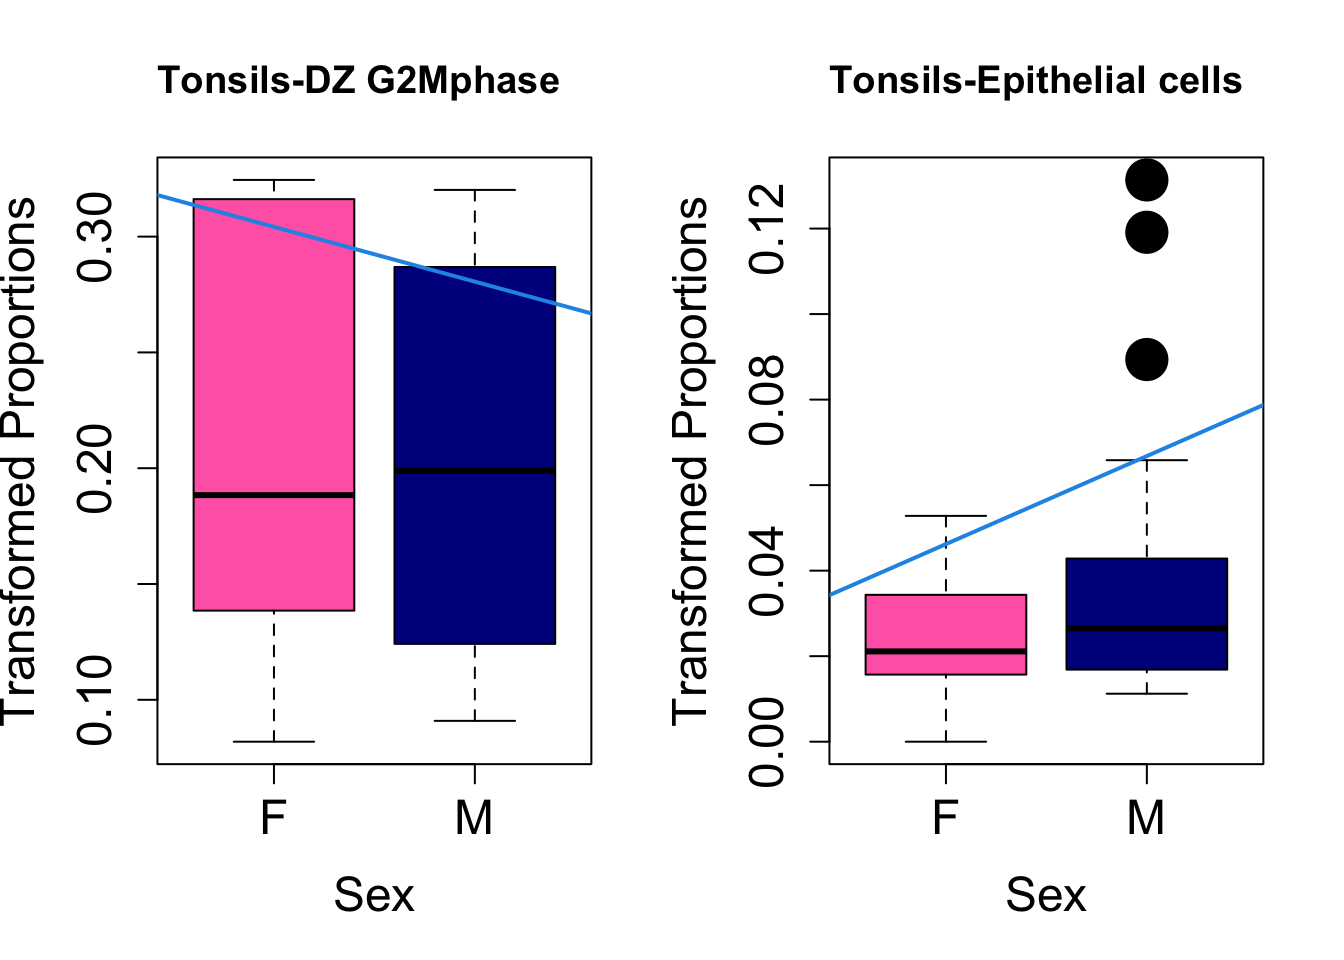
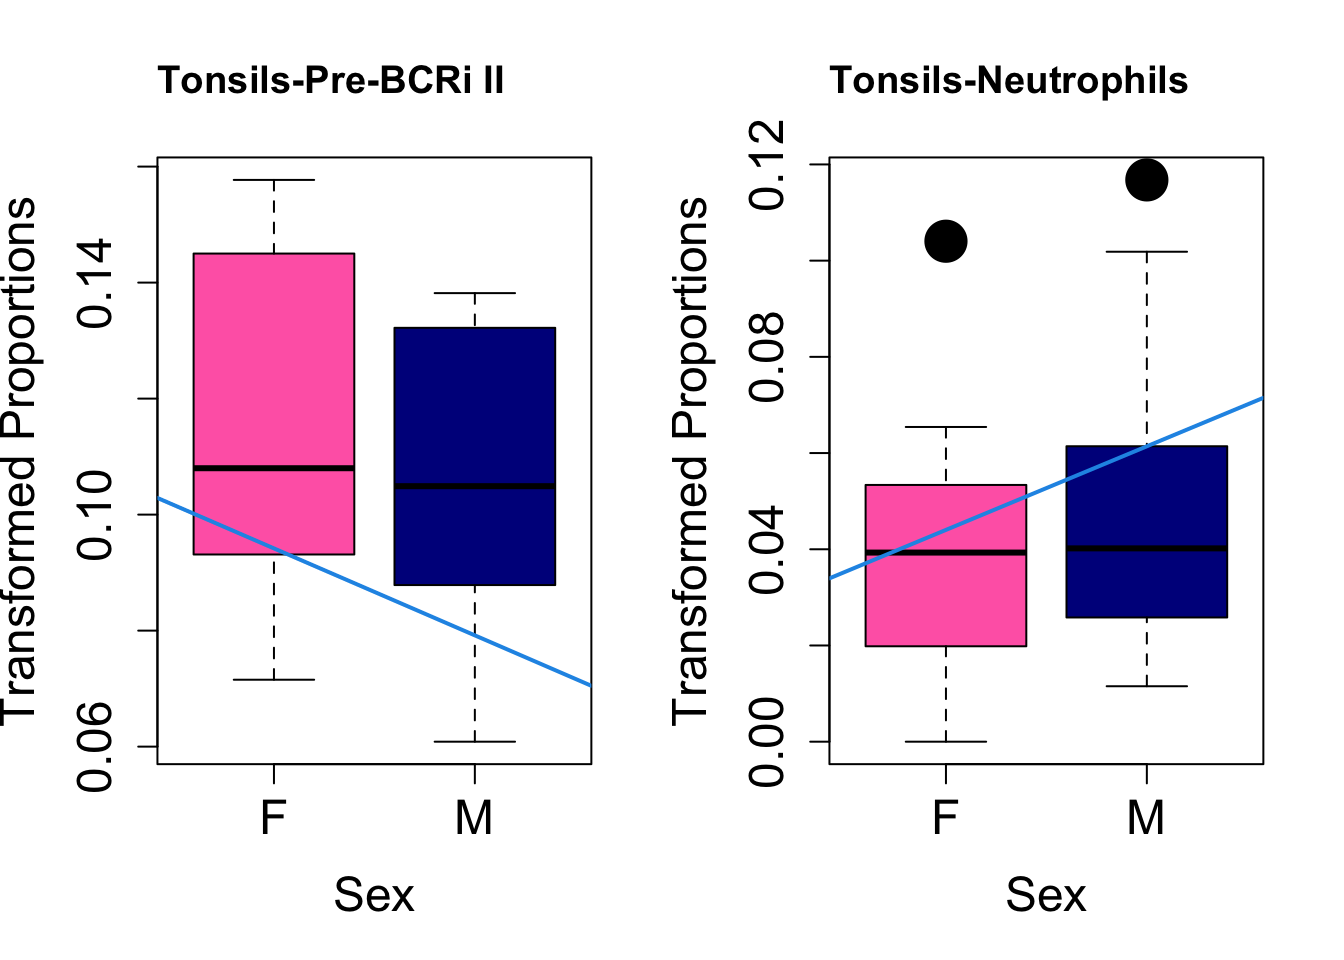
cat(paste0("#### Sex"," {.tabset}\n\n"))#### Sex {.tabset} par(mfrow=c(1,2))
for (i in rownames(toptable.transformedProps.sex)) {
plot(sex, props$TransformedProps[i,],
pch=16, cex=3, ylab="Transformed Proportions", xlab="Sex", cex.lab=1.5, cex.axis=1.5,
cex.main=2, col=c("hotpink", "darkblue"))
abline(a=fit$coefficients[i, 1], b=fit$coefficients[i, 3], col=4,
lwd=2)
title(paste0(tissue, "-", i), cex.main = 1.2, adj = 0)
}
| Version | Author | Date |
|---|---|---|
| 0f07f72 | Gunjan Dixit | 2024-10-07 |
| Version | Author | Date |
|---|---|---|
| 0f07f72 | Gunjan Dixit | 2024-10-07 |
| Version | Author | Date |
|---|---|---|
| 0f07f72 | Gunjan Dixit | 2024-10-07 |
| Version | Author | Date |
|---|---|---|
| 0f07f72 | Gunjan Dixit | 2024-10-07 |
| Version | Author | Date |
|---|---|---|
| 0f07f72 | Gunjan Dixit | 2024-10-07 |
Save results
out <- here("output",
            "CSV_v2",
             paste0("G000231_Neeland_",tissue,".propeller.xlsx"))
if (!file.exists(out)) {
  write.xlsx(toptable.transformedProps, file = out, rowNames= T)
}
Interaction model for Age and Sex
design <- model.matrix(~age*sex)
design
(Intercept) age sexM age:sexM
1 1 1.09 1 1.09
2 1 6.79 0 0.00
3 1 5.82 0 0.00
4 1 1.64 1 1.64
5 1 3.73 1 3.73
6 1 2.31 1 2.31
7 1 3.82 1 3.82
8 1 6.67 0 0.00
9 1 2.73 1 2.73
10 1 3.93 1 3.93
11 1 11.86 0 0.00
12 1 2.60 0 0.00
13 1 3.76 1 3.76
14 1 4.45 1 4.45
15 1 5.28 0 0.00
16 1 4.69 0 0.00
17 1 8.90 1 8.90
18 1 2.41 1 2.41
19 1 1.58 0 0.00
20 1 8.01 1 8.01
21 1 11.16 1 11.16
22 1 6.78 1 6.78
23 1 6.42 1 6.42
24 1 16.27 0 0.00
25 1 12.75 1 12.75
26 1 7.77 0 0.00
27 1 6.27 1 6.27
28 1 6.50 1 6.50
29 1 4.83 0 0.00
30 1 8.53 0 0.00
31 1 13.22 0 0.00
32 1 12.21 0 0.00
attr(,"assign")
[1] 0 1 2 3
attr(,"contrasts")
attr(,"contrasts")$sex
[1] "contr.treatment"fit <- lmFit(props$TransformedProps, design)
cont.matrix <- cbind(
AgeInFemales = c(0, 1, 0, 0),
AgeInMales = c(0, 1, 0, 1),
Diff = c(0, 0, 0, 1)
)
cont.matrix AgeInFemales AgeInMales Diff
[1,] 0 0 0
[2,] 1 1 0
[3,] 0 0 0
[4,] 0 1 1fit2 <- contrasts.fit(fit, cont.matrix)
fit2 <- eBayes(fit2)
coef = "Diff"
toptable.transformedProps <- topTable(fit2, coef = coef)
toptable.transformedProps logFC AveExpr t P.Value adj.P.Val
CD4 TCM -0.005360869 0.11608221 -2.344966 0.02572326 0.9124107
NK cells -0.003102576 0.06215240 -1.635101 0.11231126 0.9124107
DZ late Sphase 0.012672407 0.10932712 1.628402 0.11372996 0.9124107
Naïve B cells activated -0.005169514 0.17561445 -1.456520 0.15547005 0.9124107
Pre-BCRi II 0.003702976 0.11024757 1.423696 0.16468766 0.9124107
Early MBC -0.013666180 0.16117942 -1.350792 0.18670200 0.9124107
DZ early Sphase 0.003875947 0.16389995 1.339302 0.19037095 0.9124107
CD4 Treg -0.002380929 0.09558554 -1.327557 0.19417870 0.9124107
MAIT cells 0.001793287 0.04706547 1.278969 0.21055631 0.9124107
DZtoLZ GCB transition 0.010100824 0.18339989 1.200482 0.23919600 0.9262141
B
CD4 TCM -5.636851
NK cells -6.923152
DZ late Sphase -6.933528
Naïve B cells activated -7.187288
Pre-BCRi II -7.232967
Early MBC -7.331144
DZ early Sphase -7.346201
CD4 Treg -7.361473
MAIT cells -7.423377
DZtoLZ GCB transition -7.518976Age modelling across GC cell subsets (population)
idx <- which(merged_obj$cell_labels %in% "Germinal centre B cells")
merged_obj <- merged_obj[,idx]
merged_obj
An object of class Seurat
17566 features across 56859 samples within 1 assay
Active assay: RNA (17566 features, 2000 variable features)
4 layers present: data.2, counts.2, scale.data.2, scale.data
2 dimensional reductions calculated: pca, umap.mergedRepeat modeling steps
metadata_df <- data.frame(
  sample = merged_obj$sample_id,
  #donor = merged_obj$donor_id,
  age_years = as.character(merged_obj$age_years),
  cell_type = merged_obj$cell_labels_v2
)
metadata_df$age_years <- as.numeric(metadata_df$age_years)

barplot_data <- metadata_df %>%
  group_by(sample, age_years, cell_type) %>%
  summarise(n_cells = n()) %>%
  ungroup() %>%
  group_by(sample, age_years) %>%
  mutate(n_cells_total = sum(n_cells)) %>%
  ungroup() %>%
  mutate(percentage_cells = n_cells / n_cells_total)
`summarise()` has grouped output by 'sample', 'age_years'. You can override
using the `.groups` argument.barplot_data <- barplot_data %>%
arrange(age_years)
b <- ggplot(barplot_data, aes(x = reorder(paste(sample, age_years, sep = ":"), age_years),
y = percentage_cells, fill = cell_type)) +
geom_bar(stat = "identity") +
ggtitle(paste0("Age vs Cell Type Proportions (GC cell population): ", tissue)) +
labs(x = "Sample:Age (Years)", y = "Proportion", fill = "Cell Type") +
scale_fill_manual(values = color_palette) +
theme_minimal() +
theme(
plot.title = element_text(size = 13, hjust = 0.5, face = "bold"),
legend.position = "top",
axis.text.x = element_text(angle = 45, hjust = 1)
)
b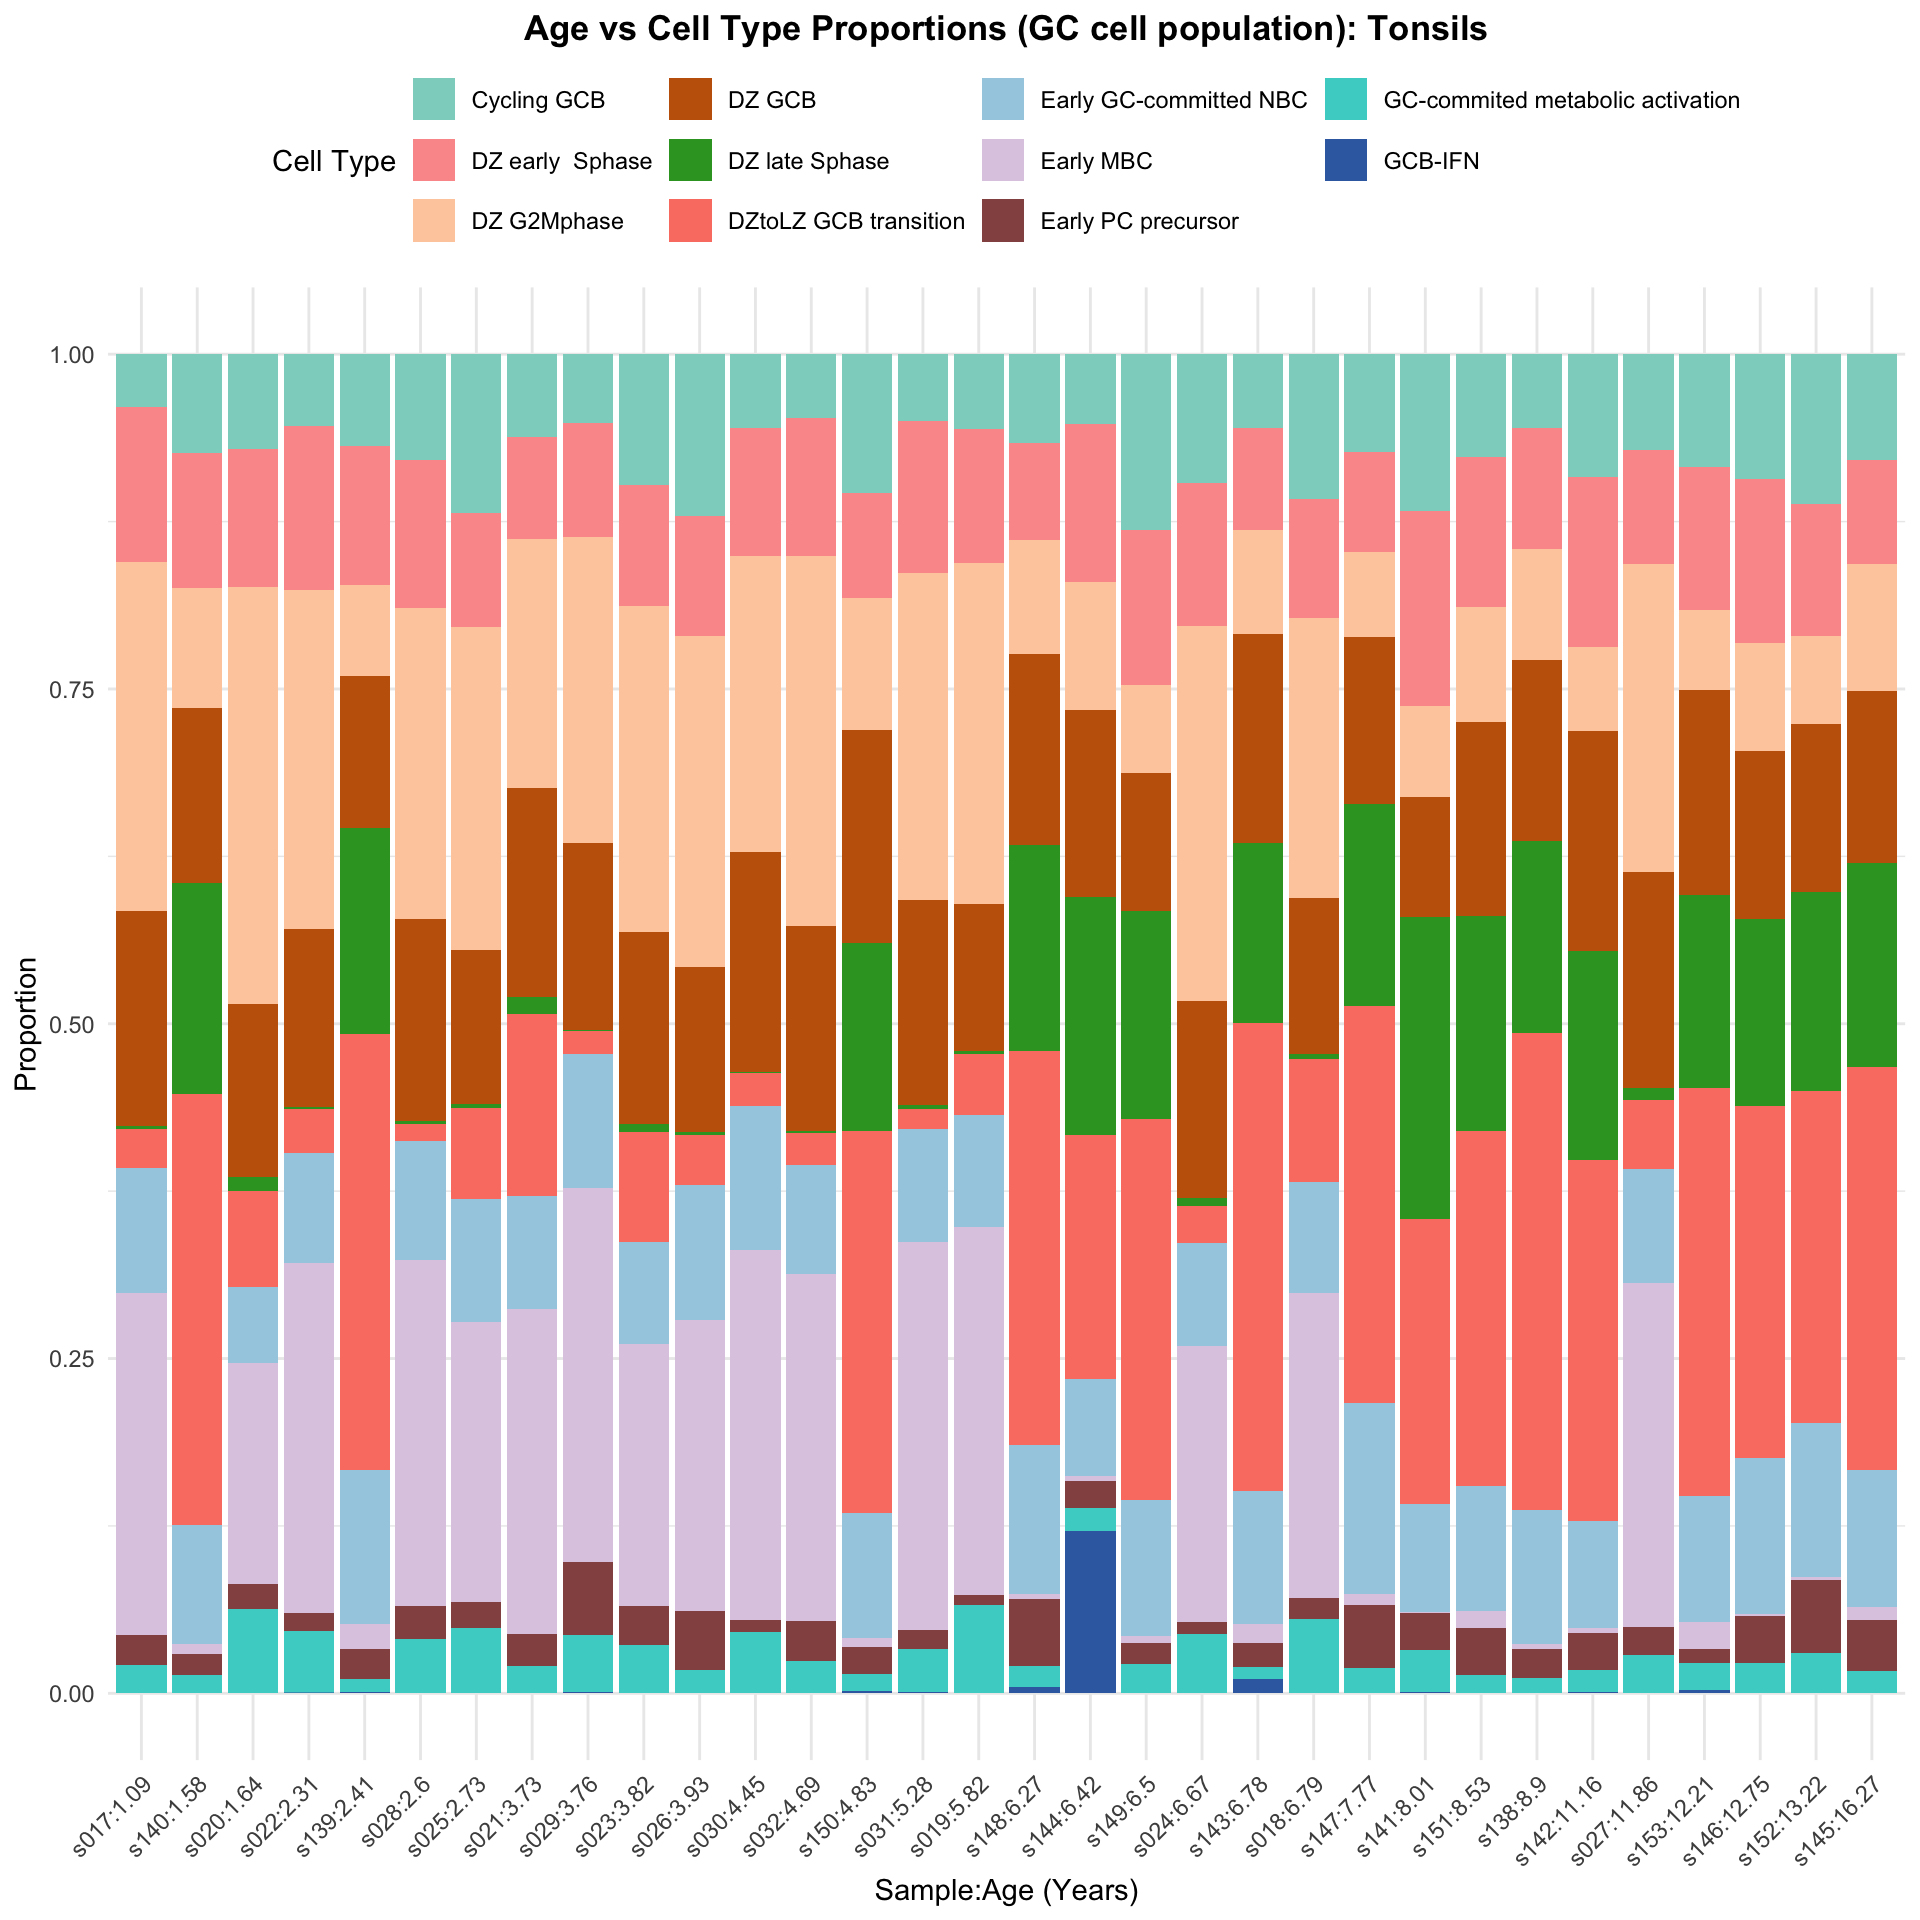
props <- getTransformedProps(clusters = merged_obj$cell_labels_v2,
                               sample = merged_obj$sample_id, transform = "asin")
Performing arcsin square root transformation of proportions# Plot Cell Type Mean Variance
p1 <- plotCellTypeMeanVar(props$Counts)Using classic mode.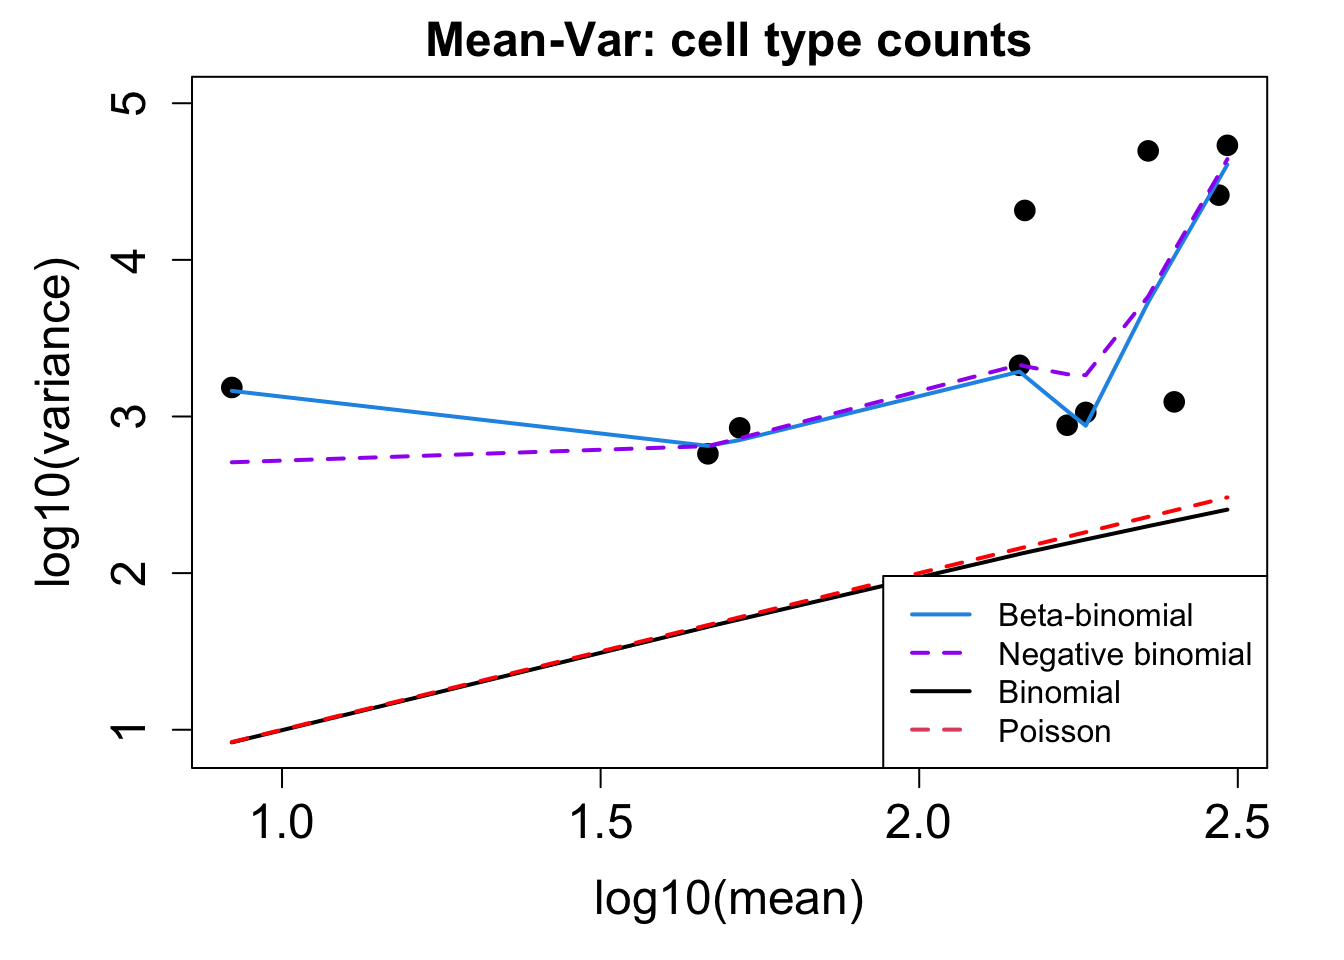
# Plot Cell Type Proportions Mean Variance
p2 <- plotCellTypePropsMeanVar(props$Counts)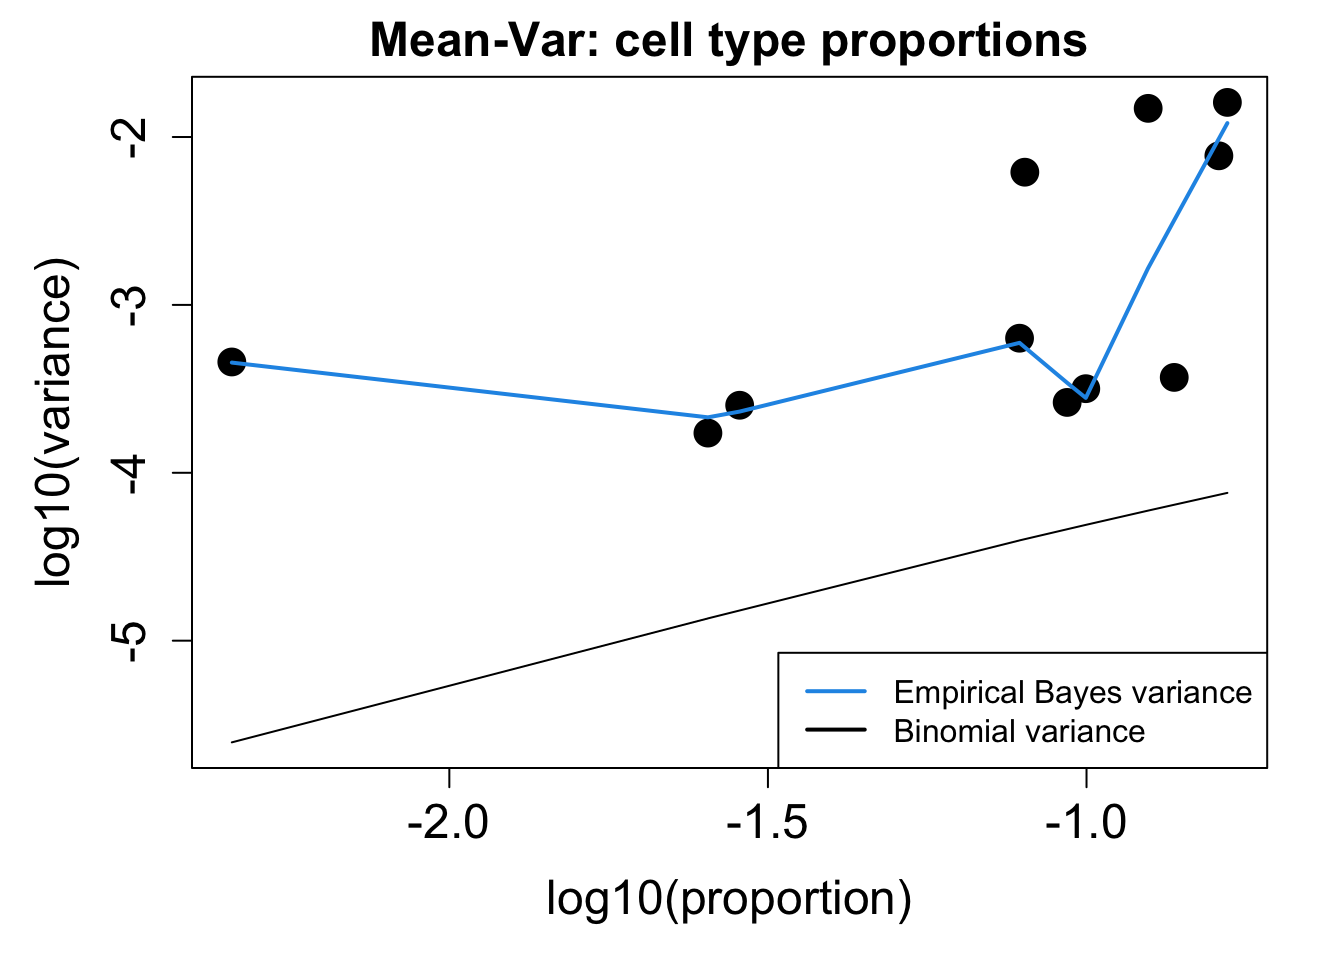
p1 / p2numeric(0)print(knitr::kable(props$Proportions, caption = "Cell-type proportions (GC cell population) in samples"))
Table: Cell-type proportions (GC cell population) in samples

|                                 |      s017|      s018|      s019|      s020|      s021|      s022|      s023|      s024|      s025|      s026|      s027|      s028|      s029|      s030|      s031|      s032|      s138|      s139|      s140|      s141|      s142|      s143|      s144|      s145|      s146|      s147|      s148|      s149|      s150|      s151|      s152|      s153|
|:--------------------------------|---------:|---------:|---------:|---------:|---------:|---------:|---------:|---------:|---------:|---------:|---------:|---------:|---------:|---------:|---------:|---------:|---------:|---------:|---------:|---------:|---------:|---------:|---------:|---------:|---------:|---------:|---------:|---------:|---------:|---------:|---------:|---------:|
|Cycling GCB                      | 0.0395984| 0.1081246| 0.0559223| 0.0710245| 0.0616711| 0.0533543| 0.0979920| 0.0964177| 0.1186603| 0.1209341| 0.0712608| 0.0789278| 0.0516074| 0.0549789| 0.0498489| 0.0476445| 0.0552712| 0.0689115| 0.0734266| 0.1173021| 0.0919118| 0.0553130| 0.0523104| 0.0793388| 0.0934505| 0.0728682| 0.0666667| 0.1315193| 0.1039297| 0.0765937| 0.1115044| 0.0838863|
|DZ early  Sphase                 | 0.1154490| 0.0885767| 0.1001942| 0.1030798| 0.0762599| 0.1227933| 0.0899598| 0.1067073| 0.0851675| 0.0896580| 0.0853563| 0.1105733| 0.0846024| 0.0957324| 0.1136707| 0.1033191| 0.0900716| 0.1037588| 0.1008159| 0.1456500| 0.1264706| 0.0761766| 0.1181343| 0.0776860| 0.1222045| 0.0749354| 0.0722222| 0.1156463| 0.0780765| 0.1122740| 0.0991150| 0.1071090|
|DZ G2Mphase                      | 0.2610151| 0.2095296| 0.2547573| 0.3111251| 0.1856764| 0.2530404| 0.2433735| 0.2801067| 0.2411483| 0.2472894| 0.2302271| 0.2319434| 0.2288494| 0.2210688| 0.2443353| 0.2762313| 0.0829069| 0.0673453| 0.0897436| 0.0674487| 0.0632353| 0.0771470| 0.0954664| 0.0942149| 0.0806709| 0.0635659| 0.0851852| 0.0657596| 0.0987590| 0.0861085| 0.0654867| 0.0597156|
|DZ GCB                           | 0.1606247| 0.1166768| 0.1095146| 0.1294783| 0.1564987| 0.1329933| 0.1437751| 0.1471037| 0.1148325| 0.1226022| 0.1613156| 0.1511541| 0.1395939| 0.1645521| 0.1529456| 0.1531049| 0.1351075| 0.1135474| 0.1311189| 0.0899316| 0.1639706| 0.1567200| 0.1394943| 0.1289256| 0.1253994| 0.1245478| 0.1425926| 0.1031746| 0.1587384| 0.1446242| 0.1256637| 0.1530806|
|DZ late Sphase                   | 0.0022309| 0.0036652| 0.0023301| 0.0100566| 0.0125995| 0.0015692| 0.0056225| 0.0057165| 0.0028708| 0.0029191| 0.0086139| 0.0022338| 0.0008460| 0.0003845| 0.0030211| 0.0010707| 0.1432958| 0.1542678| 0.1573427| 0.2258065| 0.1558824| 0.1339156| 0.1778553| 0.1520661| 0.1397764| 0.1509044| 0.1537037| 0.1553288| 0.1406412| 0.1607992| 0.1486726| 0.1445498|
|DZtoLZ GCB transition            | 0.0284439| 0.0916310| 0.0454369| 0.0716530| 0.1359416| 0.0325618| 0.0819277| 0.0274390| 0.0679426| 0.0371143| 0.0516836| 0.0126582| 0.0173435| 0.0249904| 0.0147281| 0.0240899| 0.3561924| 0.3253720| 0.3216783| 0.2121212| 0.2698529| 0.3498302| 0.1817786| 0.3008264| 0.2627796| 0.2961240| 0.2944444| 0.2845805| 0.2854188| 0.2649857| 0.2477876| 0.3042654|
|Early GC-committed NBC           | 0.0936977| 0.0830788| 0.0838835| 0.0565682| 0.0842175| 0.0819929| 0.0763052| 0.0773628| 0.0918660| 0.1005004| 0.0853563| 0.0889799| 0.0998308| 0.1068820| 0.0845921| 0.0813704| 0.1003071| 0.1147220| 0.0891608| 0.0811339| 0.0801471| 0.0989811| 0.0727986| 0.1024793| 0.1166134| 0.1431525| 0.1111111| 0.1009070| 0.0930714| 0.0932445| 0.1150442| 0.0943128|
|Early MBC                        | 0.2554378| 0.2272450| 0.2745631| 0.1653048| 0.2427056| 0.2620636| 0.1959839| 0.2057927| 0.2095694| 0.2176814| 0.2568520| 0.2583768| 0.2796108| 0.2764321| 0.2892749| 0.2591006| 0.0040942| 0.0187940| 0.0069930| 0.0009775| 0.0036765| 0.0145560| 0.0034874| 0.0099174| 0.0015974| 0.0082687| 0.0037037| 0.0056689| 0.0067218| 0.0123692| 0.0017699| 0.0199052|
|Early PC precursor               | 0.0223090| 0.0158827| 0.0073786| 0.0188561| 0.0238727| 0.0133386| 0.0289157| 0.0091463| 0.0191388| 0.0437865| 0.0203602| 0.0245719| 0.0541455| 0.0088428| 0.0147281| 0.0299786| 0.0214944| 0.0223179| 0.0163170| 0.0273705| 0.0272059| 0.0174672| 0.0200523| 0.0380165| 0.0351438| 0.0465116| 0.0500000| 0.0158730| 0.0201655| 0.0356803| 0.0548673| 0.0109005|
|GC-commited metabolic activation | 0.0211935| 0.0555895| 0.0660194| 0.0628536| 0.0205570| 0.0459004| 0.0361446| 0.0442073| 0.0488038| 0.0175146| 0.0289742| 0.0405808| 0.0427242| 0.0461361| 0.0320997| 0.0240899| 0.0112590| 0.0097886| 0.0134033| 0.0312805| 0.0169118| 0.0092188| 0.0174368| 0.0165289| 0.0223642| 0.0191214| 0.0157407| 0.0215420| 0.0124095| 0.0133206| 0.0300885| 0.0199052|
|GCB-IFN                          | 0.0000000| 0.0000000| 0.0000000| 0.0000000| 0.0000000| 0.0003923| 0.0000000| 0.0000000| 0.0000000| 0.0000000| 0.0000000| 0.0000000| 0.0008460| 0.0000000| 0.0007553| 0.0000000| 0.0000000| 0.0011746| 0.0000000| 0.0009775| 0.0007353| 0.0106744| 0.1211857| 0.0000000| 0.0000000| 0.0000000| 0.0046296| 0.0000000| 0.0020683| 0.0000000| 0.0000000| 0.0023697|
fit <- lmFit(props$TransformedProps, design)
fit <- eBayes(fit, robust=TRUE)
coef = "age"
toptable.transformedProps <- topTable(fit, coef = coef)
cat(paste('### ', tissue, '\n', sep = ""))### Tonsilsprint(knitr::kable(toptable.transformedProps, caption = paste0("Transformed proportions (Subclustering) Toptable results: ", tissue)))
Table: Transformed proportions (Subclustering) Toptable results: Tonsils

|                                 |      logFC|   AveExpr|          t|   P.Value| adj.P.Val|         B|
|:--------------------------------|----------:|---------:|----------:|---------:|---------:|---------:|
|DZ G2Mphase                      | -0.0120666| 0.3993427| -1.8553226| 0.0736045| 0.2733602| -6.377029|
|DZtoLZ GCB transition            |  0.0183839| 0.3854512|  1.7106599| 0.0976804| 0.2733602| -6.617411|
|DZ late Sphase                   |  0.0160687| 0.2321274|  1.6697205| 0.1055925| 0.2733602| -6.682551|
|Early MBC                        | -0.0191510| 0.2974614| -1.6265012| 0.1145181| 0.2733602| -6.749901|
|Early PC precursor               |  0.0042236| 0.1553675|  1.5819079| 0.1242547| 0.2733602| -6.817748|
|Early GC-committed NBC           |  0.0023276| 0.3092810|  1.2191277| 0.2323827| 0.4260350| -7.309426|
|DZ early  Sphase                 | -0.0018434| 0.3201743| -0.9180318| 0.3659920| 0.5751303| -7.629142|
|Cycling GCB                      |  0.0024629| 0.2807144|  0.8014057| 0.4292573| 0.5902287| -7.730154|
|GC-commited metabolic activation | -0.0018096| 0.1638320| -0.6044196| 0.5501510| 0.6724068| -7.870751|
|DZ GCB                           | -0.0004815| 0.3787401| -0.2371690| 0.8141528| 0.8955680| -8.029207|
Save results for GCcell population
if (!file.exists(out)) {
  write.xlsx(toptable.transformedProps, file = out, rowNames = TRUE, sheetName = "GCcell_subclustering")
} else {
  write.xlsx(toptable.transformedProps, file = out, rowNames = TRUE, sheetName = "GCcell_subclustering", append = TRUE)
}
Session Info
sessionInfo()R version 4.3.2 (2023-10-31)
Platform: aarch64-apple-darwin20 (64-bit)
Running under: macOS 15.3
Matrix products: default
BLAS: /Library/Frameworks/R.framework/Versions/4.3-arm64/Resources/lib/libRblas.0.dylib
LAPACK: /Library/Frameworks/R.framework/Versions/4.3-arm64/Resources/lib/libRlapack.dylib; LAPACK version 3.11.0
locale:
[1] en_US.UTF-8/en_US.UTF-8/en_US.UTF-8/C/en_US.UTF-8/en_US.UTF-8
time zone: Australia/Melbourne
tzcode source: internal
attached base packages:
[1] stats4 stats graphics grDevices utils datasets methods
[8] base
other attached packages:
[1] openxlsx_4.2.5.2 knitr_1.45
[3] kableExtra_1.4.0 edgeR_4.0.16
[5] limma_3.58.1 speckle_1.2.0
[7] ggridges_0.5.6 scran_1.30.2
[9] scuttle_1.12.0 SingleCellExperiment_1.24.0
[11] SummarizedExperiment_1.32.0 Biobase_2.62.0
[13] GenomicRanges_1.54.1 GenomeInfoDb_1.38.6
[15] IRanges_2.36.0 S4Vectors_0.40.2
[17] BiocGenerics_0.48.1 MatrixGenerics_1.14.0
[19] matrixStats_1.2.0 RColorBrewer_1.1-3
[21] ggforce_0.4.2 viridis_0.6.5
[23] viridisLite_0.4.2 paletteer_1.6.0
[25] gridExtra_2.3 lubridate_1.9.3
[27] forcats_1.0.0 stringr_1.5.1
[29] purrr_1.0.2 readr_2.1.5
[31] tidyr_1.3.1 tibble_3.2.1
[33] ggplot2_3.5.0 tidyverse_2.0.0
[35] dplyr_1.1.4 Seurat_5.0.1.9009
[37] SeuratObject_5.0.1 sp_2.1-3
[39] patchwork_1.2.0 glue_1.7.0
[41] here_1.0.1 workflowr_1.7.1
loaded via a namespace (and not attached):
[1] RcppAnnoy_0.0.22 splines_4.3.2
[3] later_1.3.2 bitops_1.0-7
[5] polyclip_1.10-6 fastDummies_1.7.3
[7] lifecycle_1.0.4 rprojroot_2.0.4
[9] globals_0.16.2 processx_3.8.3
[11] lattice_0.22-5 MASS_7.3-60.0.1
[13] magrittr_2.0.3 plotly_4.10.4
[15] sass_0.4.8 rmarkdown_2.25
[17] jquerylib_0.1.4 yaml_2.3.8
[19] metapod_1.10.1 httpuv_1.6.14
[21] sctransform_0.4.1 zip_2.3.1
[23] spam_2.10-0 spatstat.sparse_3.0-3
[25] reticulate_1.35.0 cowplot_1.1.3
[27] pbapply_1.7-2 abind_1.4-5
[29] zlibbioc_1.48.0 Rtsne_0.17
[31] RCurl_1.98-1.14 tweenr_2.0.3
[33] git2r_0.33.0 GenomeInfoDbData_1.2.11
[35] ggrepel_0.9.5 irlba_2.3.5.1
[37] listenv_0.9.1 spatstat.utils_3.0-4
[39] goftest_1.2-3 RSpectra_0.16-1
[41] dqrng_0.3.2 spatstat.random_3.2-2
[43] fitdistrplus_1.1-11 parallelly_1.37.0
[45] svglite_2.1.3 DelayedMatrixStats_1.24.0
[47] DelayedArray_0.28.0 leiden_0.4.3.1
[49] codetools_0.2-19 xml2_1.3.6
[51] tidyselect_1.2.0 farver_2.1.1
[53] ScaledMatrix_1.10.0 spatstat.explore_3.2-6
[55] jsonlite_1.8.8 BiocNeighbors_1.20.2
[57] ellipsis_0.3.2 progressr_0.14.0
[59] survival_3.5-8 systemfonts_1.0.5
[61] tools_4.3.2 ica_1.0-3
[63] Rcpp_1.0.12 SparseArray_1.2.4
[65] xfun_0.42 withr_3.0.0
[67] fastmap_1.1.1 bluster_1.12.0
[69] fansi_1.0.6 rsvd_1.0.5
[71] callr_3.7.5 digest_0.6.34
[73] timechange_0.3.0 R6_2.5.1
[75] mime_0.12 colorspace_2.1-0
[77] scattermore_1.2 tensor_1.5
[79] spatstat.data_3.0-4 utf8_1.2.4
[81] generics_0.1.3 data.table_1.15.0
[83] httr_1.4.7 htmlwidgets_1.6.4
[85] S4Arrays_1.2.0 whisker_0.4.1
[87] uwot_0.1.16 pkgconfig_2.0.3
[89] gtable_0.3.4 lmtest_0.9-40
[91] XVector_0.42.0 htmltools_0.5.7
[93] dotCall64_1.1-1 scales_1.3.0
[95] png_0.1-8 rstudioapi_0.15.0
[97] tzdb_0.4.0 reshape2_1.4.4
[99] nlme_3.1-164 cachem_1.0.8
[101] zoo_1.8-12 KernSmooth_2.23-22
[103] parallel_4.3.2 miniUI_0.1.1.1
[105] pillar_1.9.0 grid_4.3.2
[107] vctrs_0.6.5 RANN_2.6.1
[109] promises_1.2.1 BiocSingular_1.18.0
[111] beachmat_2.18.1 xtable_1.8-4
[113] cluster_2.1.6 evaluate_0.23
[115] locfit_1.5-9.8 cli_3.6.2
[117] compiler_4.3.2 rlang_1.1.3
[119] crayon_1.5.2 future.apply_1.11.1
[121] labeling_0.4.3 rematch2_2.1.2
[123] ps_1.7.6 getPass_0.2-4
[125] plyr_1.8.9 fs_1.6.3
[127] stringi_1.8.3 BiocParallel_1.36.0
[129] deldir_2.0-2 munsell_0.5.0
[131] lazyeval_0.2.2 spatstat.geom_3.2-8
[133] Matrix_1.6-5 RcppHNSW_0.6.0
[135] hms_1.1.3 sparseMatrixStats_1.14.0
[137] future_1.33.1 statmod_1.5.0
[139] shiny_1.8.0 highr_0.10
[141] ROCR_1.0-11 igraph_2.0.2
[143] bslib_0.6.1